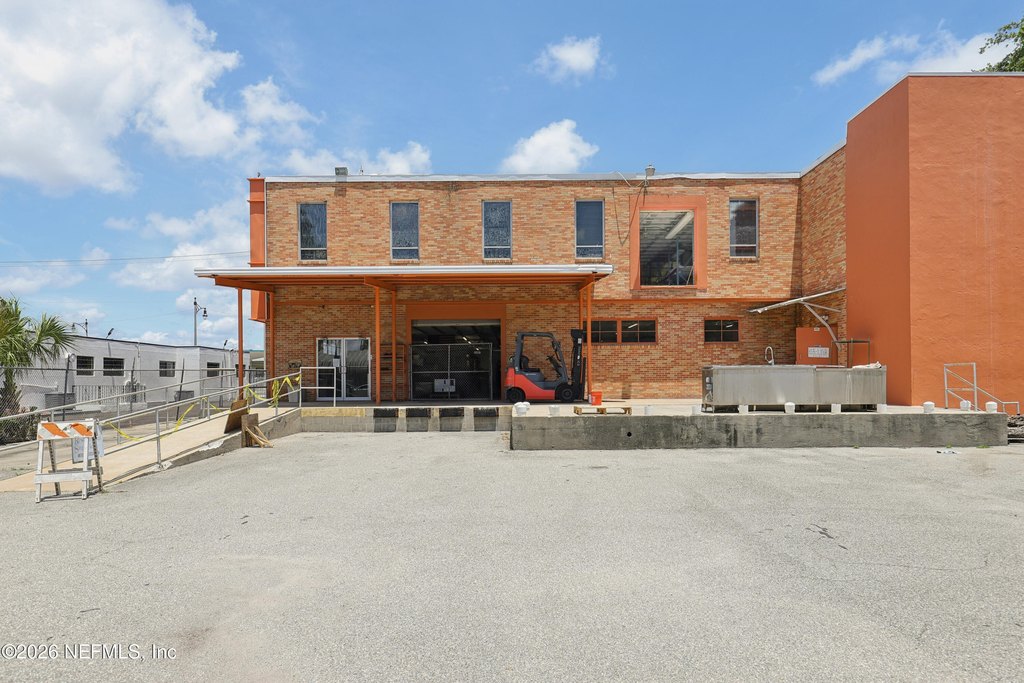
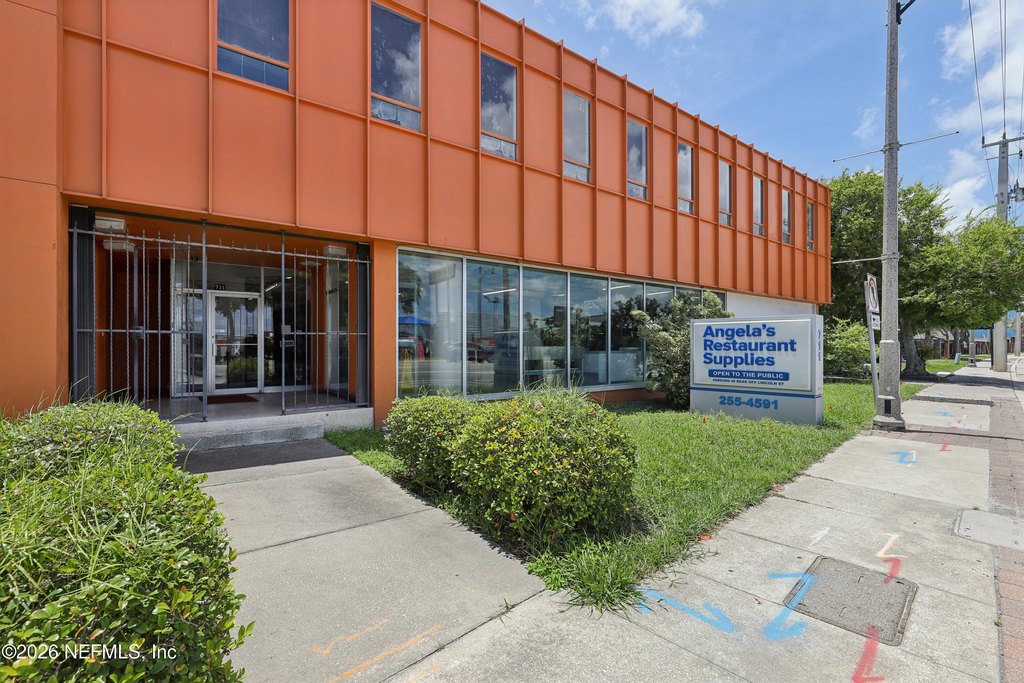
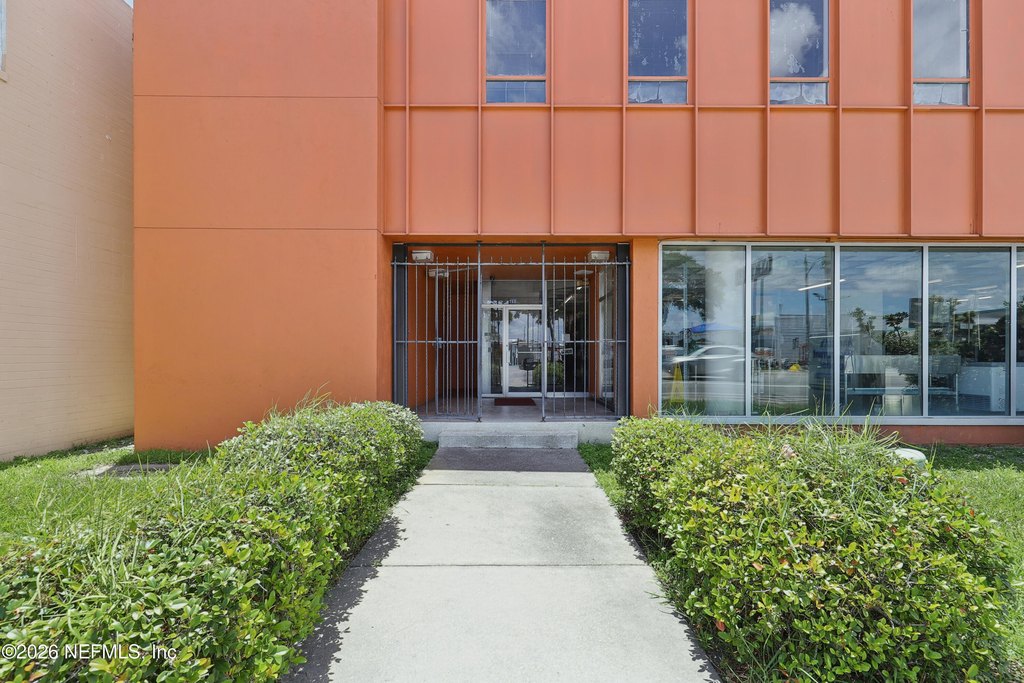
Two-Story Mixed-Use
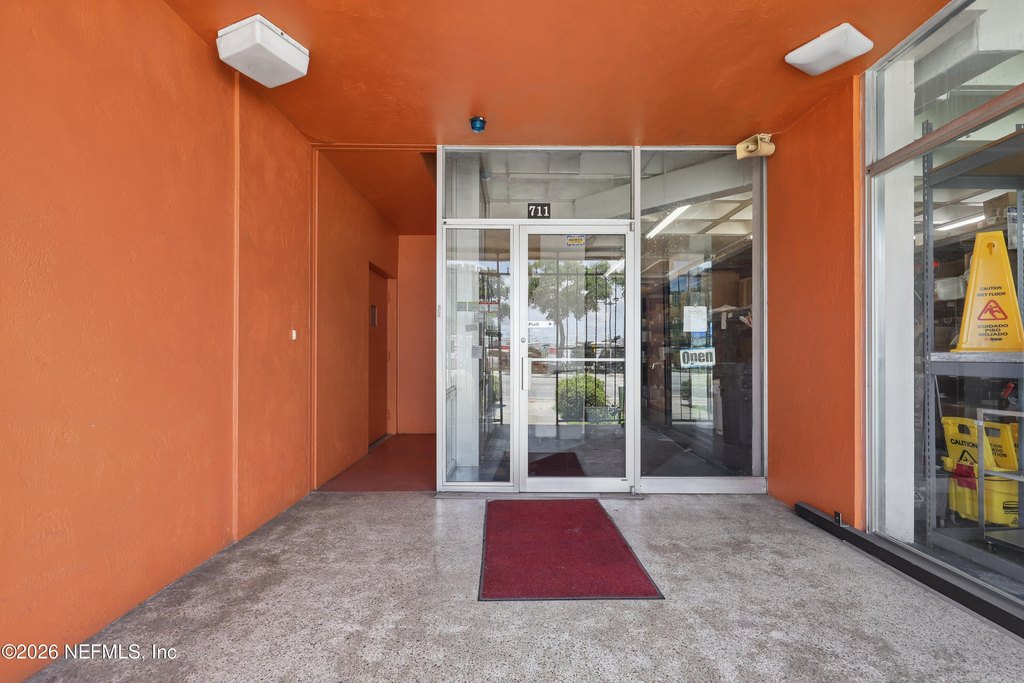
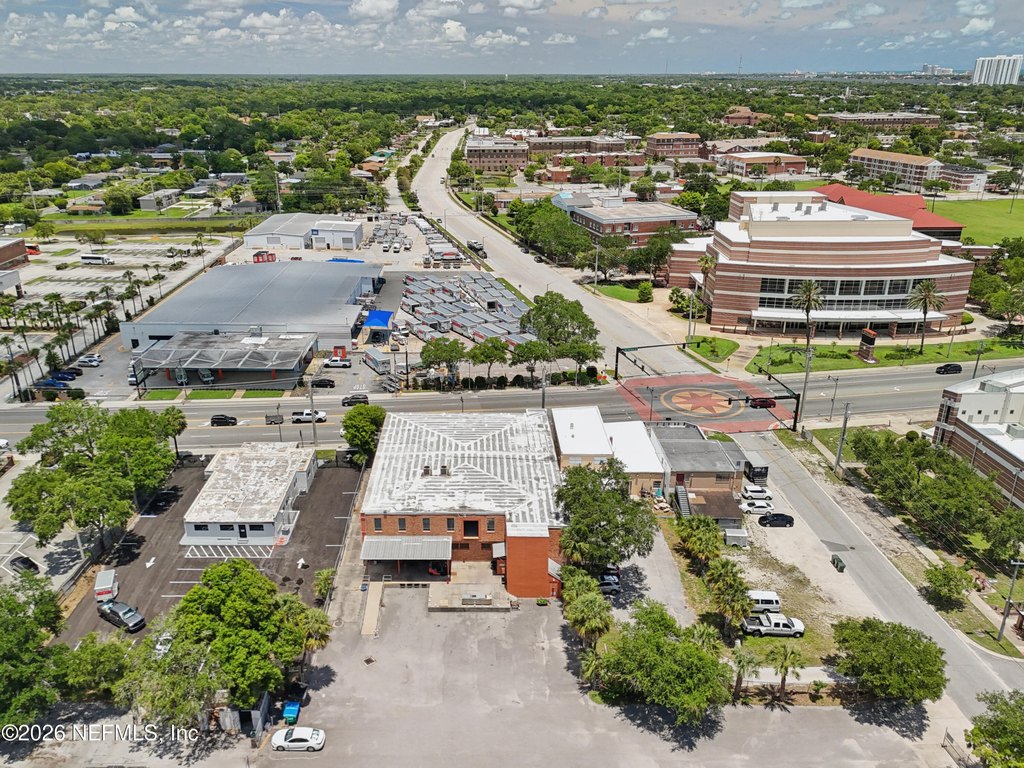
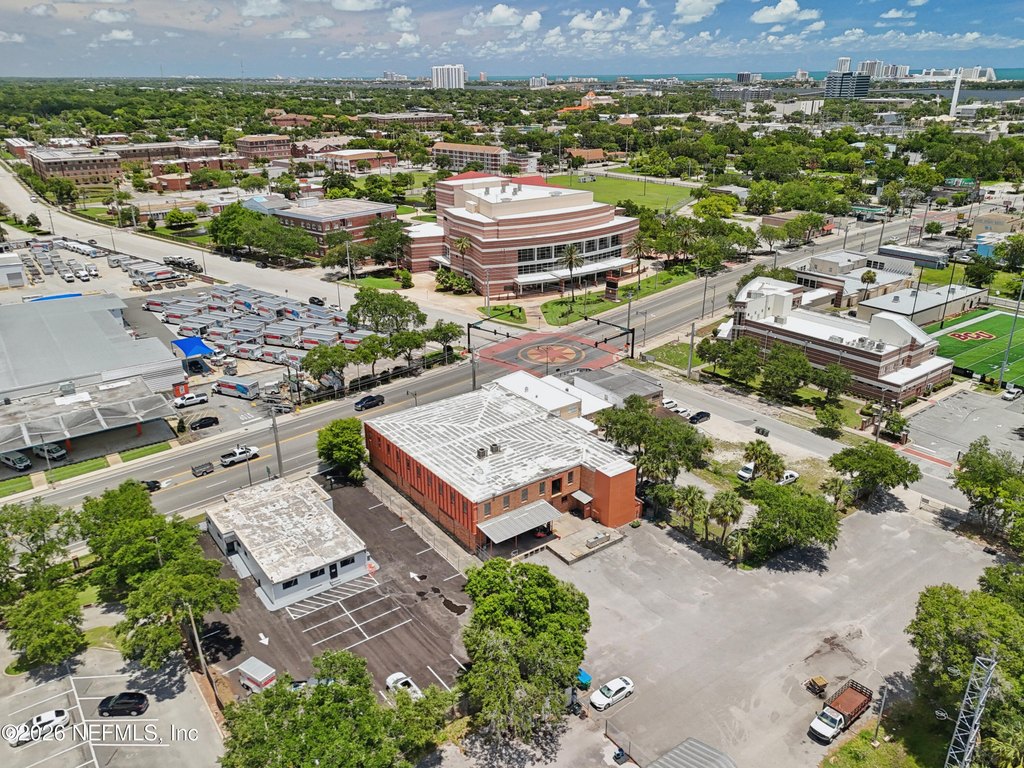
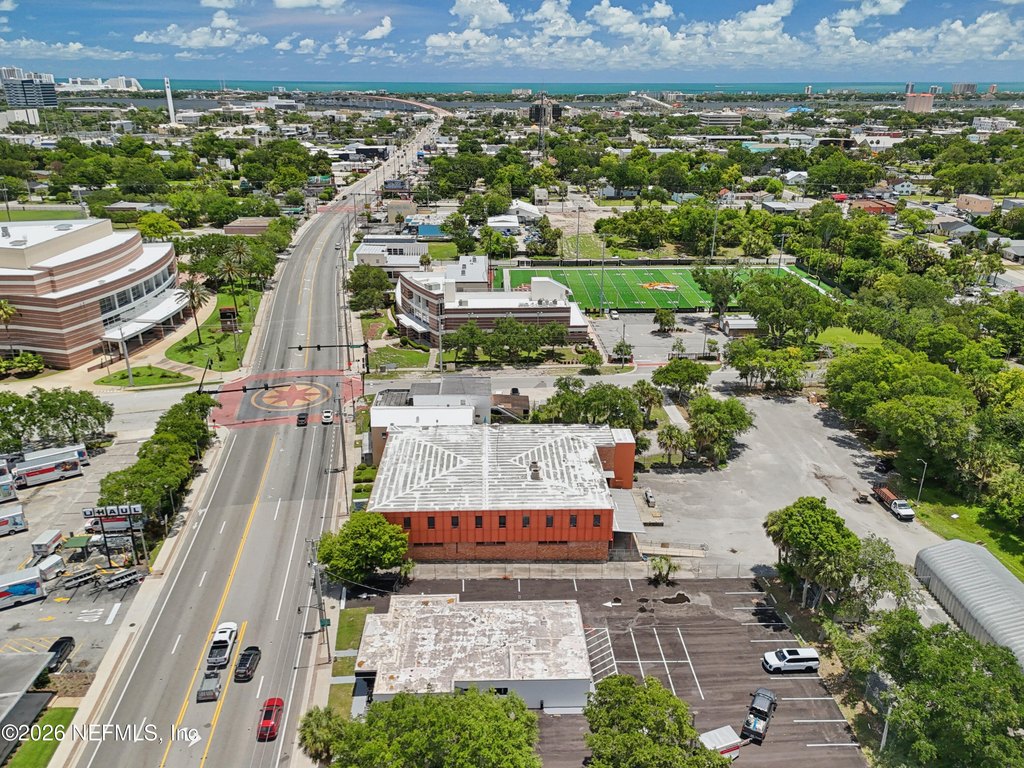
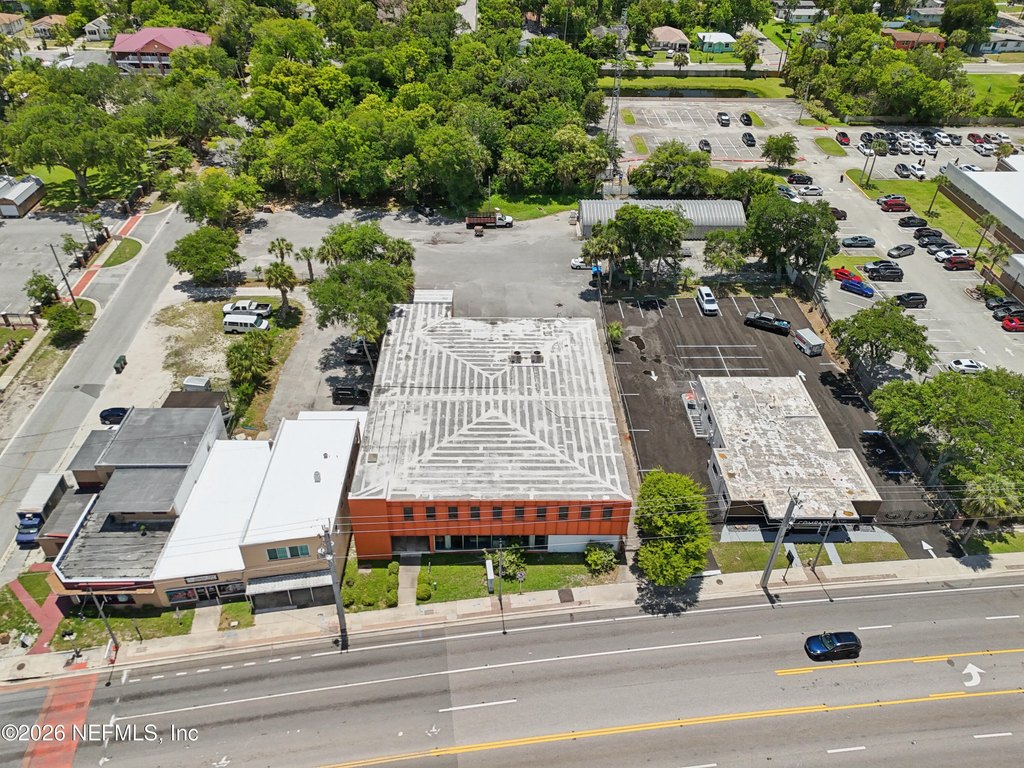
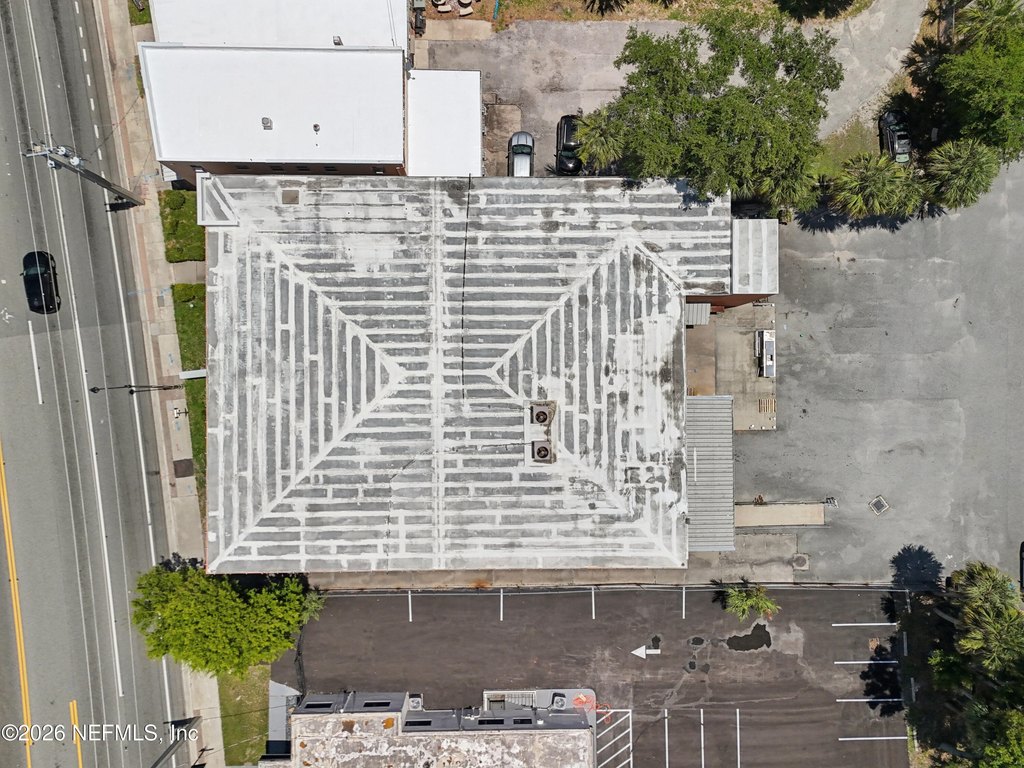
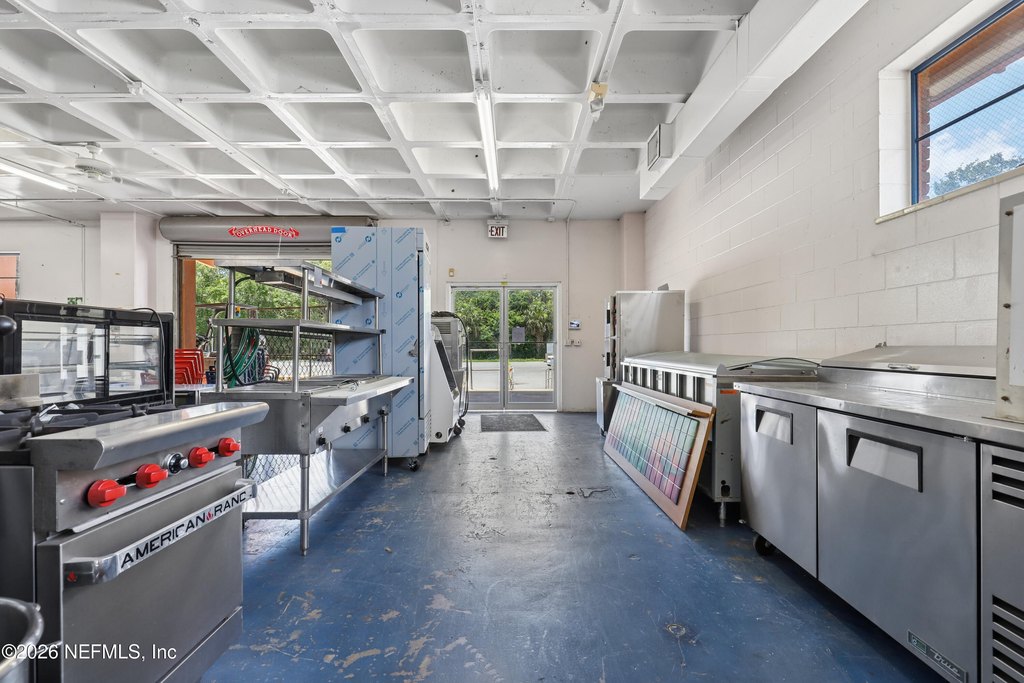
For Sale
$3,040,000
711 W INTL SPEEDWAY Boulevard W, Daytona Beach, FL 32114
Commercial Sale, Daytona Beach, FL
Property Size17,676 SF
Lot Size0.41 Acres
Price / SF$171.98
Days on Market139
Property Features for 711 W INTL SPEEDWAY Boulevard W
General Information
Property type
Commercial Sale
Property subtype
Other
Lot features
Few Trees
Directions
I 95 to exit 261 turn east, go 4 miles and its a two story building on the right.
Subdivision
621-Volusia County-North Central
Standard status
Active
APN
533976030060
Size
17,676 SF
Lot size
0.41 Acres
Taxes and HOA fees
Tax Year
2025
Tax Annual Amount
7412
Amenities
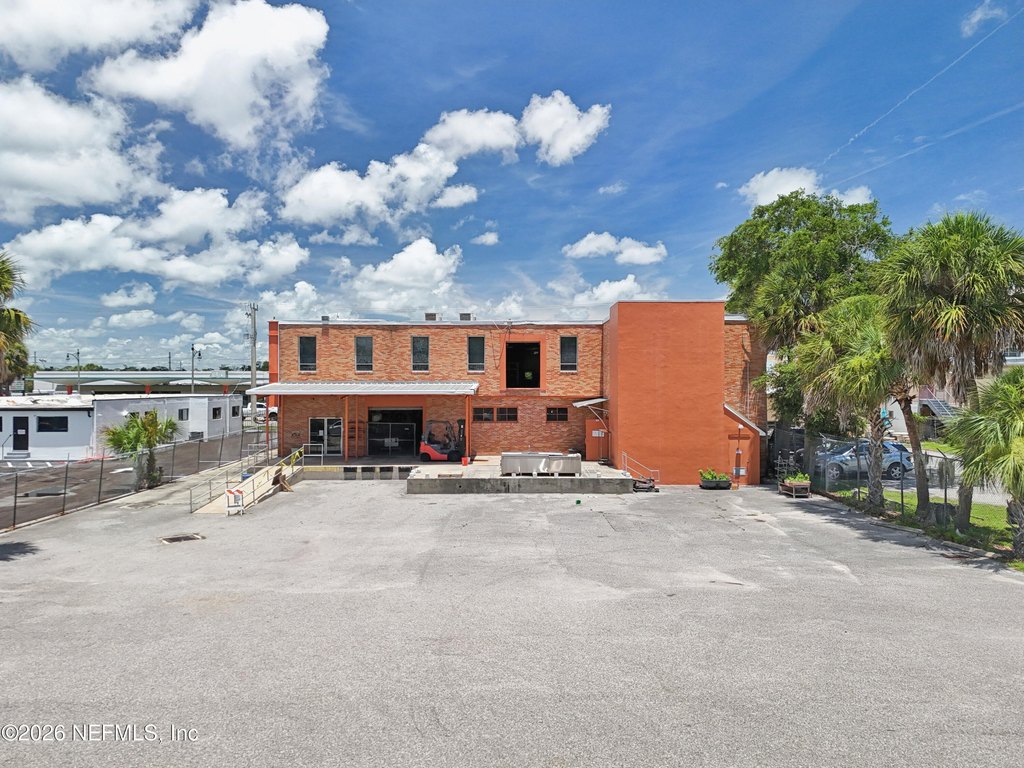
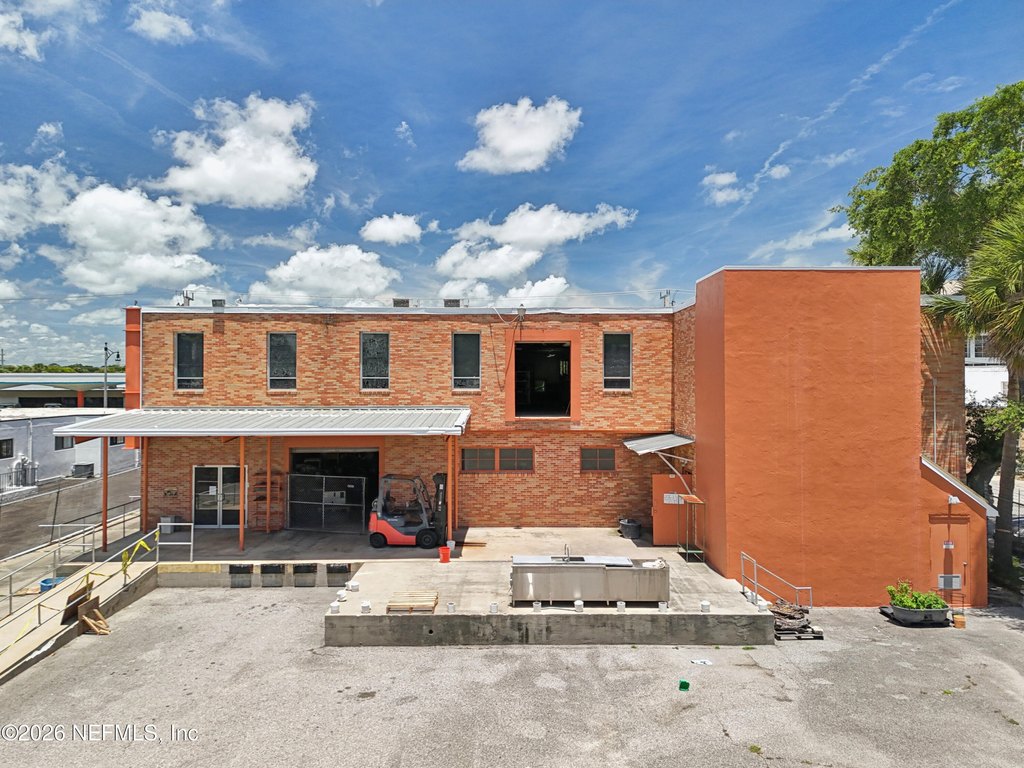
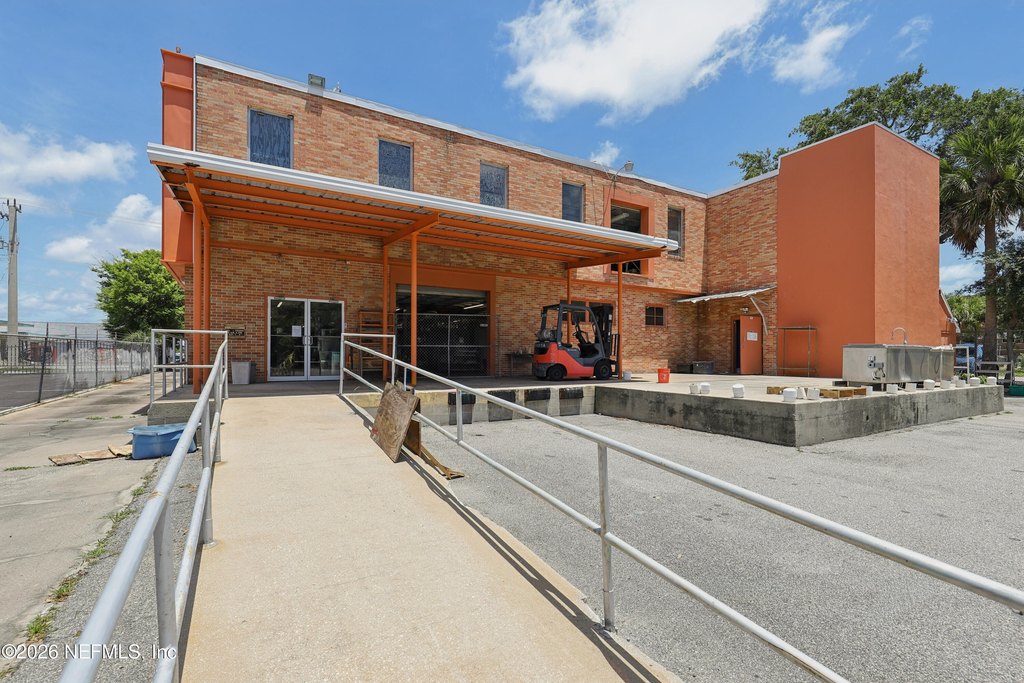
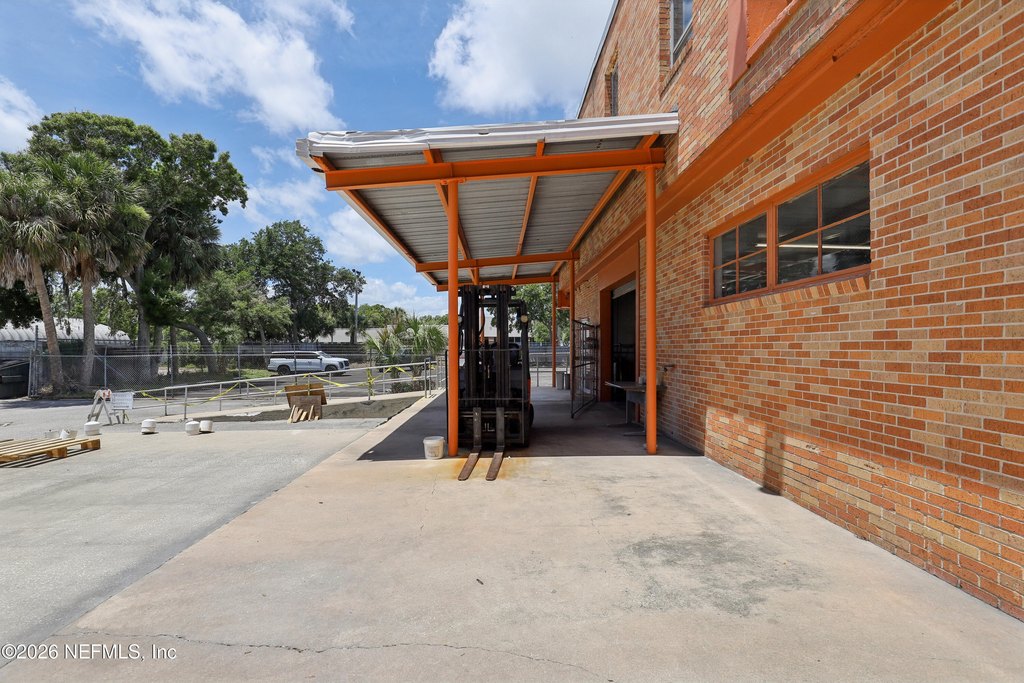
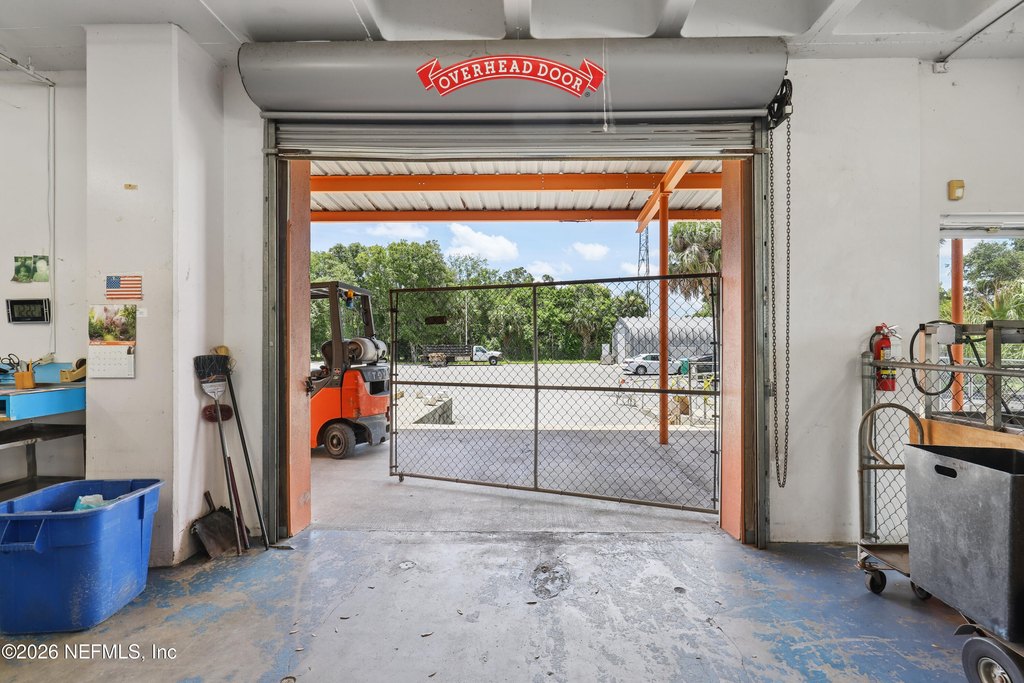
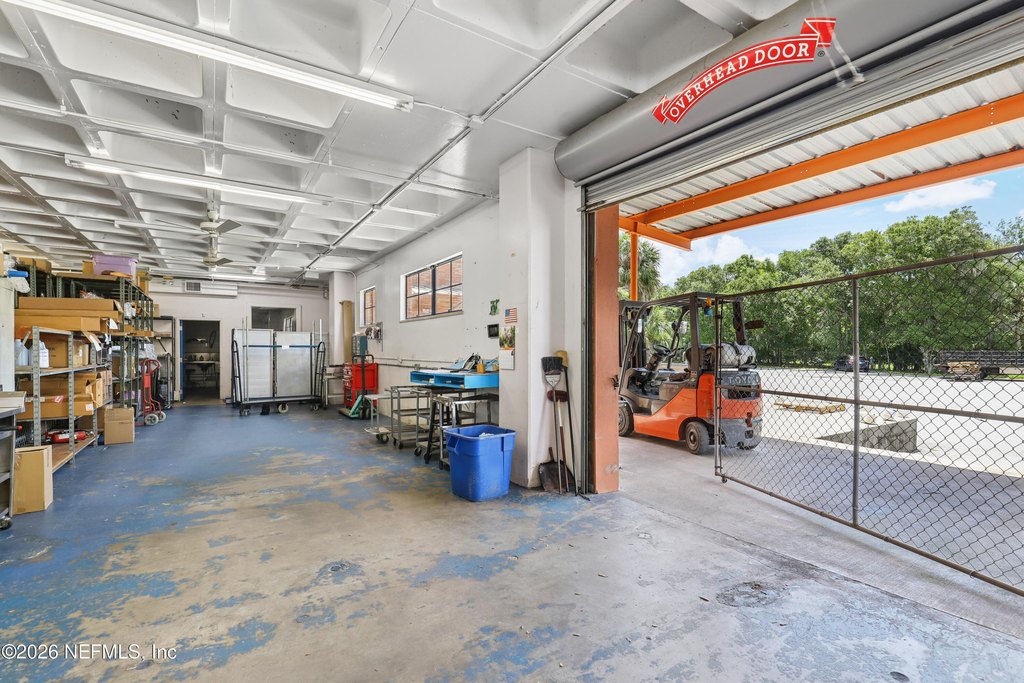
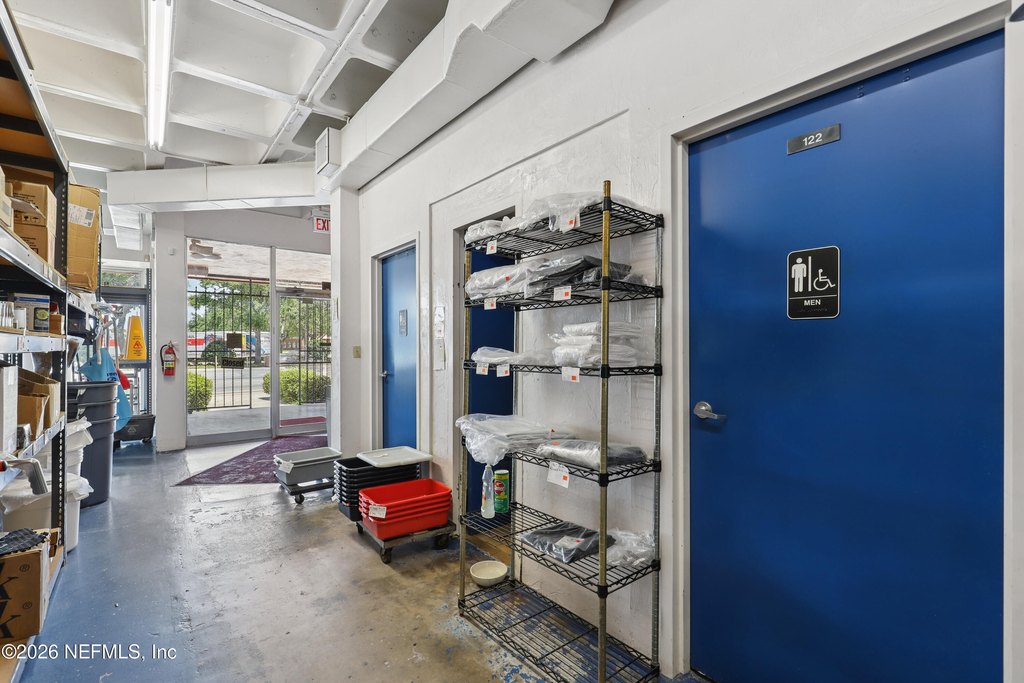
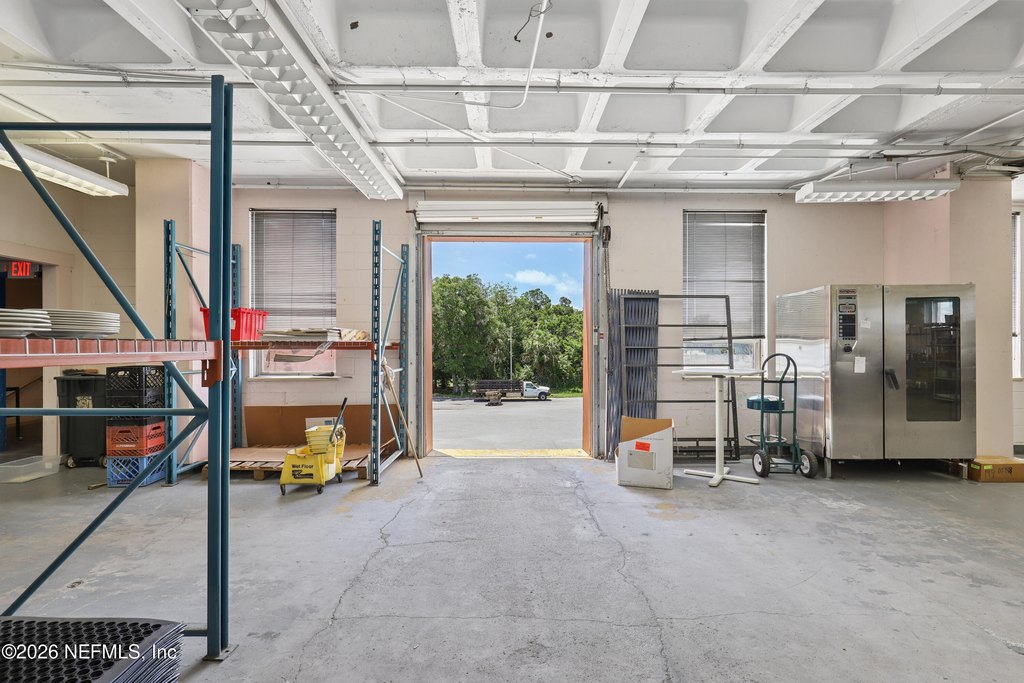
loading dock
Building Details
Year built
1959
Listing Agency:
COLDWELL BANKER VANGUARD REALTY · Coldwell Banker Real Estate
(904) 269-7117
Listed By:
STACEY BURKINS · License #3168969
(904) 591-3638
Added: Jun 1
Changed: Oct 8
Last Checked: Oct 17 at 8:06PM
MLS# 2148263
Copyright © 2026 realMLS. All rights reserved. All information provided by the listing agent/broker is deemed reliable but is not guaranteed and should be independently verified.

Ask AI about this property
Review the available facts, identify missing information and prepare questions for the agent.
Investment Insights
Based on property information with market context.
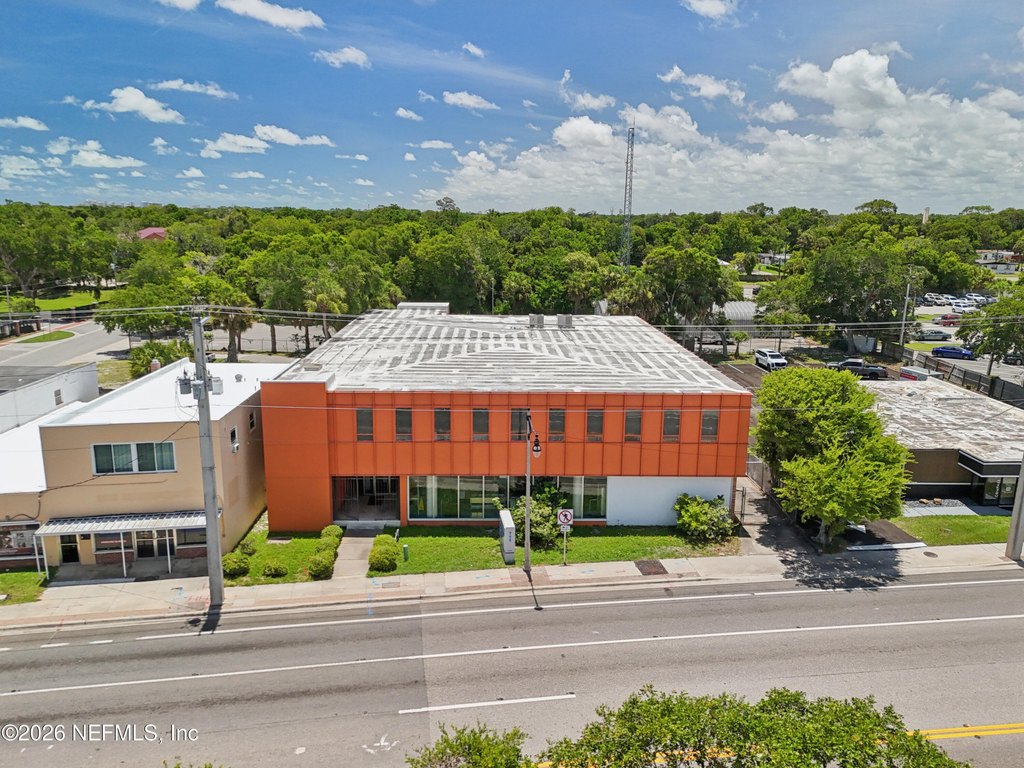
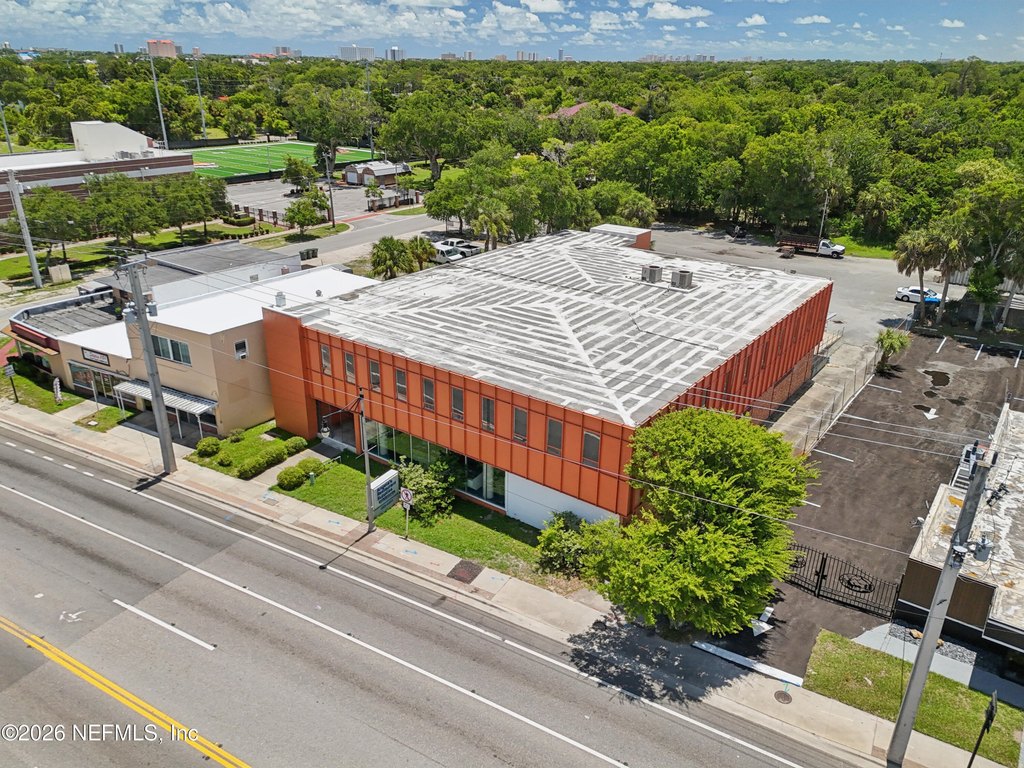
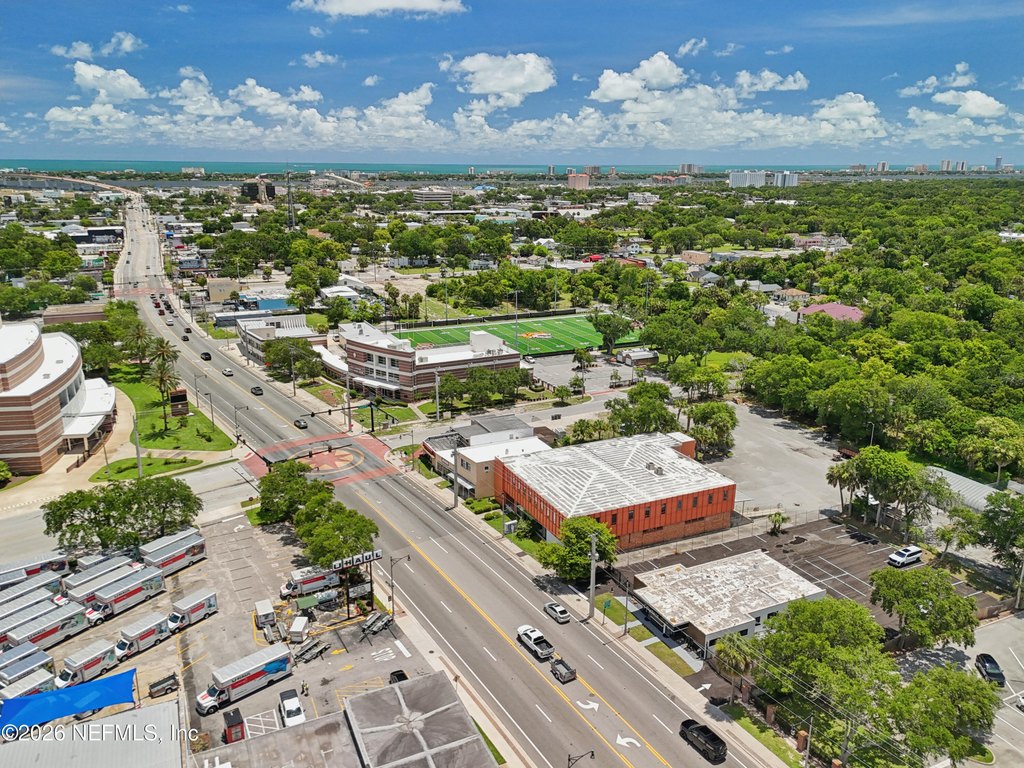
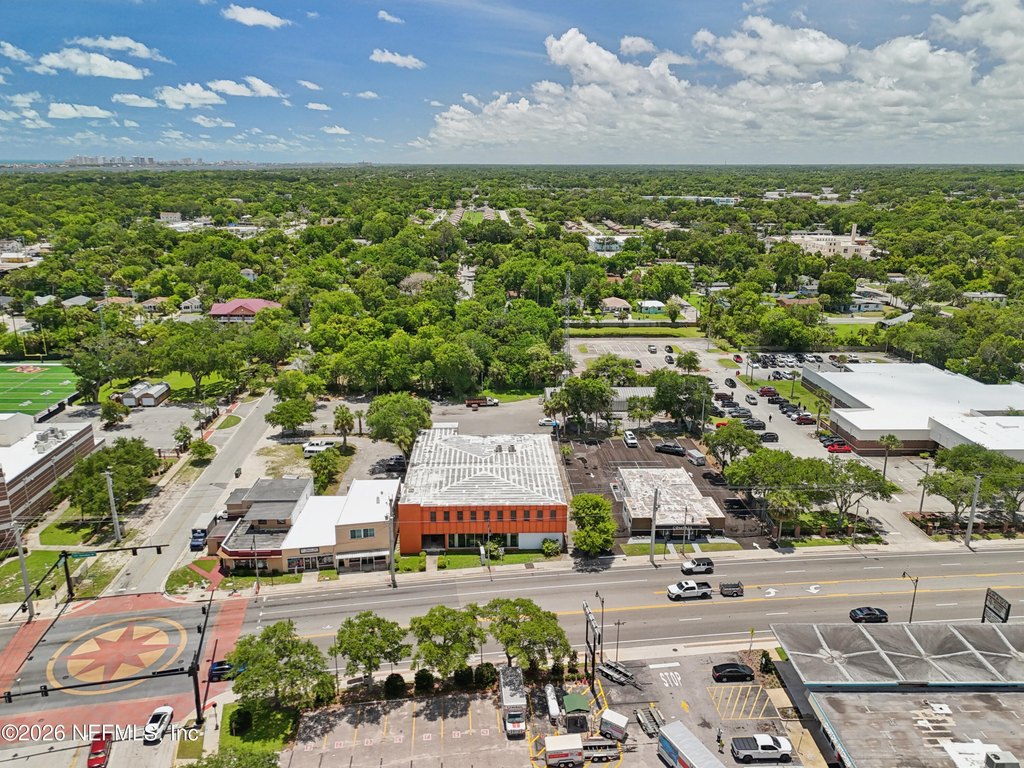
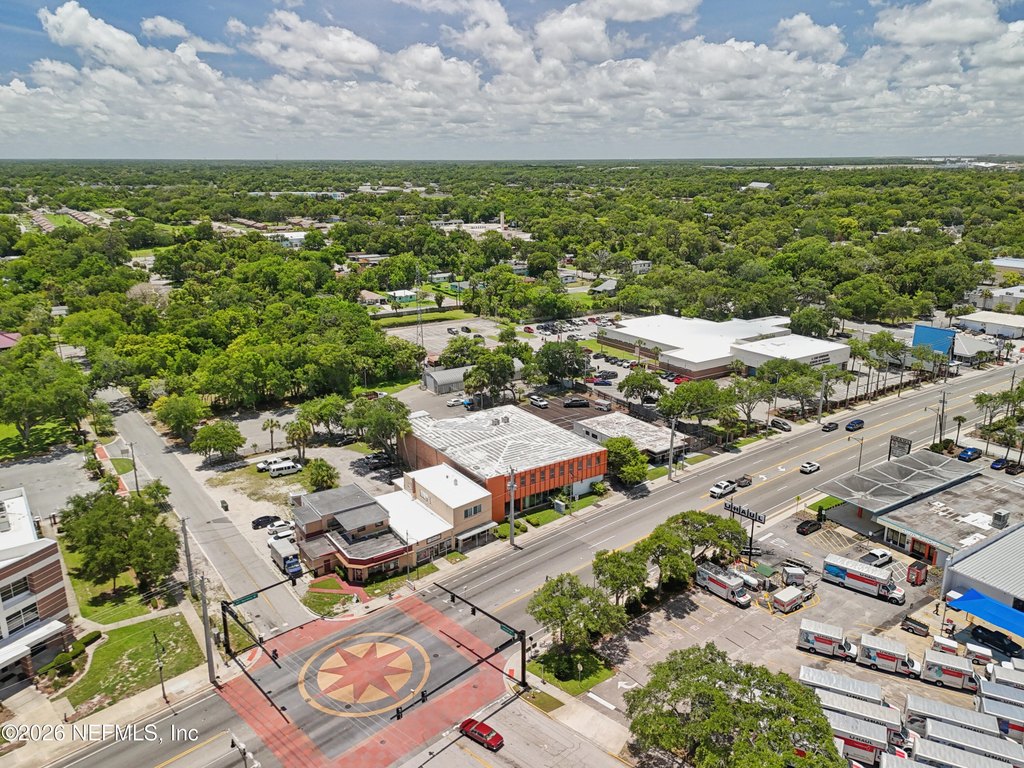
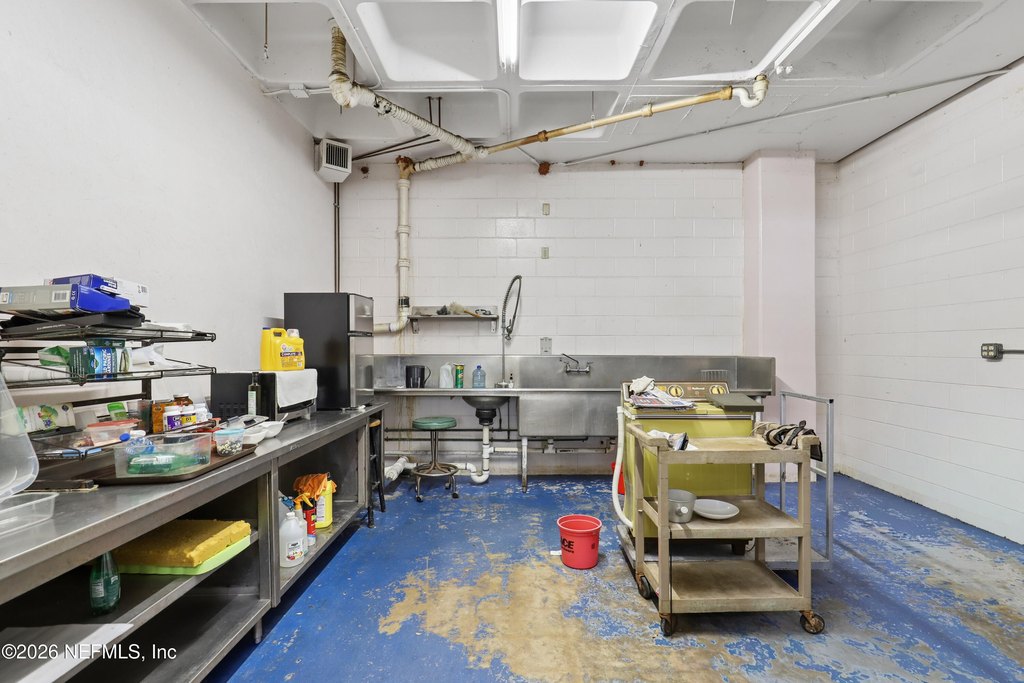
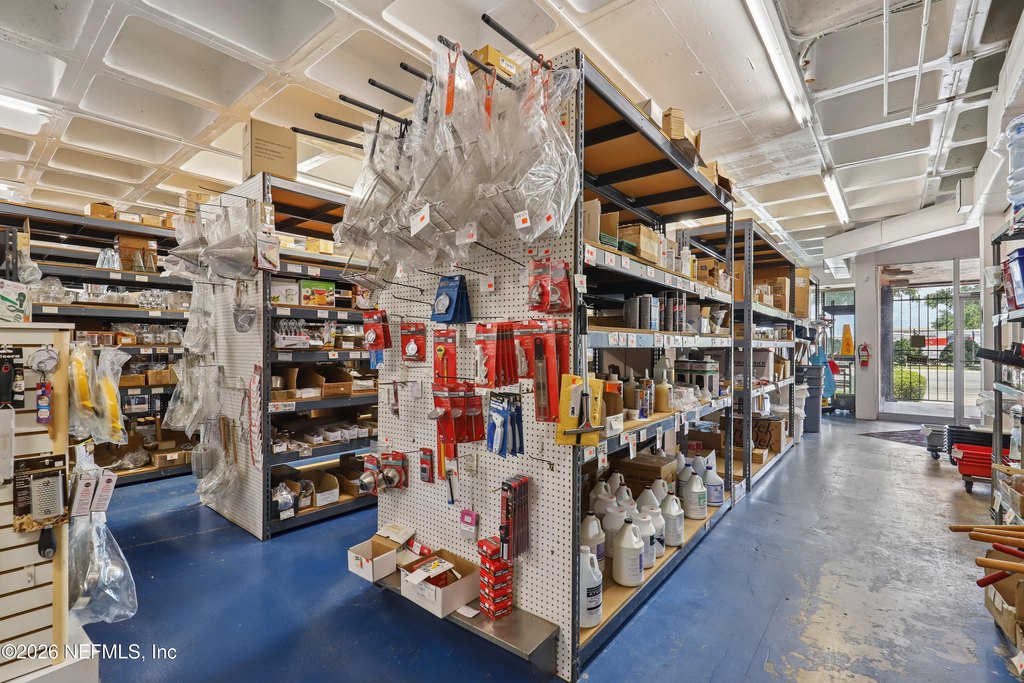
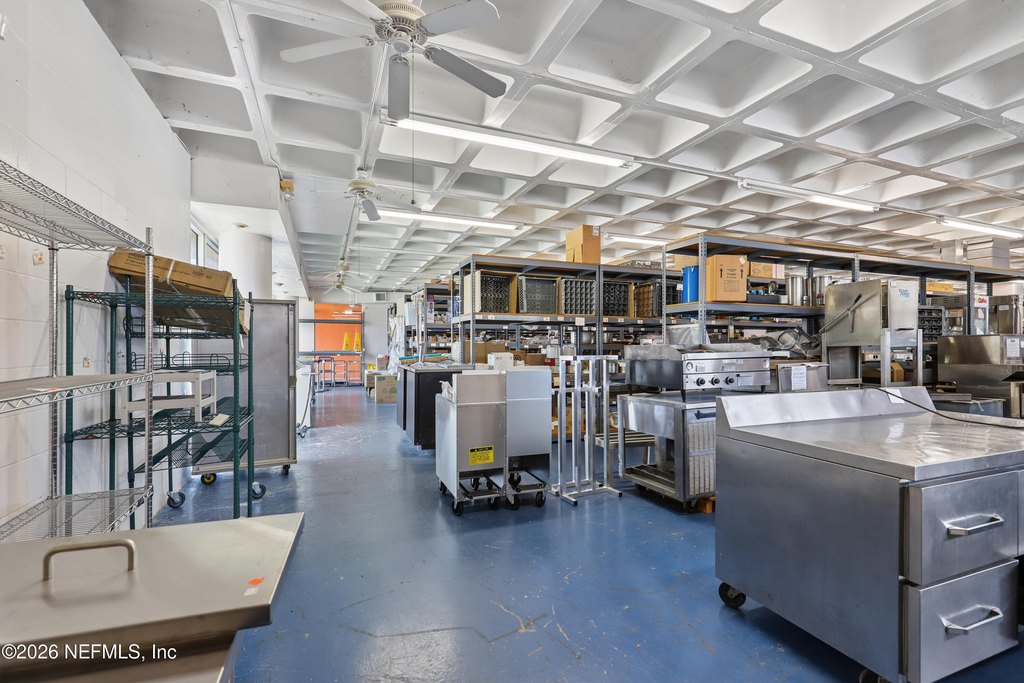
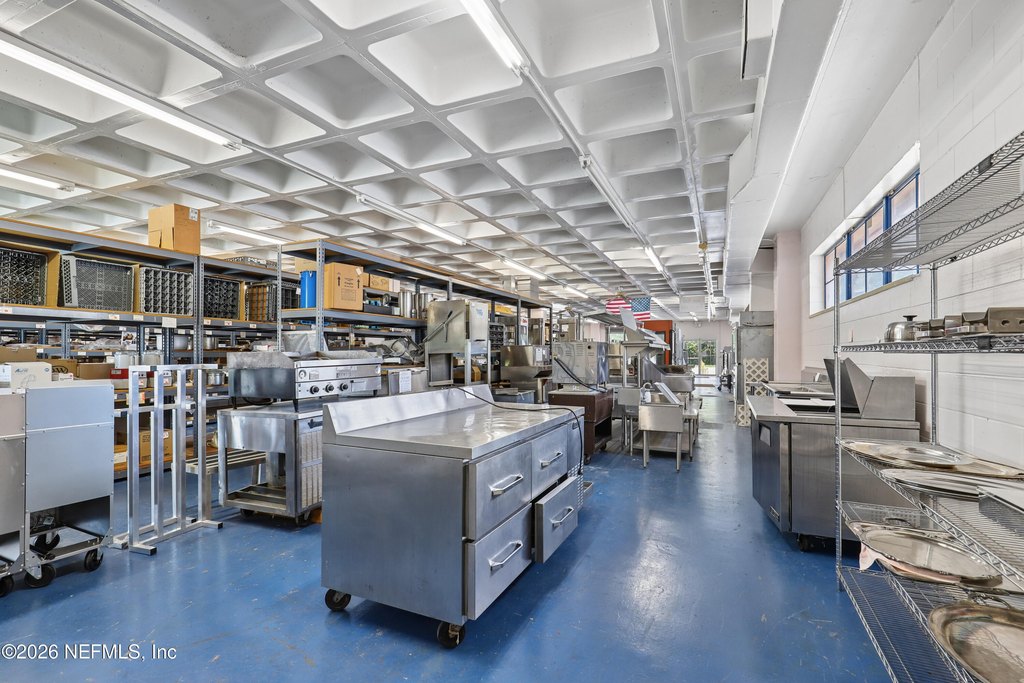
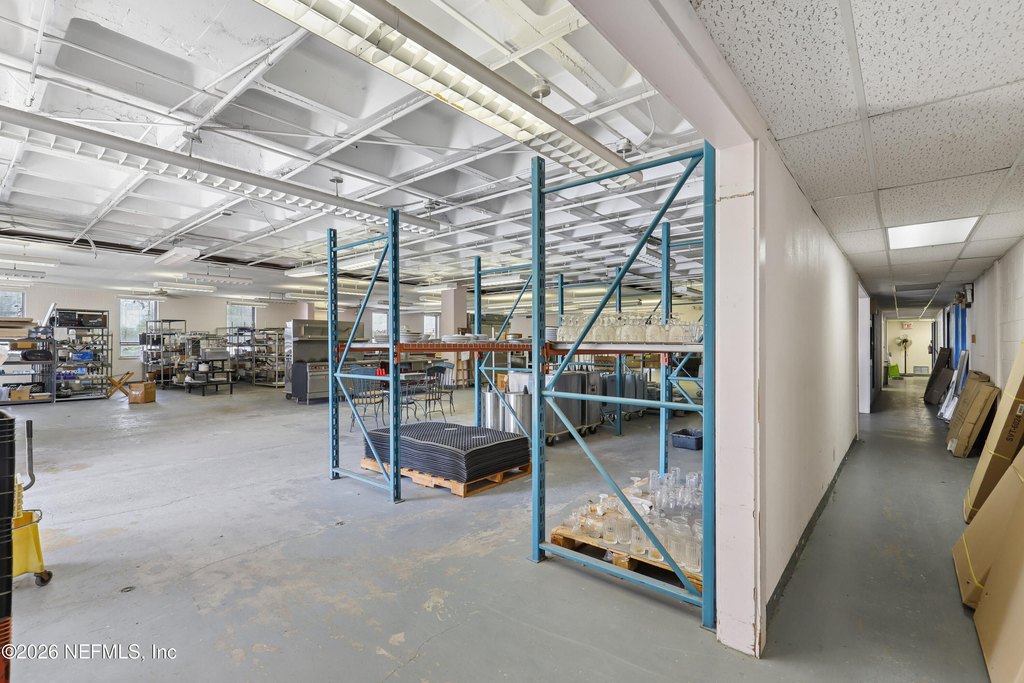
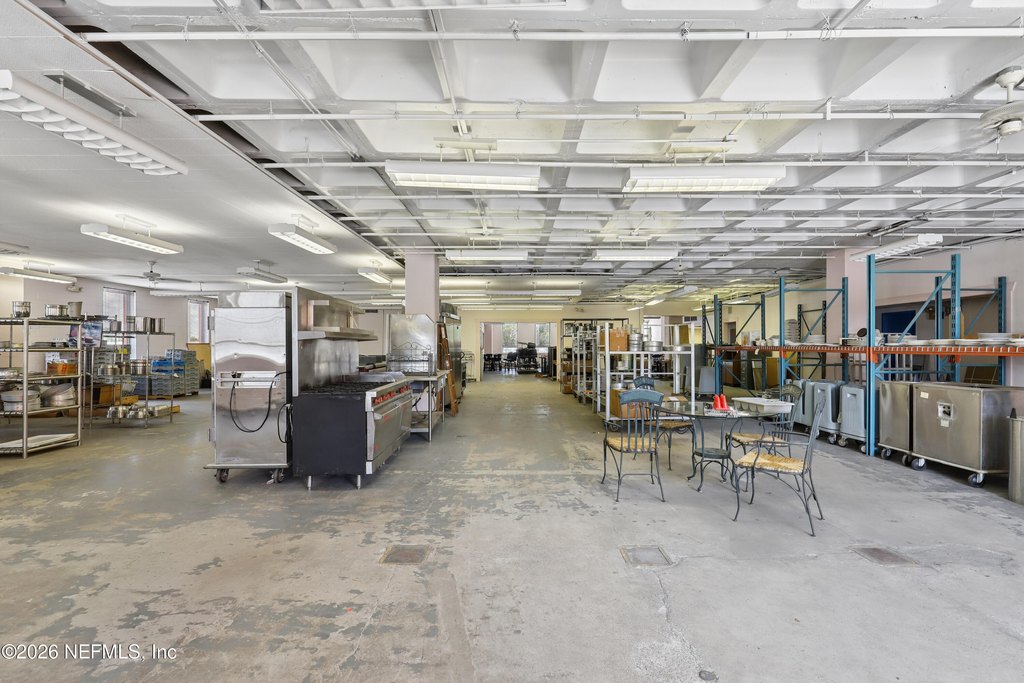
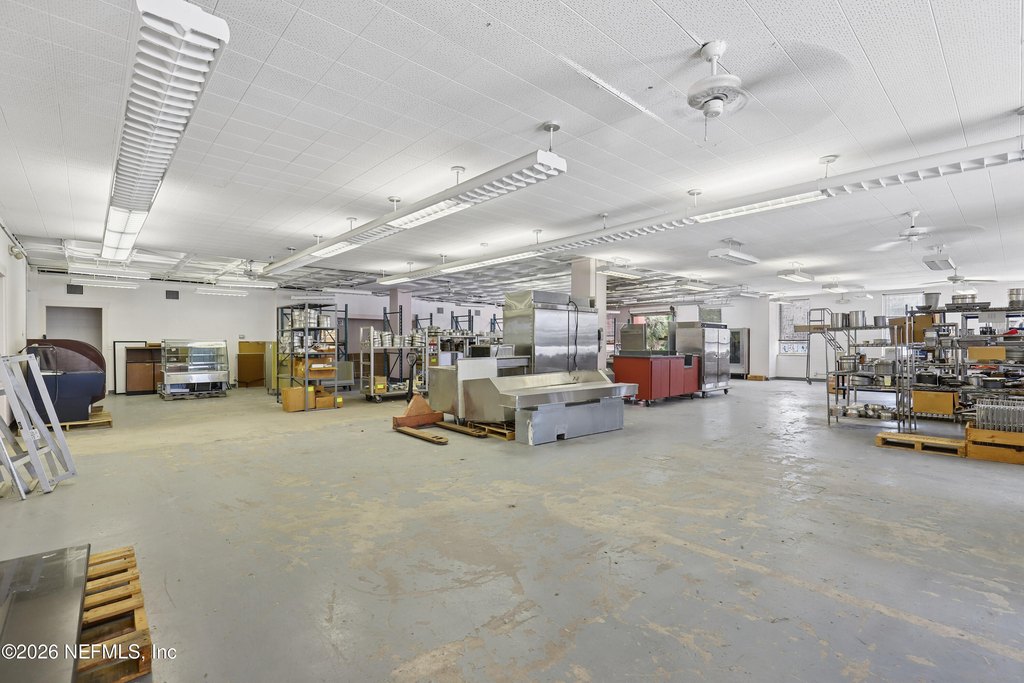
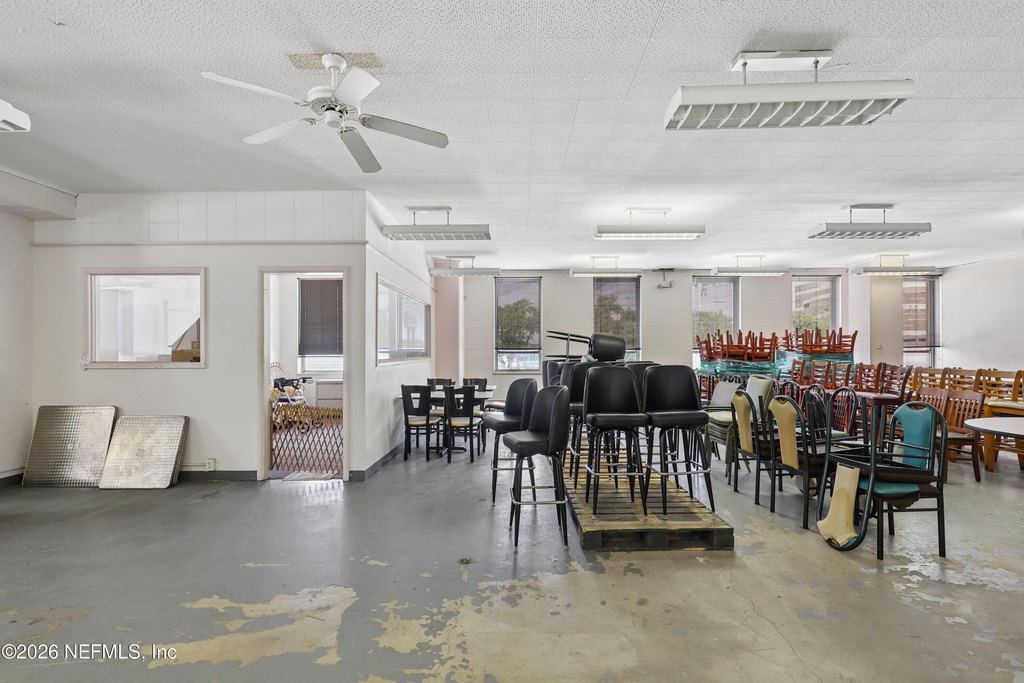
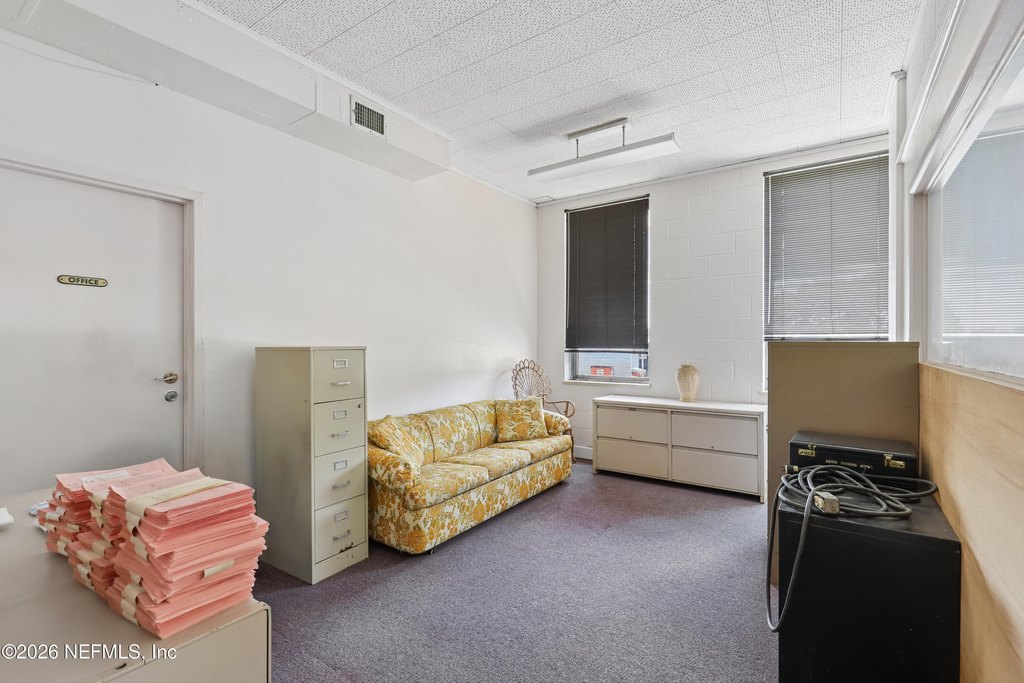
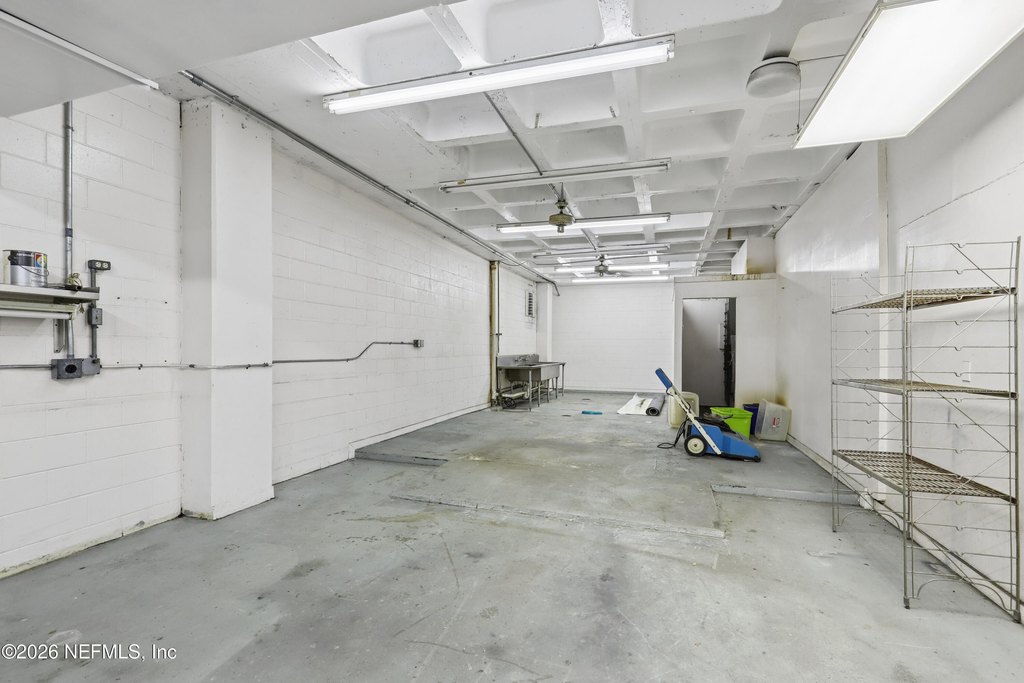
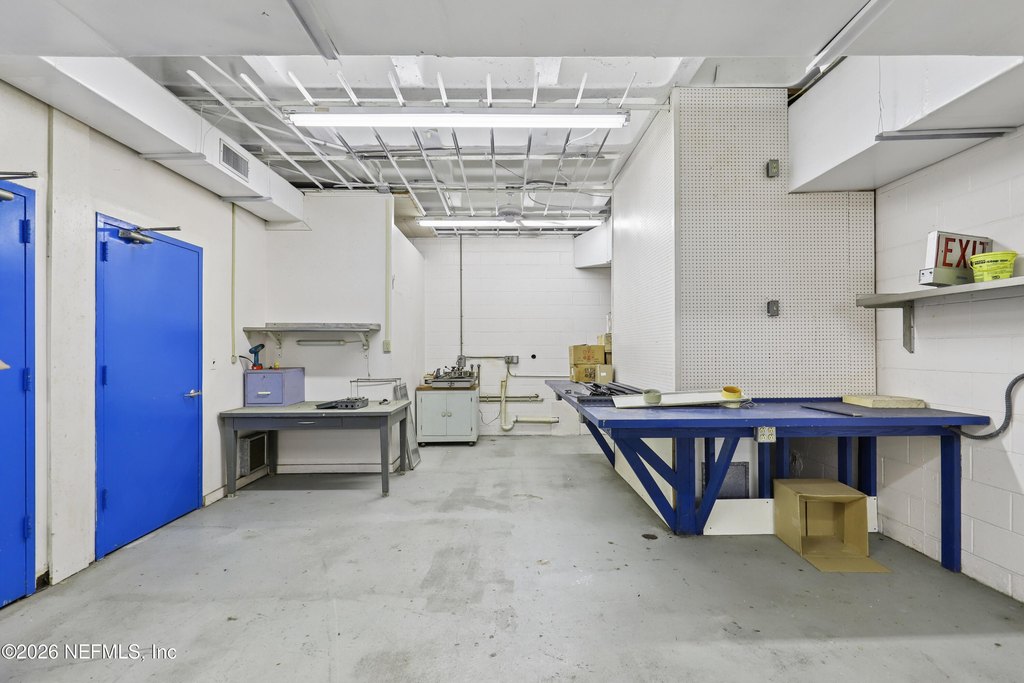
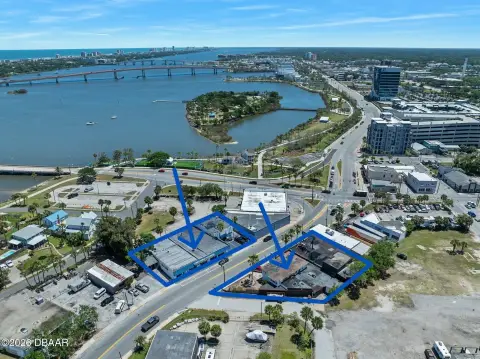
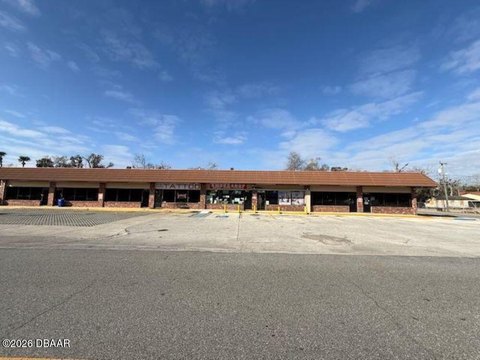
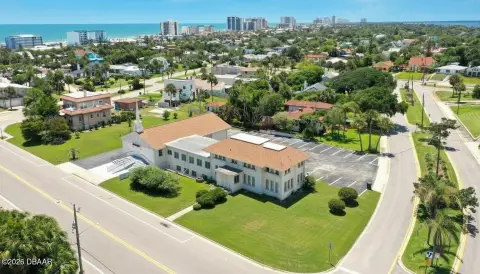
This mixed-use commercial property at 711 W. International Speedway Boulevard comprises approximately 17,676 square feet across two buildings, with a two-story configuration and a loading dock. Built in 1959, the asset offers substantial interior space that can accommodate office, retail, educational, medical, hospitality, or other commercial functions supported by the existing layout.
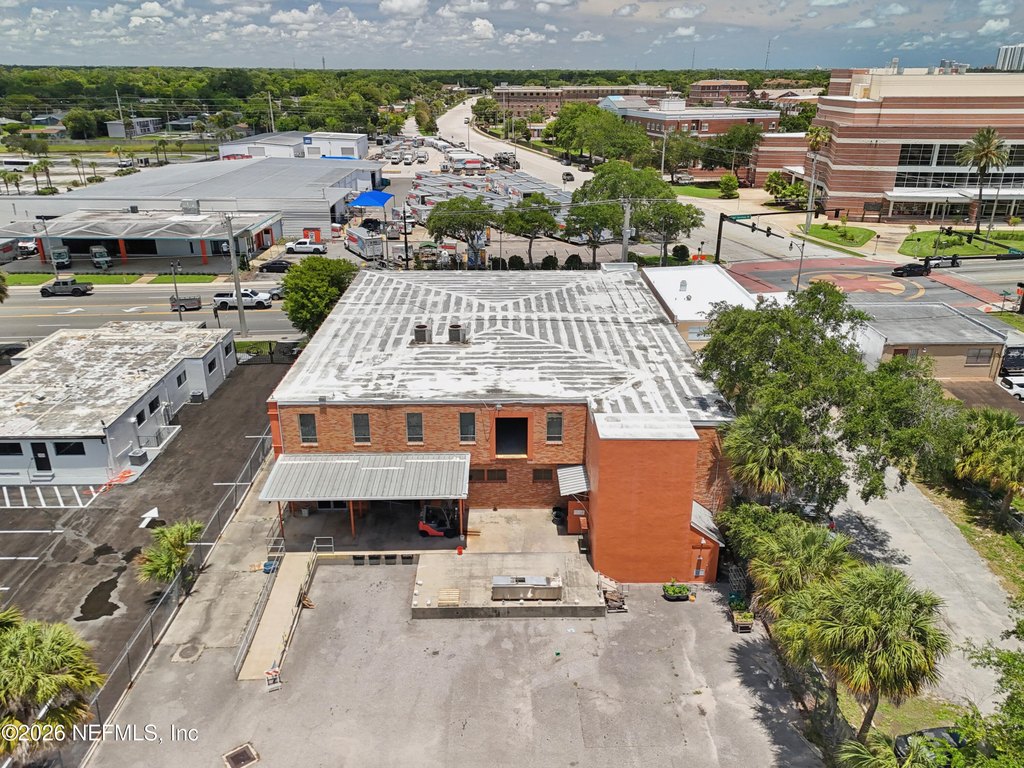
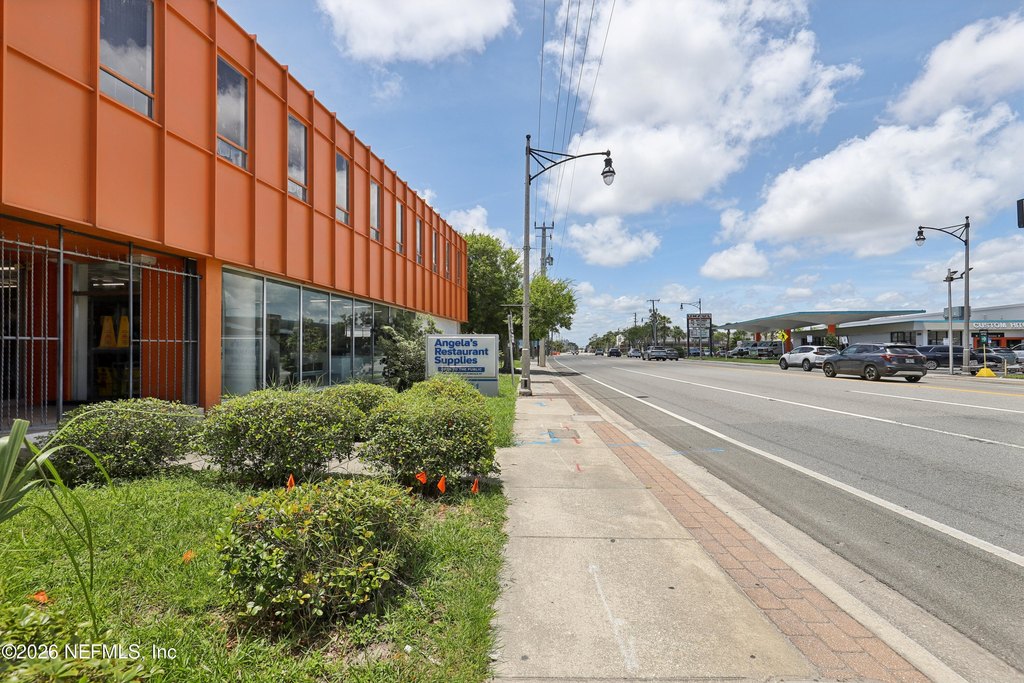
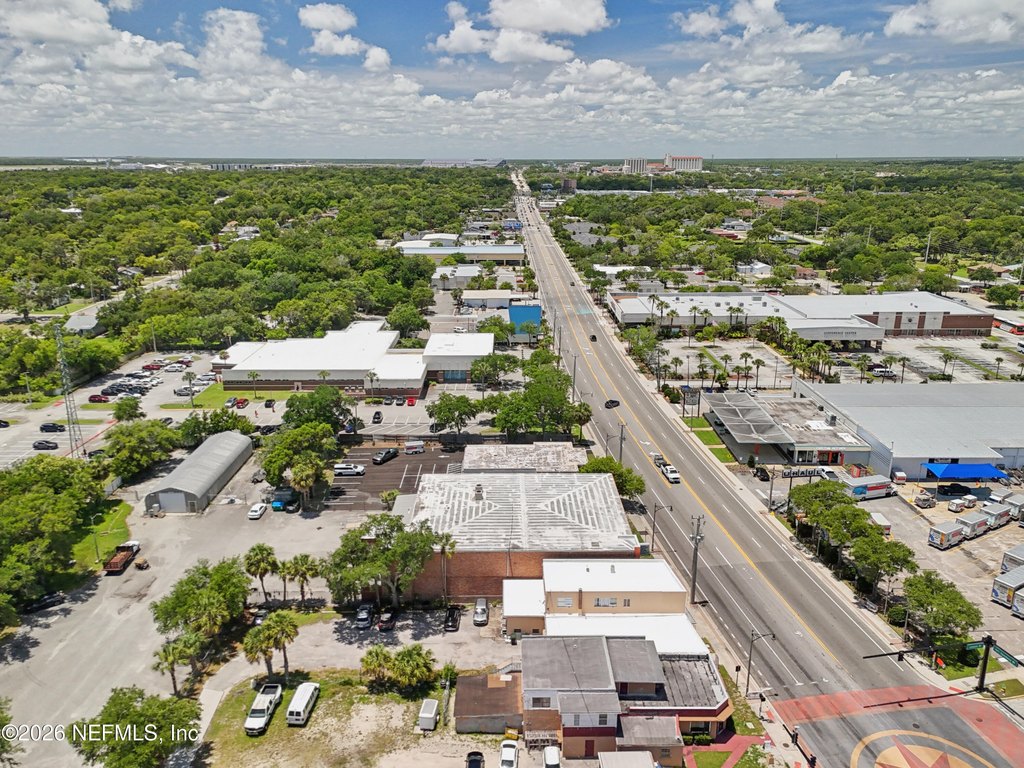
The property occupies a prominent position on International Speedway Boulevard in Daytona Beach, connecting local and visitor traffic with Interstate 95, downtown, Daytona Beach International Airport, and Daytona International Speedway. Its central setting places the site within a commercial environment that includes tourism, higher education, healthcare, and entertainment activity. Parking is available on the property, and the frontage provides a visible presence along one of the area's established commercial corridors.
The property occupies a prominent position on International Speedway Boulevard in Daytona Beach, connecting local and visitor traffic with Interstate 95, downtown, Daytona Beach International Airport, and Daytona International Speedway. Its central setting places the site within a commercial environment that includes tourism, higher education, healthcare, and entertainment activity. Parking is available on the property, and the frontage provides a visible presence along one of the area's established commercial corridors.
Key Highlights
- Approximately 17,676 square feet of commercial space
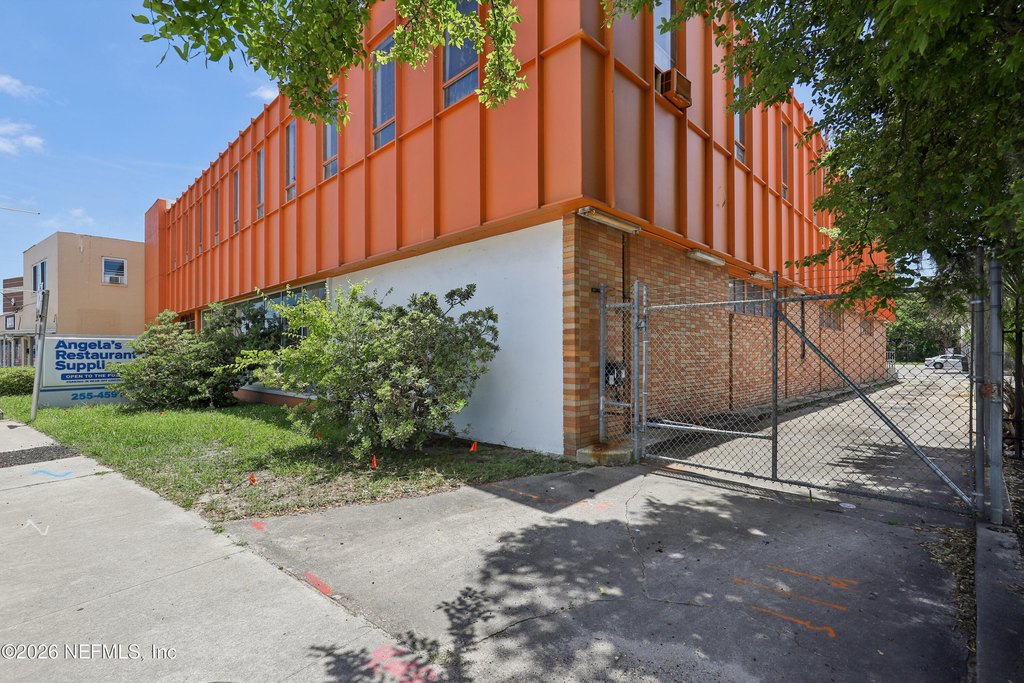
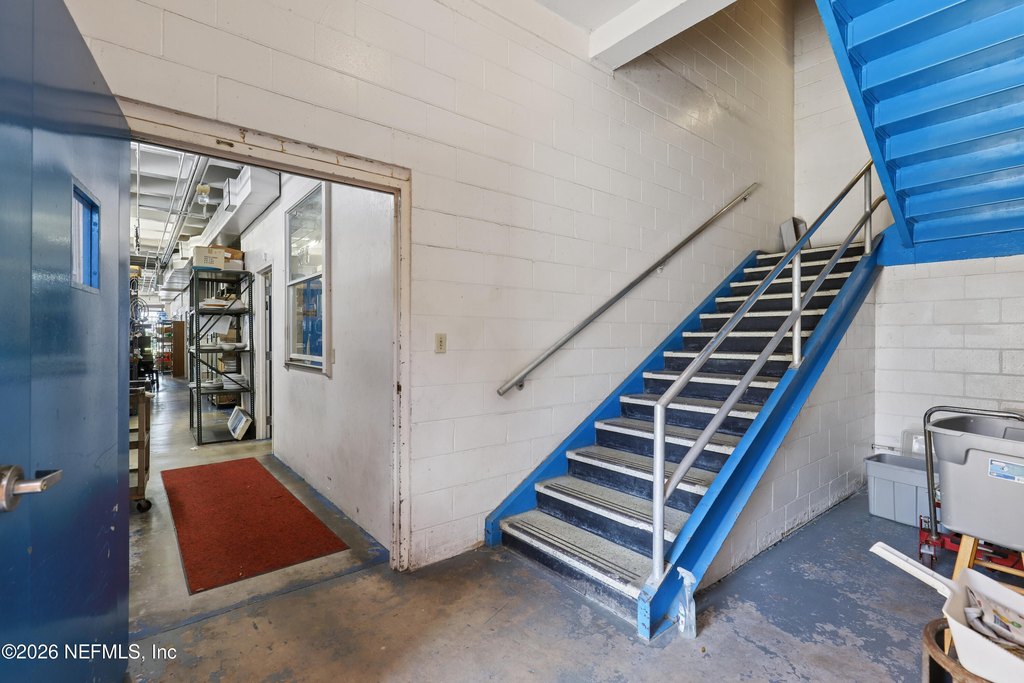
- Two‑story configuration with two buildings
- Loading dock included
Financial Insights
Estimated NOI and Cap Rate
NOI / Yr
$264,875
Cap Rate
8.71%
Suggested Prices Based on Cap Rates
Cap Rate 5%
$5,297,500
$5.3M
Cap Rate 7%
$3,783,929
$3.8M
Cap Rate 9%
$2,943,056
$2.9M
Market Conditions
NOI Build-Up for 17,676 SF
Gross rent
$381.8K $21.60/SF
− Vacancy
−$28.6K −$1.62/SF
EGI
$353.2K $19.98/SF
− OpEx
−$88.3K −$5.00/SF
NOI
$264.9K $14.99/SF
Area
Volusia County, FL
Vacancy
7.50%
Lease Rate
$21.60 /SF/Yr
Expense Ratio
25.00%
Simulate Cap Rate and NOI
Suggested Prices Based on Cap Rates
Cap Rate 5%
$5,297,500
Cap Rate 7%
$3,783,929
Cap Rate 9%
$2,943,056
Alternative Uses
Best Use
Office B
$3.78M
$3.31M – $4.41M
NOI $264,875 @ 7.0% cap · market cap 8.71%
Second Best
Mixed Use
$3.12M
$2.73M – $3.64M
NOI $218,343 @ 7.0% cap · market cap 7.18%
Theoretical Best
Office A
$5.21M
$4.56M – $6.08M
NOI $364,833 @ 7.0% cap · market cap 12.00%
Zoning and permitted uses should be independently verified with authorities.
How Realmo checks its estimates
Property Analytics
Unlock full access to Insights
Subscribe to Realmo Intelligence
Open Analytics
Current Use
Lease Details
Yes
Paved road access
Location Intelligence
Trade Area within ½ mile
1,249
Businesses Nearby
Explore this area
Business Placement
Demographics for 32114, FL
34,943
Population
17,118
Households
2
Avg Household Size
33
Median Age
19%
College-Educated
89%
High-School Grad
16.0 sq mi
ZIP Area
2,184
Density / Sq Mi
$39,906
Median Household Income
$31,220
Median Earnings
$1,171
Median Rent
$174,900
Median Home Value
Check the figures for this property
Cap Rate, Value Estimation, Potential NOI and more
View Realmo Analytics
Market
Vacancy Rate% for Office in South region





Frequently Asked Questions
What type of property is this?
Mixed-use property - Flexible commercial space includes a loading dock and prominent frontage along International Speedway Boulevard.
Where is this mixed-use property located?
The property is located at 711 W INTL SPEEDWAY Boulevard W Daytona Beach, FL.
What is the asking price?
The asking price for this property is $3,040,000.
What are key features of this property?
This property features: Approximately 17,676 square feet of commercial space; Two‑story configuration with two buildings; Loading dock included


