Historic Office Building by Sunrise
For Sale
$1,850,000
1112 Riverside Dr, Daytona Beach, FL 32117
Updated historic office building with river views and flexible layout.
Property Size7,044 SF
Price / SF$262.63
Days on Market212
Property Features for 1112 Riverside Dr
General Information
Standard status
Active
Size
7,044 SF
Building Details
Year Built
1933
Listing Agency:
COLDWELL BANKER COAST REALTY
Listed By:
Tom Grasberger · License #3323835
(386) 843-4346
Source:
Chenoregroup
Added: Mar 11
Changed: Sep 12
Last Checked: Oct 7 at 3:04PM
Displayed information is deemed reliable but is not guaranteed and should be independently verified. All listing content including descriptions, pricing, images are the copyrighted material of COLDWELL BANKER COAST REALTY
Investment Insights
Based on property information with market context.
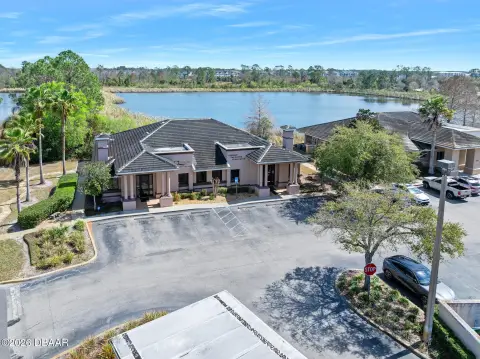
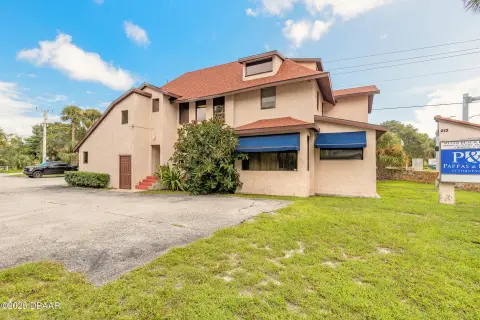
The Summit Professional Center is a beautifully updated, historic-designated building that blends classic charm with modern functionality. Located directly across from Sunrise Park, a scenic riverfront space with a public dock and additional parking, the property offers both convenience and a peaceful natural setting. Designed with feng shui principles to promote balance, harmony, and success, this exceptional property is truly one of a kind. The building showcases stunning craftsmanship, with preserved oak flooring, elegant craftsman-style arches, rich wainscoting, and a striking herringbone tile design throughout the hallways. Every element has been professionally designed to enhance the flow of energy and create a welcoming, tranquil environment. The building is in impeccable condition, with all major systems meticulously updated, including plumbing, electrical, roof, windows, and added insulation. Constructed with durable double block materials and featuring an underground water retention system, the property sits high and dry, ensuring lasting protection and peace of mind. Mature trees surround the property, enhancing its beauty and providing natural shade, while abundant on-site parking and additional public parking across the street at Sunrise Park make access easy and convenient. River and park views further elevate the serene, inspiring atmosphere of this unique professional center. The first floor currently operates as a legal office, offering a flexible layout with multiple large and small office spaces, conference rooms, file rooms, and multiple entry and exit points. The second floor is fully leased with five professional units, each thoughtfully designed to maintain the building's historic character. Additionally, there is an owner's suite featuring a full kitchen, bathroom, living area, and gorgeous river views providing a perfect private retreat or additional rental income. The building offers a total of nine bathrooms, including two full baths with showers, three kitchens or kitchenettes, and two laundry areas, accommodating a wide range of professional uses. With the potential to create up to 15 rental units, The Summit Professional Center offers exceptional flexibility for both owner-occupants and investors. Whether you envision running your own business while earning passive income or seeking a fully operational, low-maintenance investment property, The Summit delivers unmatched potential. Its combination of historic charm, updated infrastructure, beautiful surroundings, and thoughtful design make it a true gem in today's commercial real estate market.
Key Highlights
- Historic‑designated building with updated infrastructure and meticulous maintenance.
- High and dry location with durable double block construction and underground water retention system.
- Flexible layout with potential for up to 15 rental units.
Financial Insights
Estimated NOI and Cap Rate
NOI / Yr
$105,554
Cap Rate
5.71%
Suggested Prices Based on Cap Rates
Cap Rate 5%
$2,111,080
$2.1M
Cap Rate 7%
$1,507,914
$1.5M
Cap Rate 9%
$1,172,822
$1.2M
Market Conditions
NOI Build-Up for 7,044 SF
Gross rent
$152.2K $21.60/SF
− Vacancy
−$11.4K −$1.62/SF
EGI
$140.7K $19.98/SF
− OpEx
−$35.2K −$5.00/SF
NOI
$105.6K $14.99/SF
Area
Volusia County, FL
Vacancy
7.50%
Lease Rate
$21.60 /SF/Yr
Expense Ratio
25.00%
Simulate Cap Rate and NOI
Suggested Prices Based on Cap Rates
Cap Rate 5%
$2,111,080
Cap Rate 7%
$1,507,914
Cap Rate 9%
$1,172,822
Alternative Uses
Best Use
Office B
$1.51M
$1.32M – $1.76M
NOI $105,554 @ 7.0% cap · market cap 5.71%
Second Best
—
—
no second resolved use
Theoretical Best
Office A
$2.08M
$1.82M – $2.42M
NOI $145,388 @ 7.0% cap · market cap 7.86%
Zoning and permitted uses should be independently verified with authorities.
Property Analytics
Unlock full access to Insights
Subscribe to Realmo Intelligence
Open Analytics
Current Use
Location Intelligence
Trade Area within ½ mile
586
Businesses Nearby
Explore this area
Business Placement
Demographics for 32117, FL
28,223
Population
14,392
Households
2
Avg Household Size
43
Median Age
21%
College-Educated
90%
High-School Grad
12.0 sq mi
ZIP Area
2,352
Density / Sq Mi
$52,132
Median Household Income
$32,189
Median Earnings
$1,392
Median Rent
$175,500
Median Home Value
Check the figures for this property
Cap Rate, Value Estimation, Potential NOI and more
View Realmo Analytics
Market
Vacancy Rate% for Office in South region

Questions? Ask Rey
Realmo’s AI knows this listing — price, zoning, demand, history. Ask anything.



Frequently Asked Questions
What type of property is this?
Office building - Updated historic office building with river views and flexible layout.
Where is this office building located?
The property is located at 1112 Riverside Dr Daytona Beach, FL.
What is the asking price?
The asking price for this property is $1,850,000.
What are key features of this property?
This property features: Historic‑designated building with updated infrastructure and meticulous maintenance.; High and dry location with durable double block construction and underground water retention system.; Flexible layout with potential for up to 15 rental units.