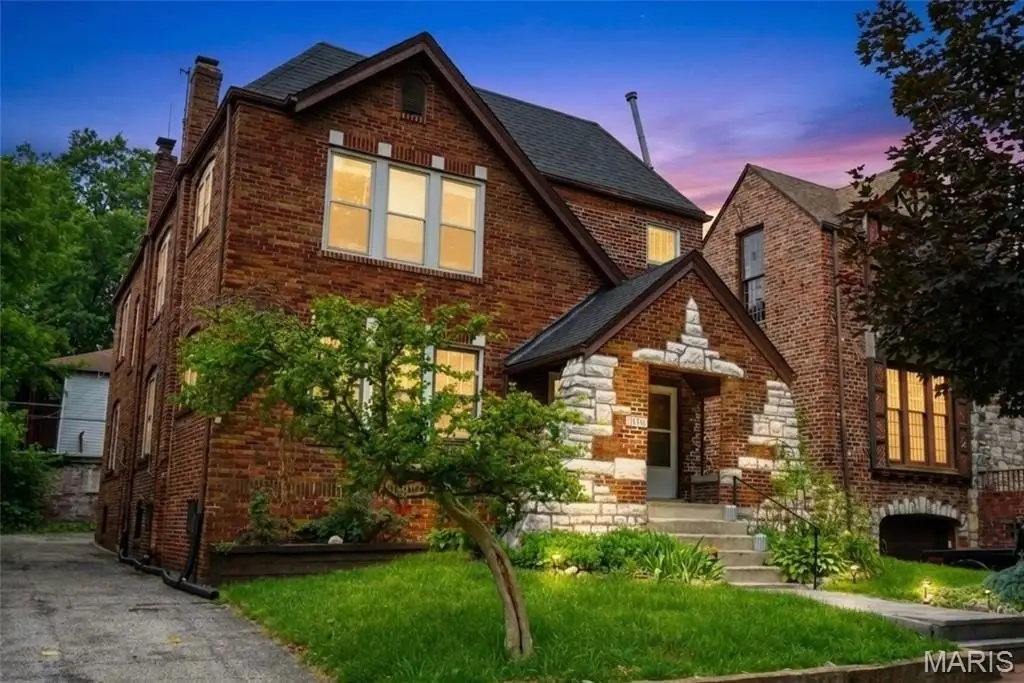
Tudor Duplex with
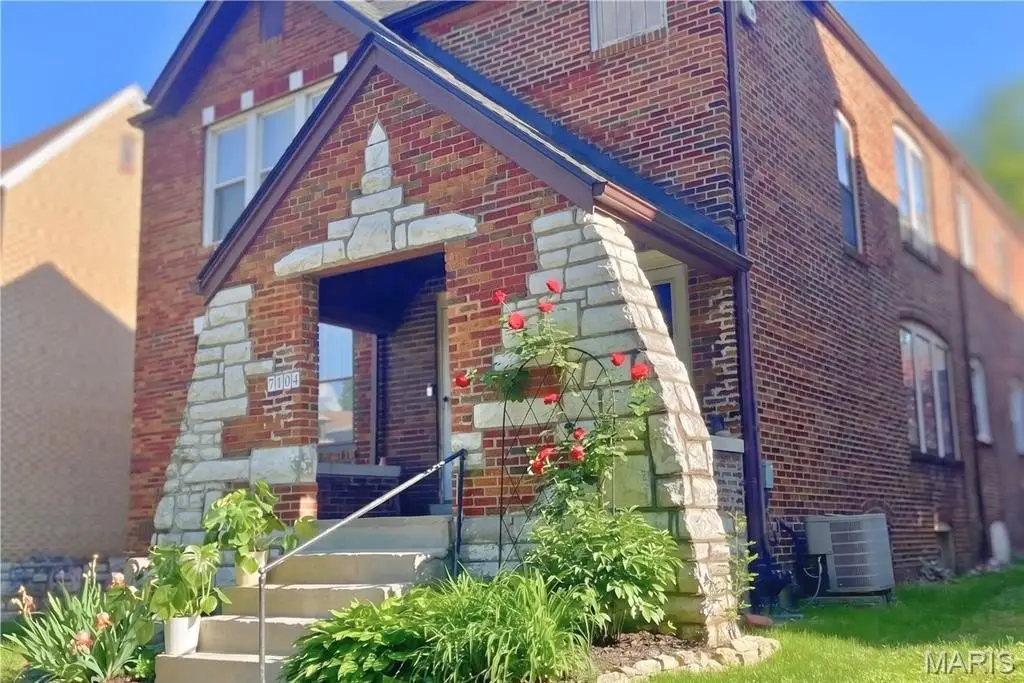
For Sale
$399,000
Pending
7104 Tulane Avenue, University City, MO 63130
Residential Income, University City, MO
Property Size2,784 SF
Lot Size0.09 Acres
Days on Market48
Property Features for 7104 Tulane Avenue
General Information
Property type
Residential Multi Family
Property subtype
Other
Bedrooms
4
Bathrooms
2
Full bathrooms
2
Rooms
Bathroom 2, Bedroom 4, Bedroom 2, Bedroom 3, Bathroom 1, Bedroom 1, Basement
Parking
4
Parking features
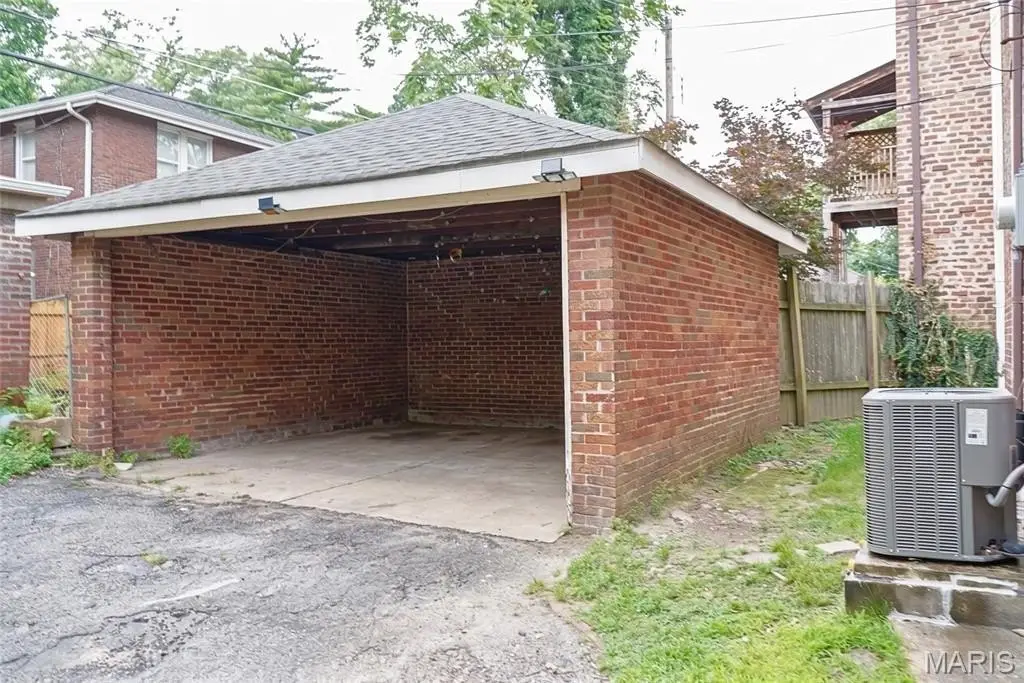
Carport, Garage
Patio and Porch features
Porch
Interior features
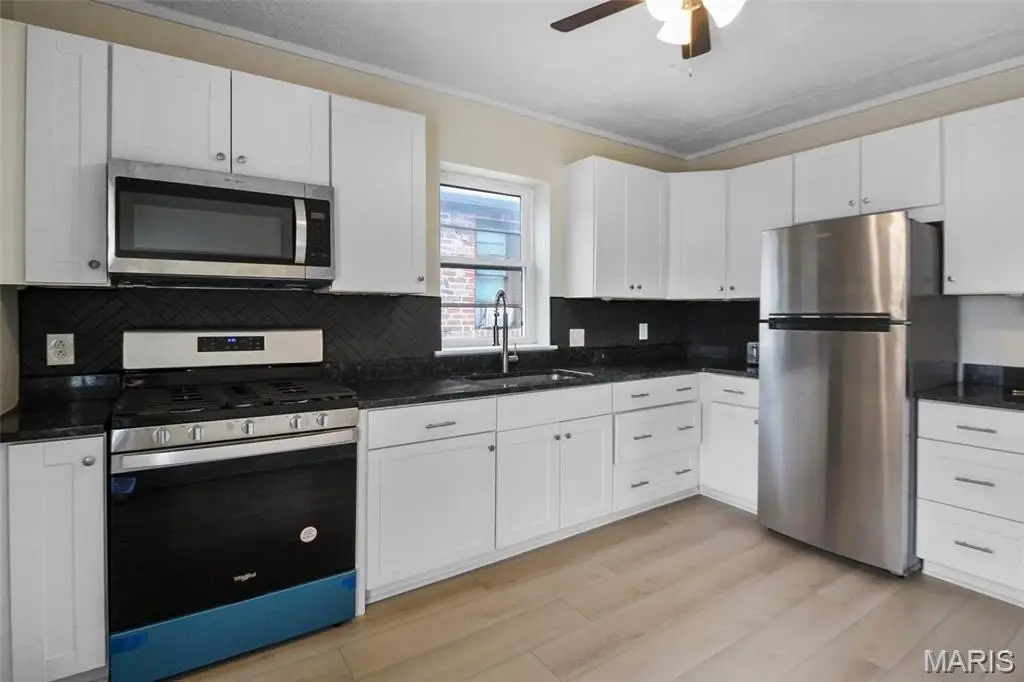
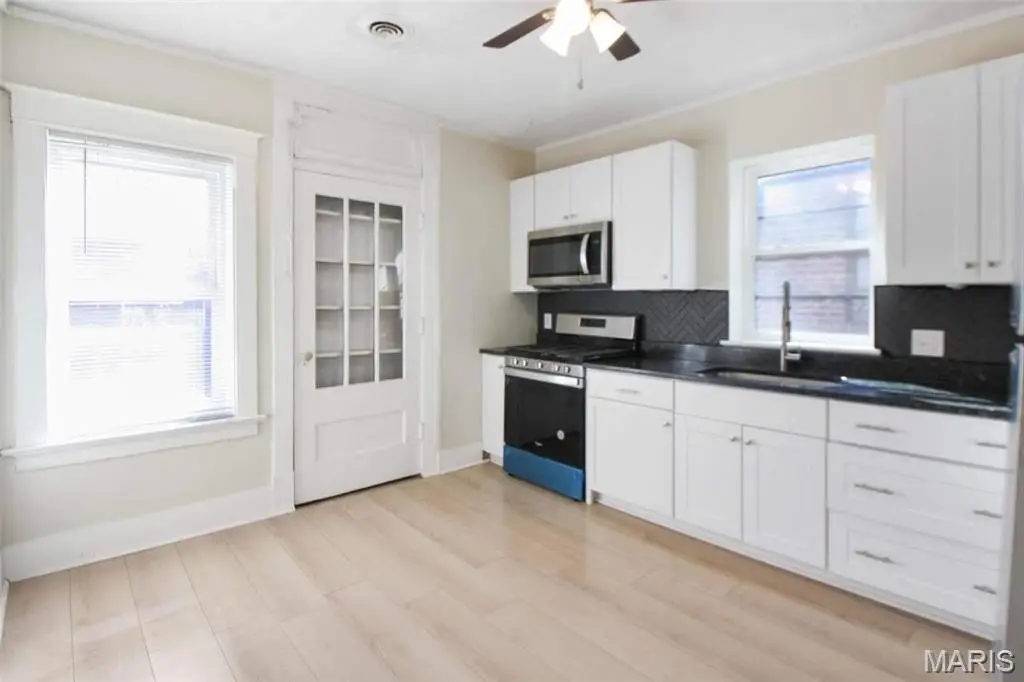
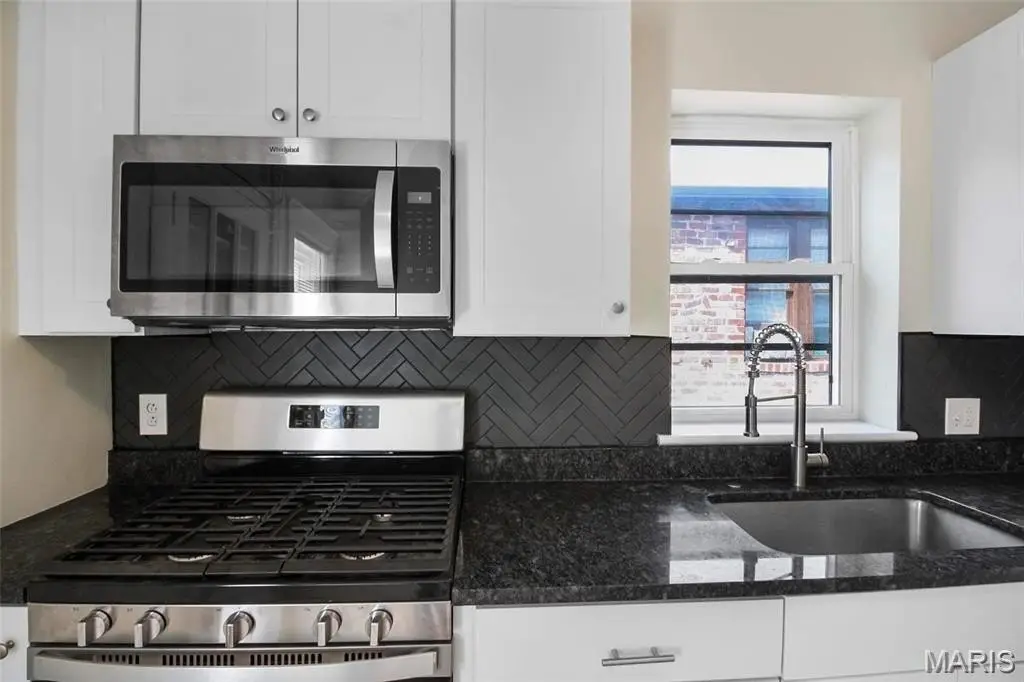
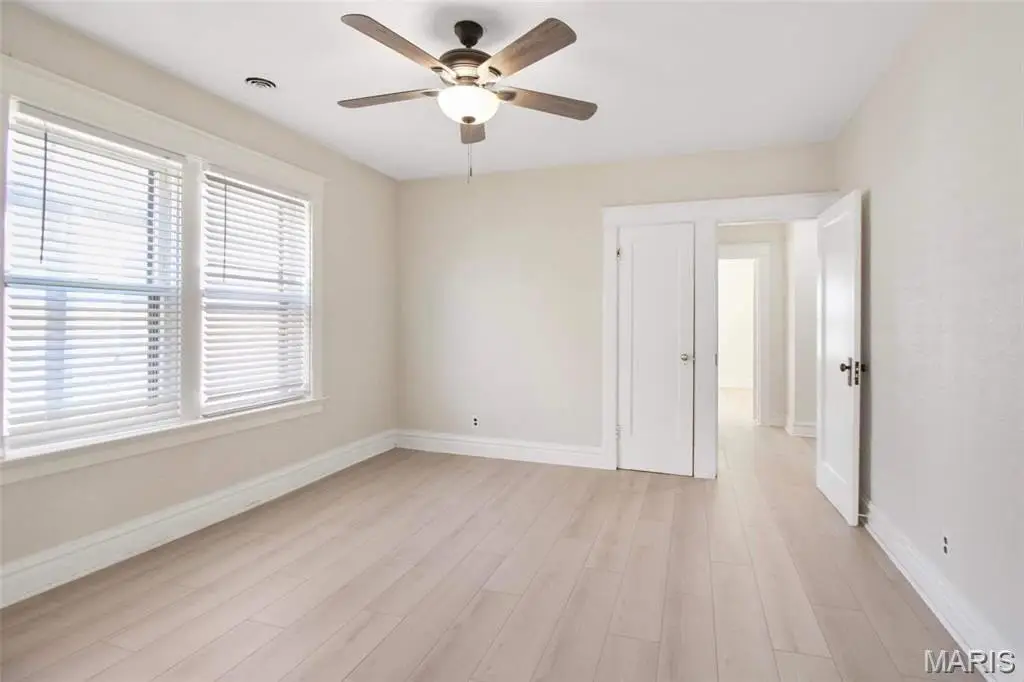
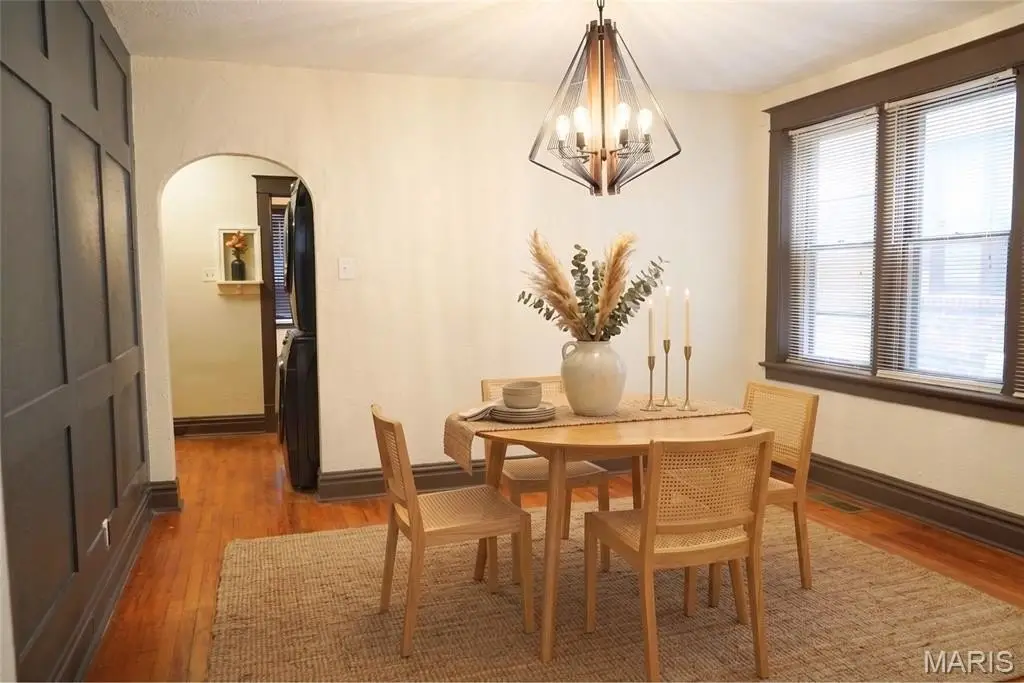
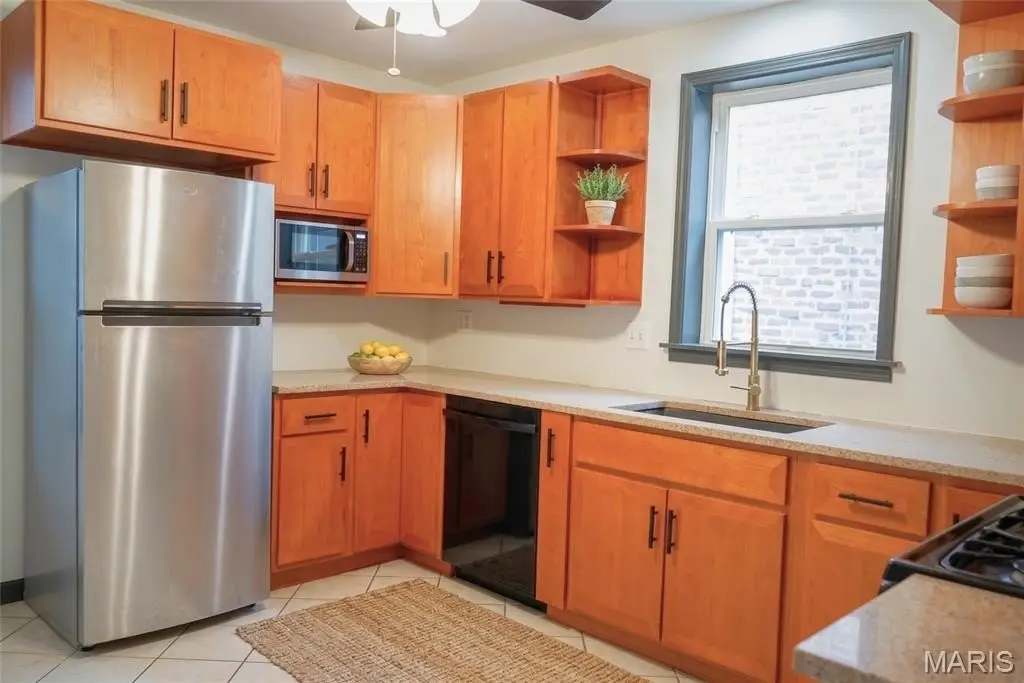
Ceiling Fan(s), Chandelier, Custom Cabinetry, Granite Counters, Shower, Solid Surface Countertop(s), Special Millwork, Stone Counters, Storage
Basement
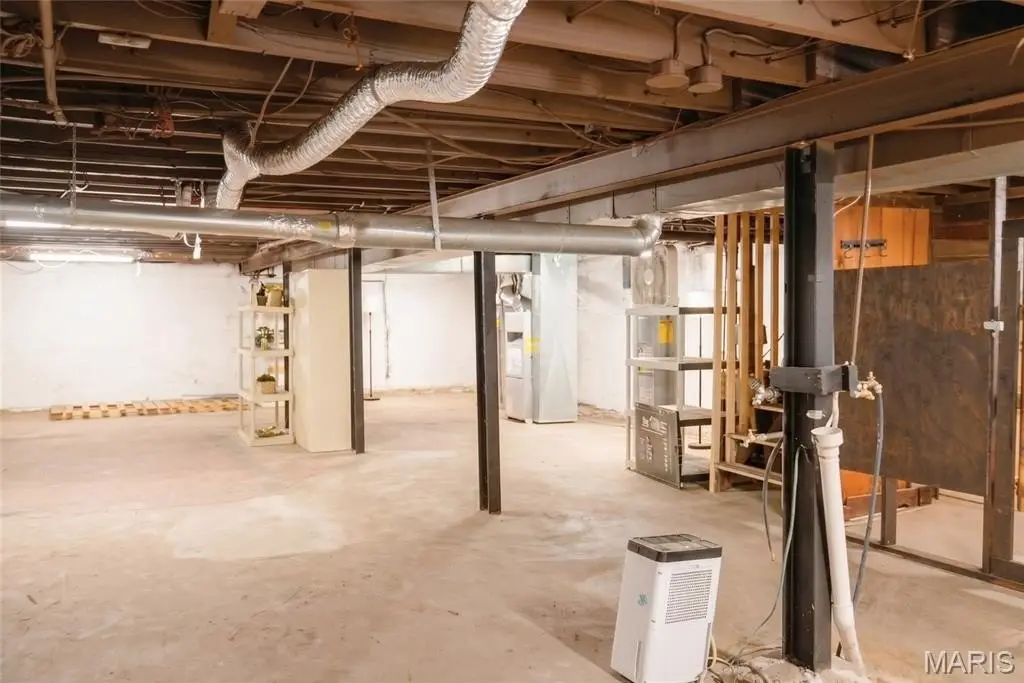
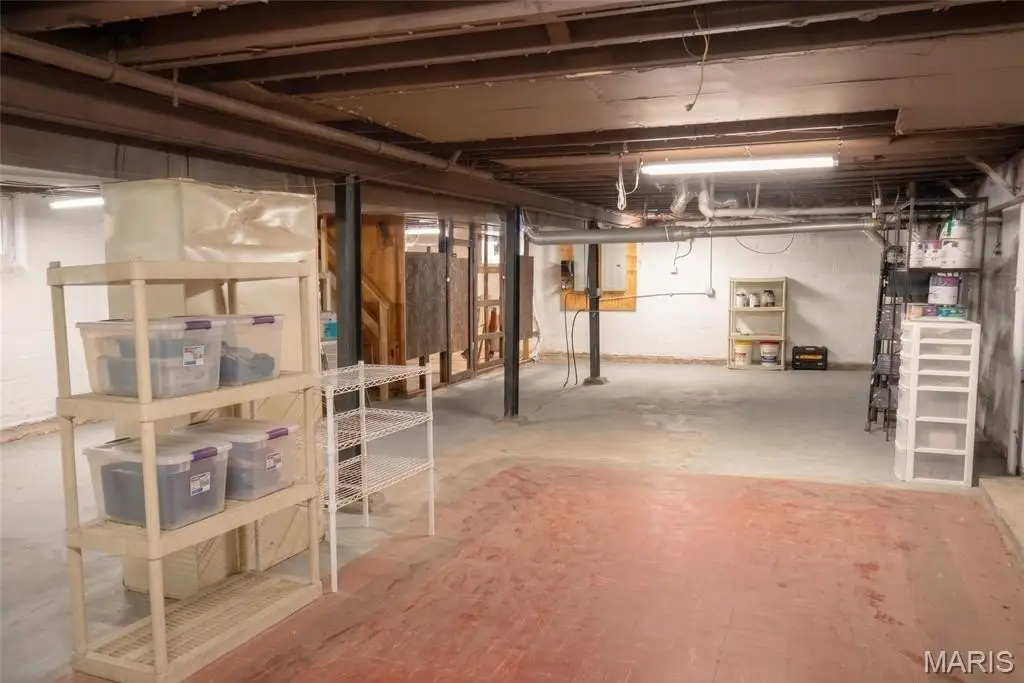
Walk-Out Access, Block, Exterior Entry
Appliances
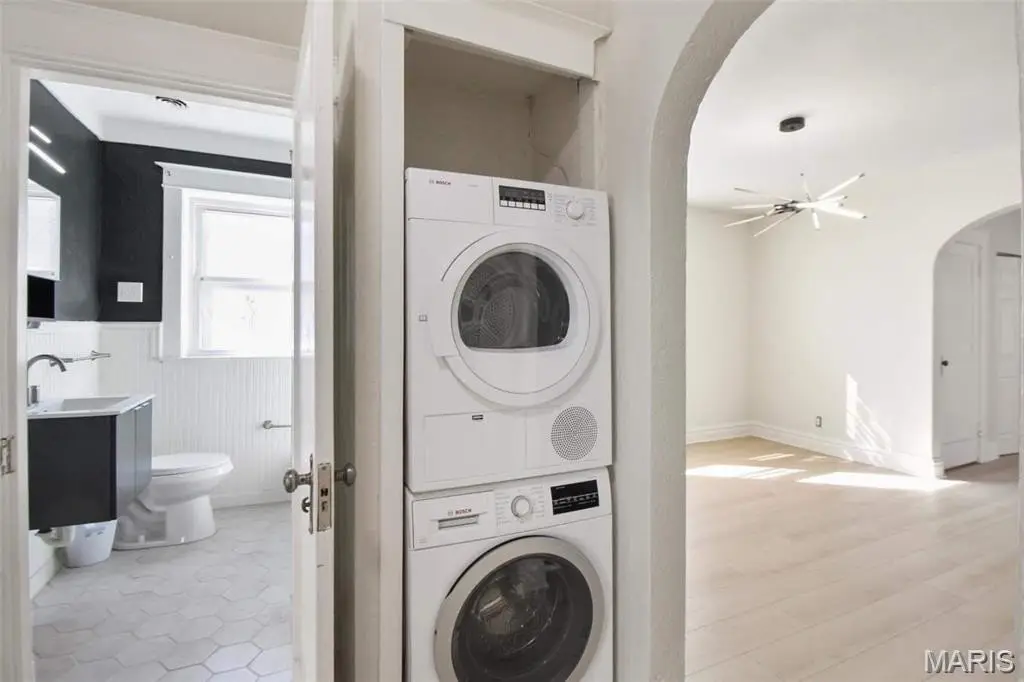
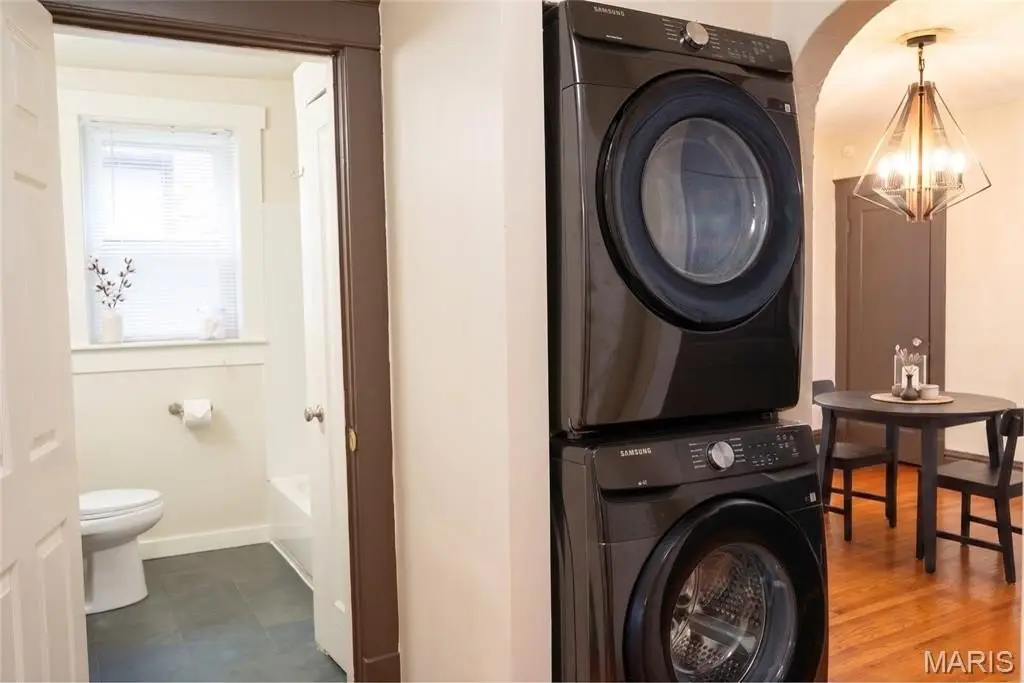
Stainless Steel Appliance(s), Dishwasher, Disposal, ENERGY STAR Qualified Dryer, Microwave, Range, Range Hood, Free-Standing Gas Range, ENERGY STAR Qualified Refrigerator, Free-Standing Refrigerator, ENERGY STAR Qualified Washer, Washer/Dryer, Washer/Dryer Stacked, Gas Water Heater
Subdivision
University Park
Lot features
Front Yard, Near Park, Some Trees
Elementary school
Barbara Jordan Elem.
Middle school
Brittany Woods
High school
University City Sr. High
Elementary school district
University City
Middle school district
University City
High school district
University City
Directions
GPS friendly. Delmar blvd, north on Midland, East on Tulane ave, located on south side of Tulane.
Standard status
Pending
APN
18J-54-1844
Size
2,784 SF
Lot size
0.09 Acres
Taxes and HOA fees
Tax Year
2025
Tax Annual Amount
4442
HOA Fee
$210 Annually
Utilities
Heating system
Forced Air, Natural Gas
Cooling system
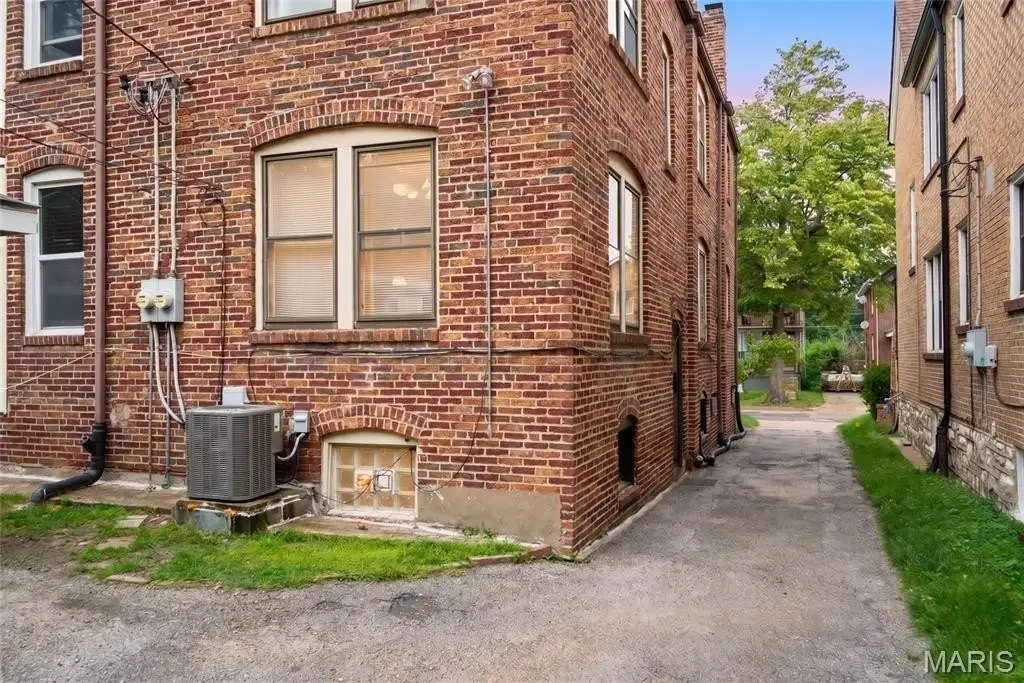
Central Air
Amenities
in-unit laundry
basement storage
Building Details
Year built
1929
Flooring type
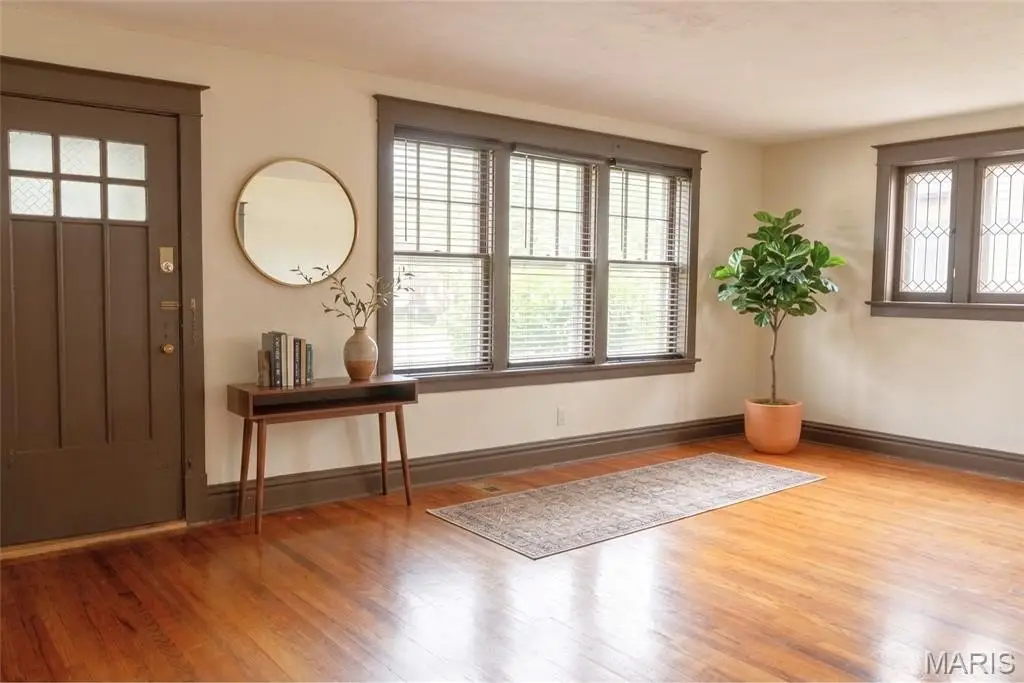
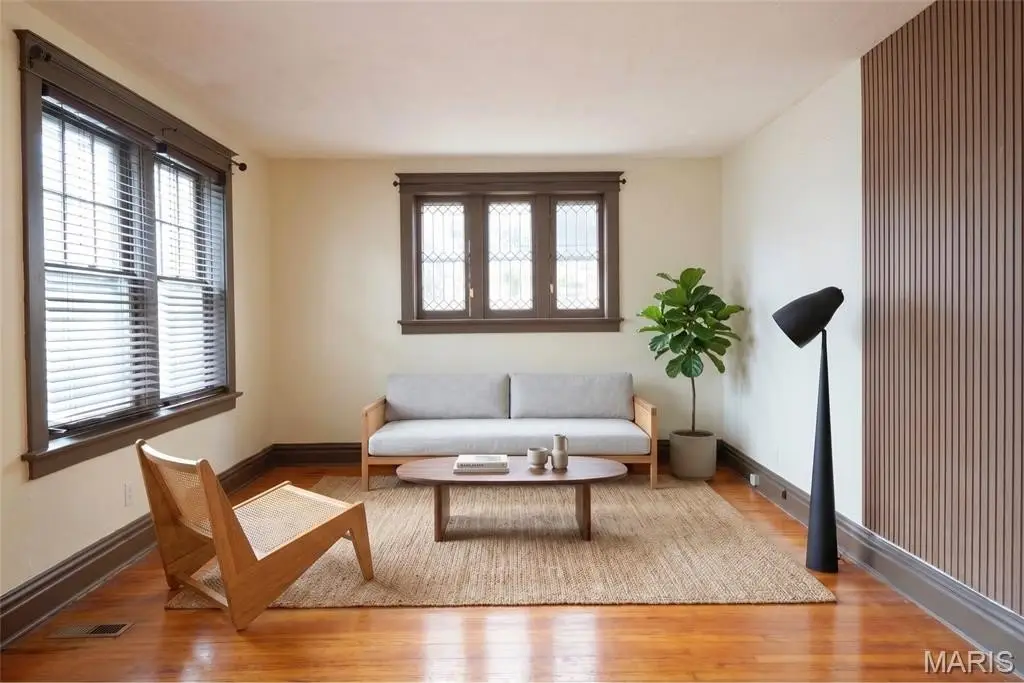
Vinyl, Wood, Hardwood, Stone, Bamboo, Combination, Laminate
Building materials
Brick
Roof type
Shingle
Architectural style
Tudor
Additional Structures
Storage
Listing Agency:
EXP Realty, LLC
(866) 224-1761
Listed By:
Aden McCurdy · License #2021042922
(314) 704-6550
Added: Aug 26
Changed: Sep 28
Last Checked: Oct 12 at 10:06AM
MLS# 26039495
Copyright © 2026 Mid America Regional Information Systems, Inc. All rights reserved. All information provided by the listing agent/broker is deemed reliable but is not guaranteed and should be independently verified.
Investment Insights
Based on property information with market context.
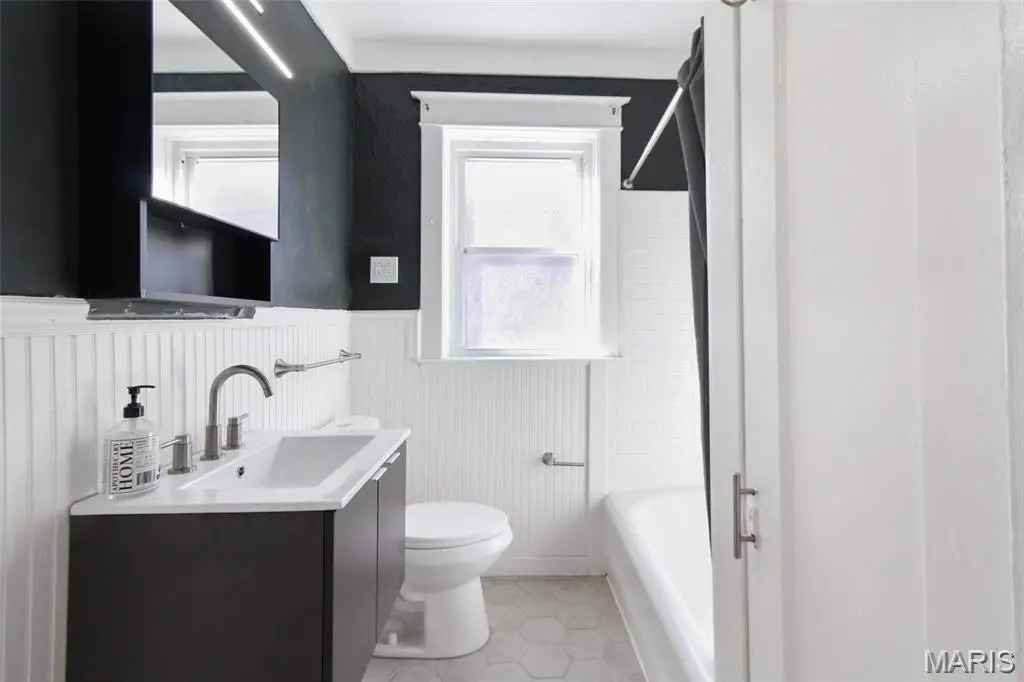
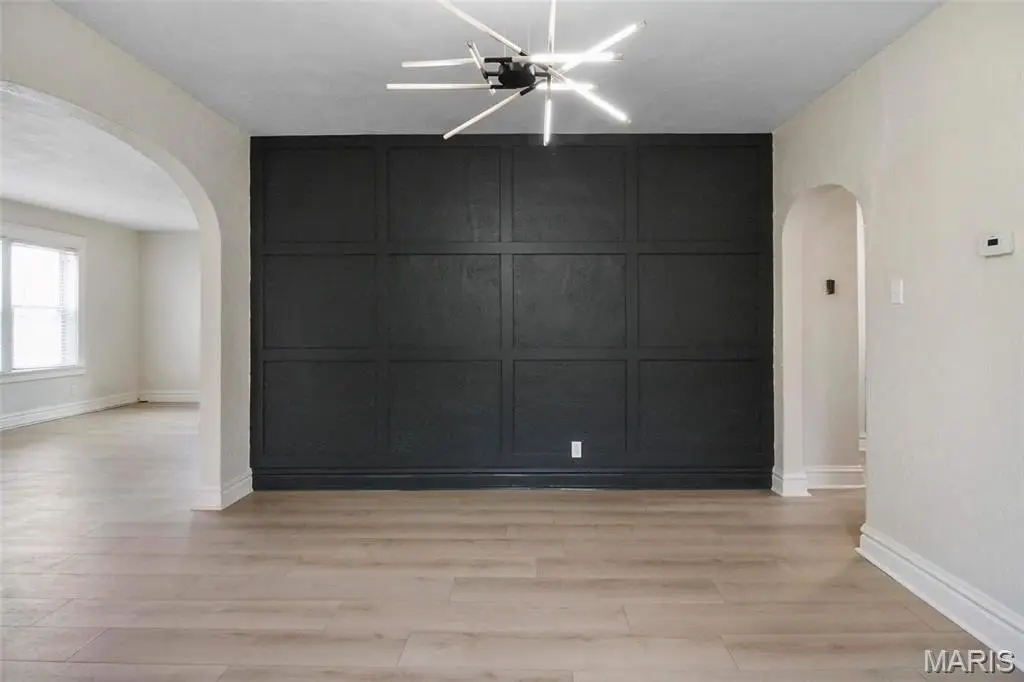
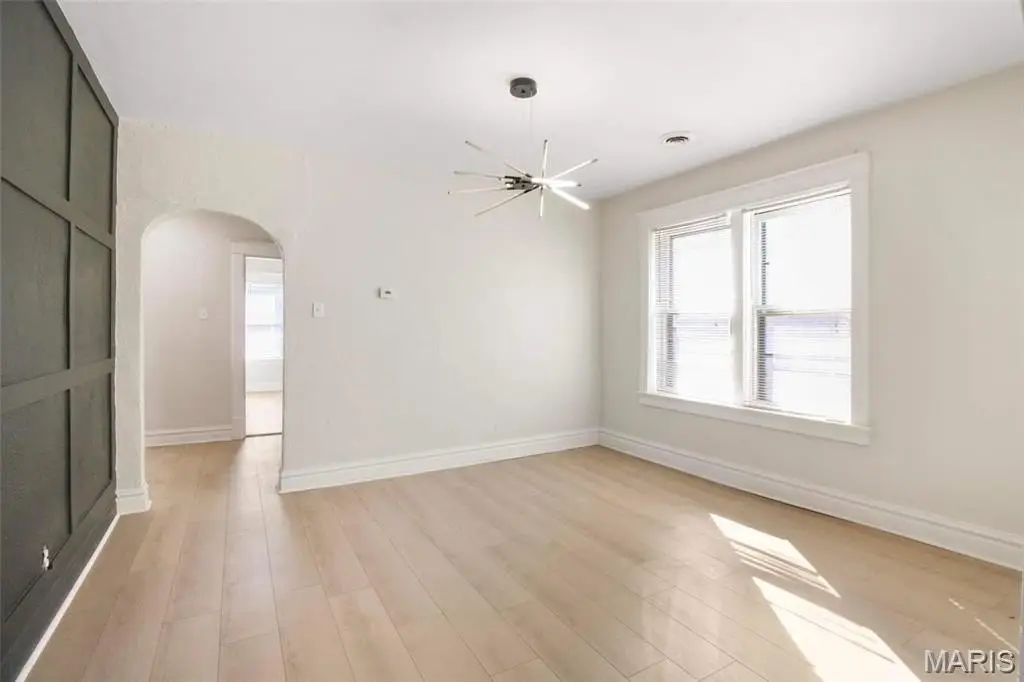
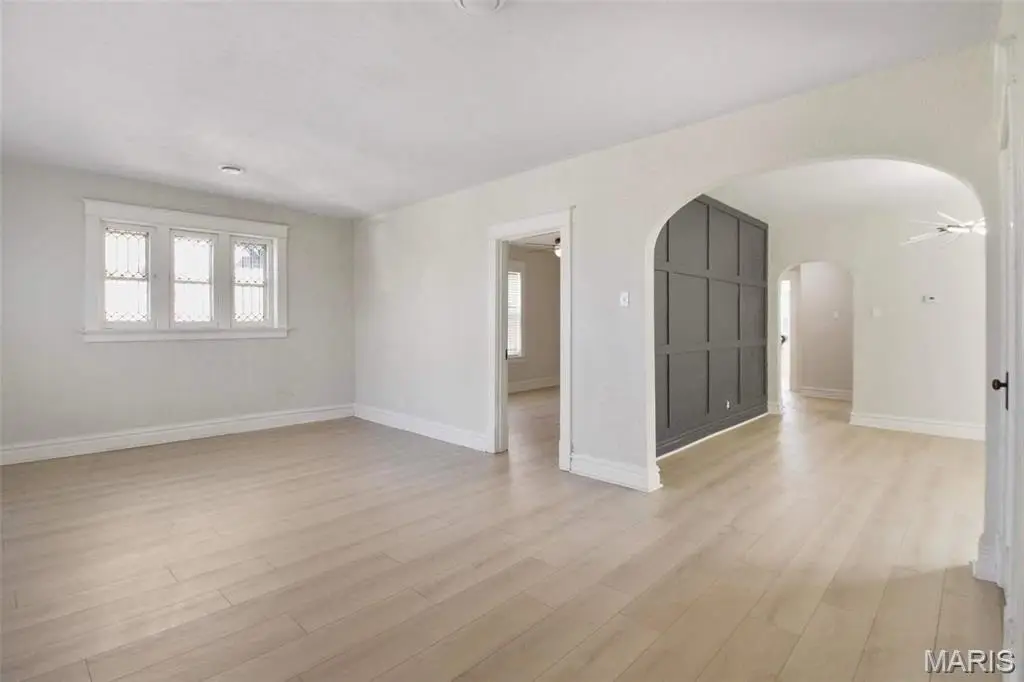
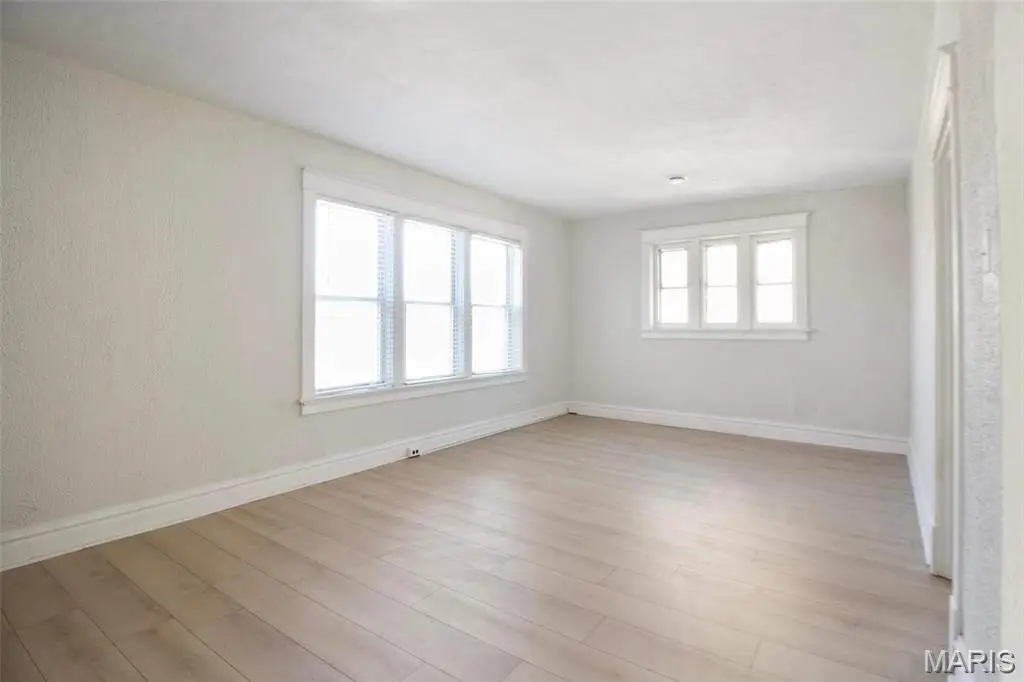
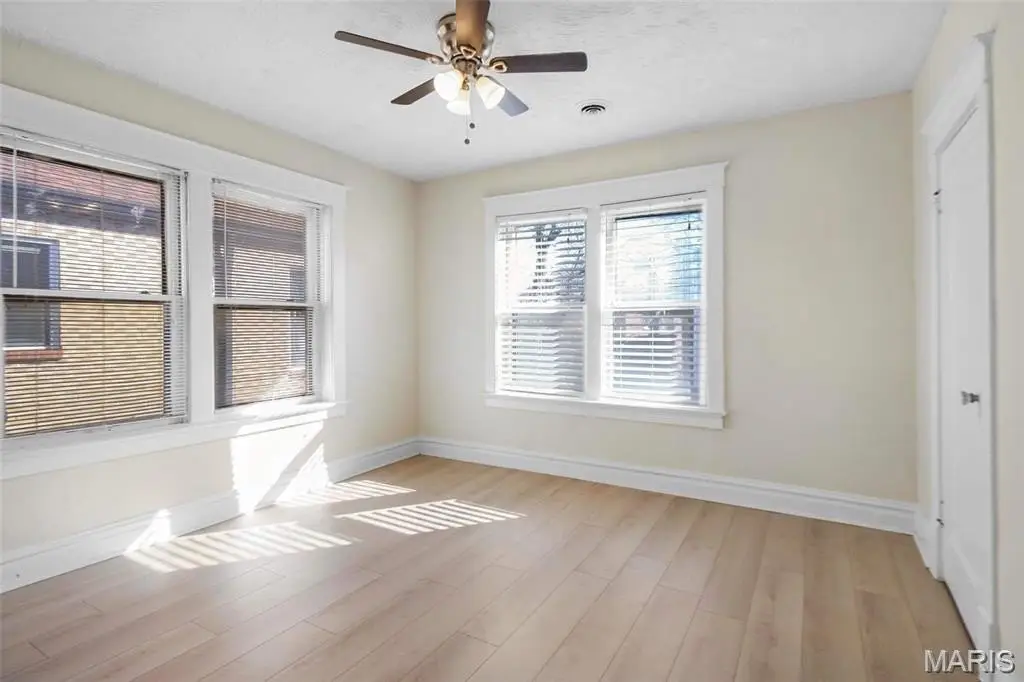
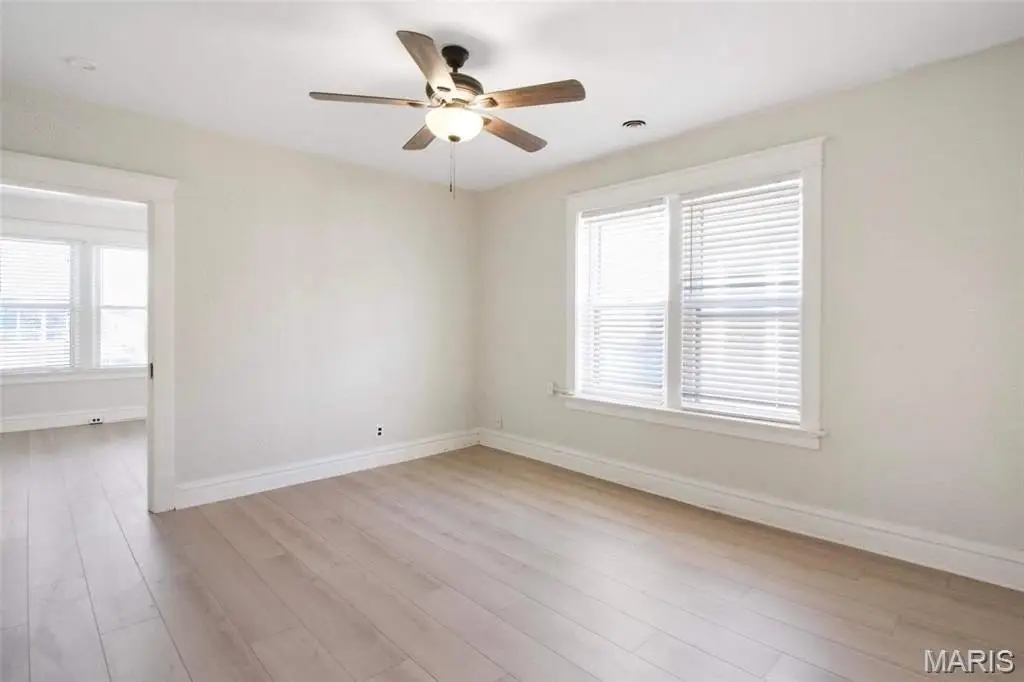
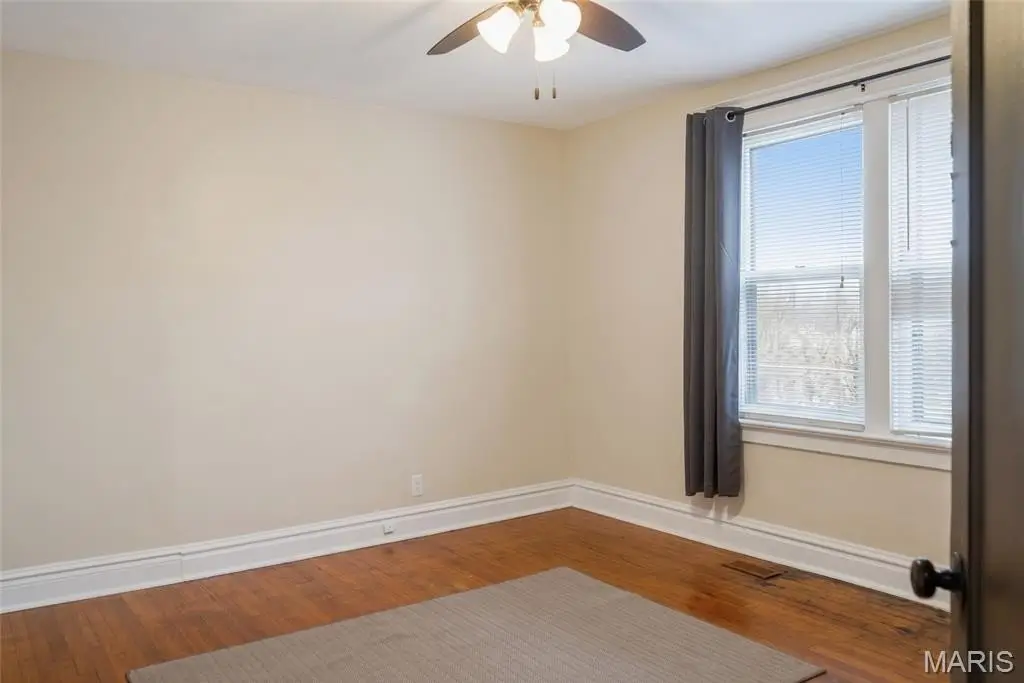
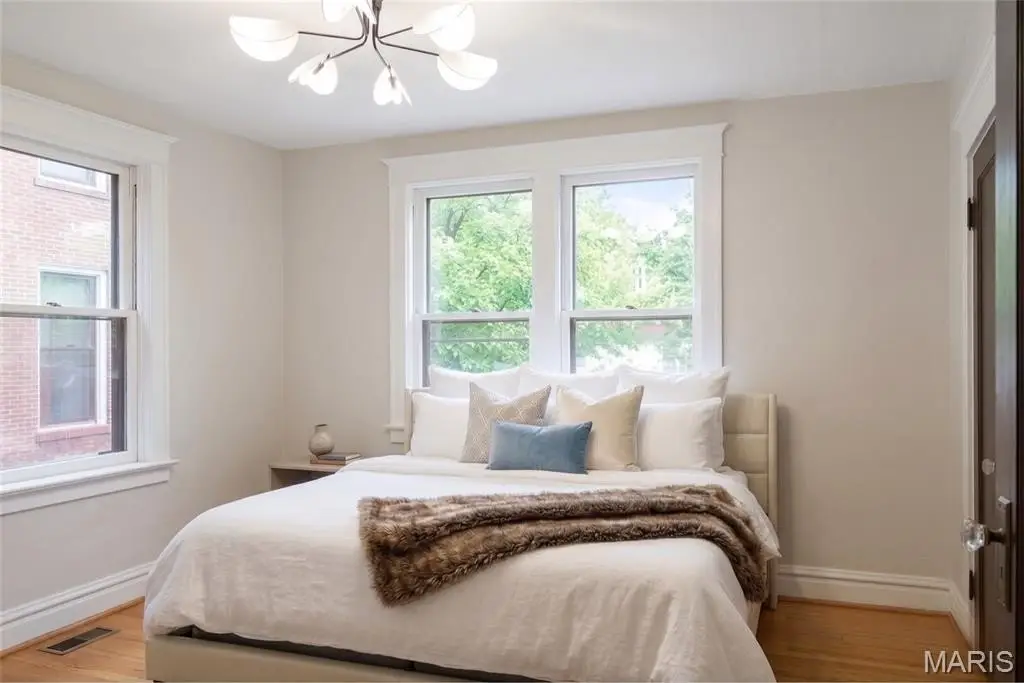
Built in 1929, this full-brick Tudor duplex contains 2,784 square feet arranged as two two-bedroom, one-bath residences. The first-floor unit is vacant and includes hardwood flooring, leaded-glass windows, a renovated bathroom, custom wood cabinetry, and a new Samsung washer and dryer. The second-floor residence has updated flooring, contemporary cabinetry, stone counters, and a new combination washer and dryer; its lease runs through June 2027. Appliances remain with both units.
The property includes central air, forced-air natural-gas heating, upgraded electrical panels, and a shingle roof installed in June 2026. A basement provides separate enclosed storage rooms for the residences. Outside, a private driveway connects to a detached brick double garage or carport. Located at 7104 Tulane Avenue in University City, the property is within walking distance of the Delmar Loop and minutes from Washington University, downtown Clayton, and Forest Park.
The property includes central air, forced-air natural-gas heating, upgraded electrical panels, and a shingle roof installed in June 2026. A basement provides separate enclosed storage rooms for the residences. Outside, a private driveway connects to a detached brick double garage or carport. Located at 7104 Tulane Avenue in University City, the property is within walking distance of the Delmar Loop and minutes from Washington University, downtown Clayton, and Forest Park.
Key Highlights
- 2,784‑square‑foot duplex on a 0.0918‑acre lot
- Two 2bd/1ba units; first floor vacant and second floor leased through June 2027
- Full‑brick Tudor construction dating to 1929
Financial Insights
Estimated NOI and Cap Rate
NOI / Yr
$29,771
Cap Rate
7.46%
Suggested Prices Based on Cap Rates
Cap Rate 5%
$595,420
$595.4K
Cap Rate 7%
$425,300
$425.3K
Cap Rate 9%
$330,789
$330.8K
Market Conditions
NOI Build-Up for 2,784 SF
Gross rent
$45.1K $16.20/SF
− Vacancy
−$2.6K −$0.92/SF
EGI
$42.5K $15.28/SF
− OpEx
−$12.8K −$4.58/SF
NOI
$29.8K $10.69/SF
Area
St. Louis County, MO
Vacancy
5.70%
Lease Rate
$16.20 /SF/Yr
Expense Ratio
30.00%
Simulate Cap Rate and NOI
Suggested Prices Based on Cap Rates
Cap Rate 5%
$595,420
Cap Rate 7%
$425,300
Cap Rate 9%
$330,789
Alternative Uses
Best Use
Multifamily LT 5
$425.3K
$372.1K – $496.2K
NOI $29,771 @ 7.0% cap · market cap 7.46%
Second Best
Apartment 5plus
$370.1K
$323.9K – $431.8K
NOI $25,908 @ 7.0% cap · market cap 6.49%
Theoretical Best
Office A
$597.5K
$522.8K – $697.1K
NOI $41,825 @ 7.0% cap · market cap 10.48%
Zoning and permitted uses should be independently verified with authorities.
Property Analytics
Unlock full access to Insights
Subscribe to Realmo Intelligence
Open Analytics
Current Use
Lease Details
2
Residential units
Location Intelligence
Trade Area within ½ mile
584
Businesses Nearby
Explore this area
Business Placement
Demographics for 63130, MO
29,454
Population
14,106
Households
2.1
Avg Household Size
35
Median Age
64%
College-Educated
97%
High-School Grad
5.0 sq mi
ZIP Area
5,891
Density / Sq Mi
$81,103
Median Household Income
$50,407
Median Earnings
$1,199
Median Rent
$285,500
Median Home Value
Check the figures for this property
Cap Rate, Value Estimation, Potential NOI and more
View Realmo Analytics
Market
Vacancy Rate% for Multifamily in Midwest region

Questions? Ask Rey
Realmo’s AI knows this listing — price, zoning, demand, history. Ask anything.
Frequently Asked Questions
What type of property is this?
Duplex - Two residences offer updated kitchens, in-unit laundry, private storage, and access to a detached brick garage.
Where is this duplex located?
The property is located at 7104 Tulane Avenue University City, MO.
What is the asking price?
The asking price for this property is $399,000.
What are key features of this property?
This property features: 2,784‑square‑foot duplex on a 0.0918‑acre lot; Two 2bd/1ba units; first floor vacant and second floor leased through June 2027; Full‑brick Tudor construction dating to 1929


