Office Building with Fenced
For Sale
$325,000
710 VAN BUREN St, Eugene, OR 97402
CommercialSale, Eugene, OR
Property Size968 SF
Lot Size0.11 Acres
Price / SF$335.74
Days on Market124
Property Features for 710 VAN BUREN St
General Information
Property type
Commercial Sale
Property subtype
Office
Zoning
C-2
Directions
Southwest corner of 7th and Van Buren
Subdivision
_245
Standard status
Active
APN
0473692
Size
968 SF
Lot size
0.11 Acres
Taxes and HOA fees
Tax Description
17-04-36-11-14600
Tax Annual Amount
2730
Legal Description
17-04-36-11-14600
Utilities
Heating system
Heat Pump (Heating), Forced Air
Cooling system
Heat Pump
Building Details
Year built
1925
Floors in Building
1
Building materials
Frame, FullBasement, LapSiding
Roof type
Composition
Listing Agency:
Signature Realty Group
Listed By:
Jane Murphy
(541) 953-3699
Added: Jun 9
Changed: Oct 10
Last Checked: Oct 10 at 11:06AM
MLS# 665701117
Copyright © 2026 Regional Multiple Listing Services. All rights reserved. All information provided by the listing agent/broker is deemed reliable but is not guaranteed and should be independently verified.
Investment Insights
Based on property information with market context.
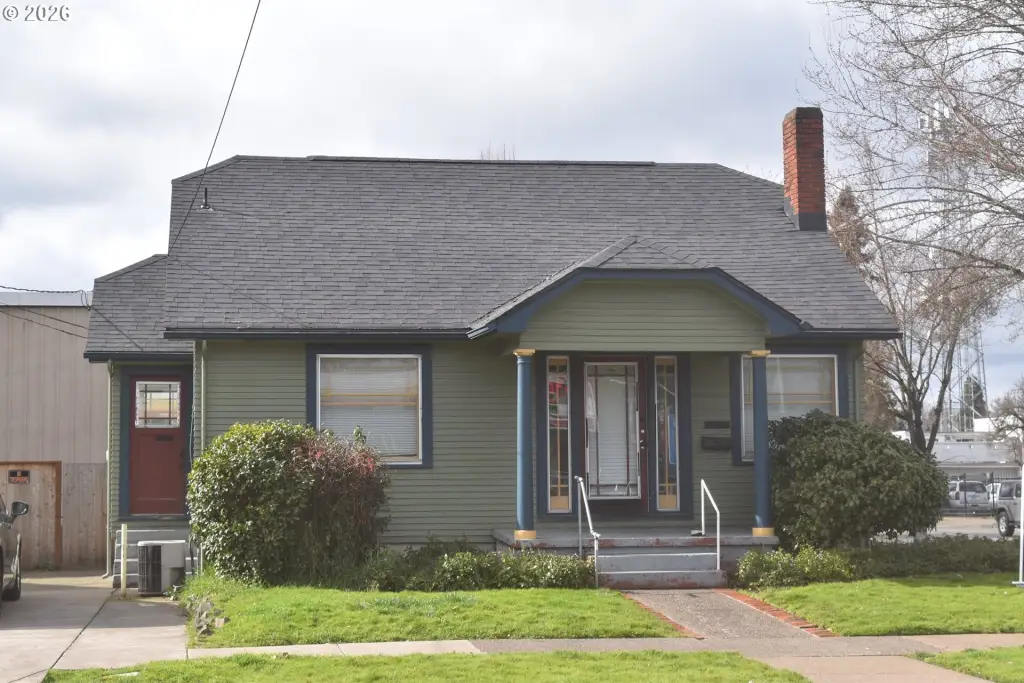
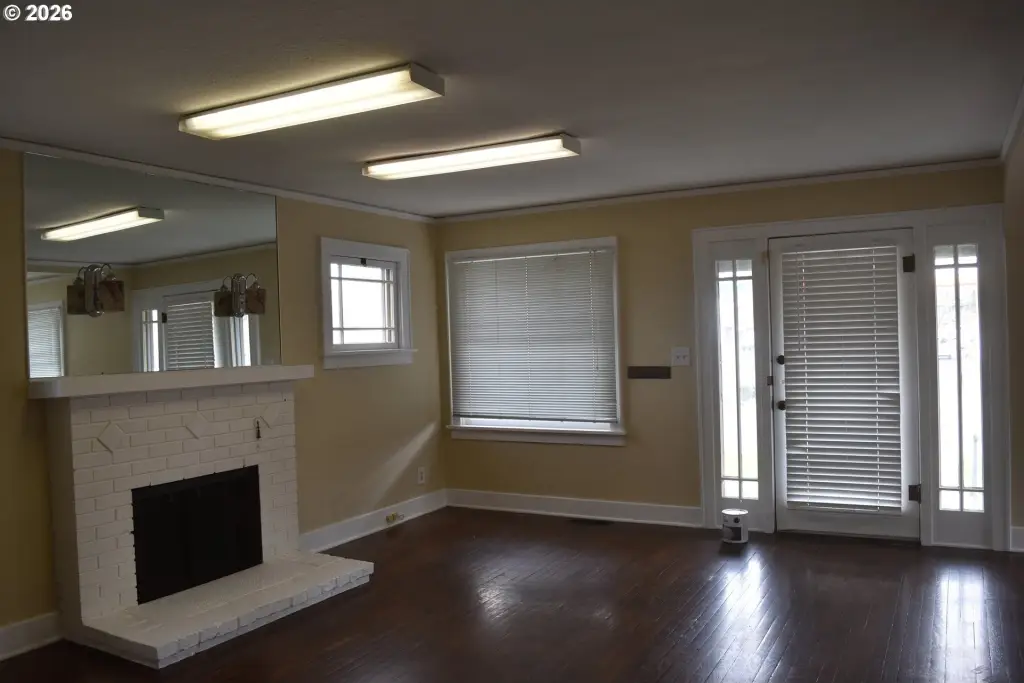
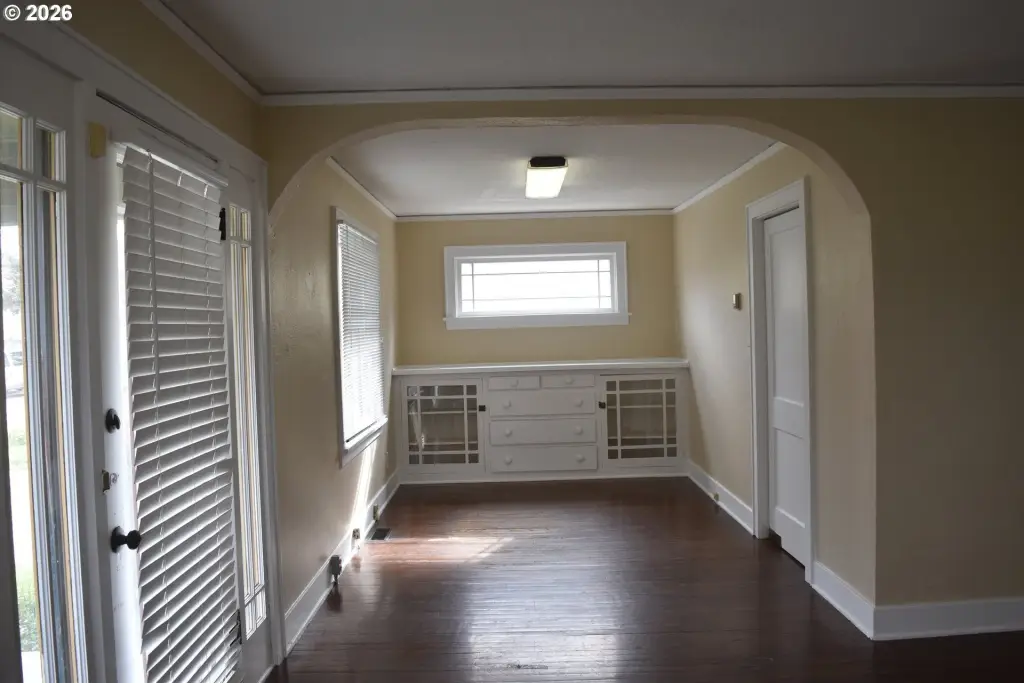
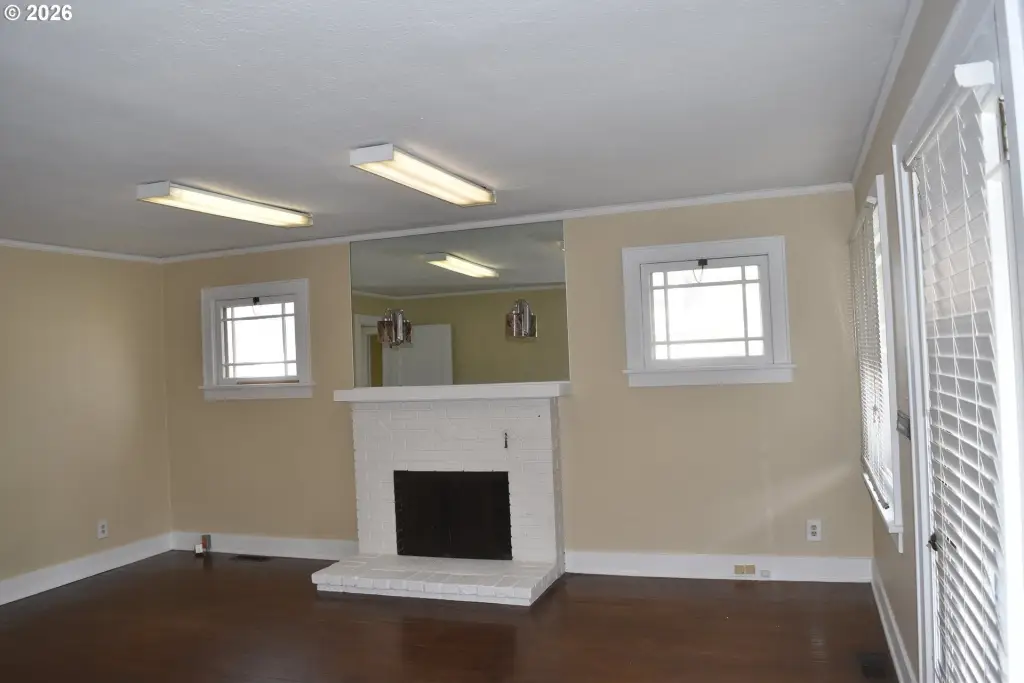
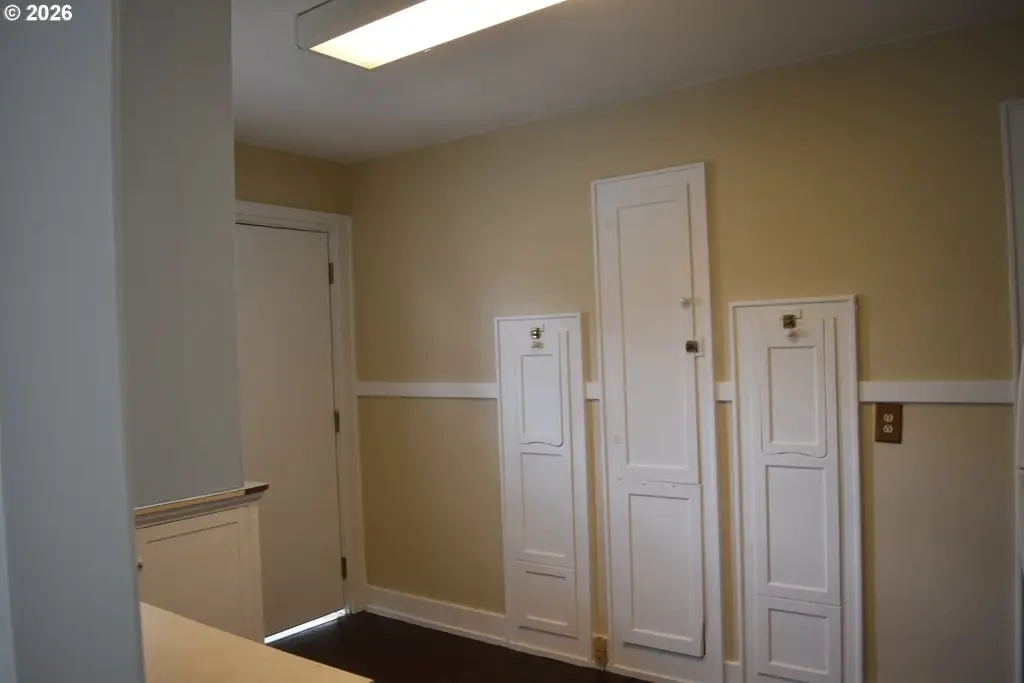
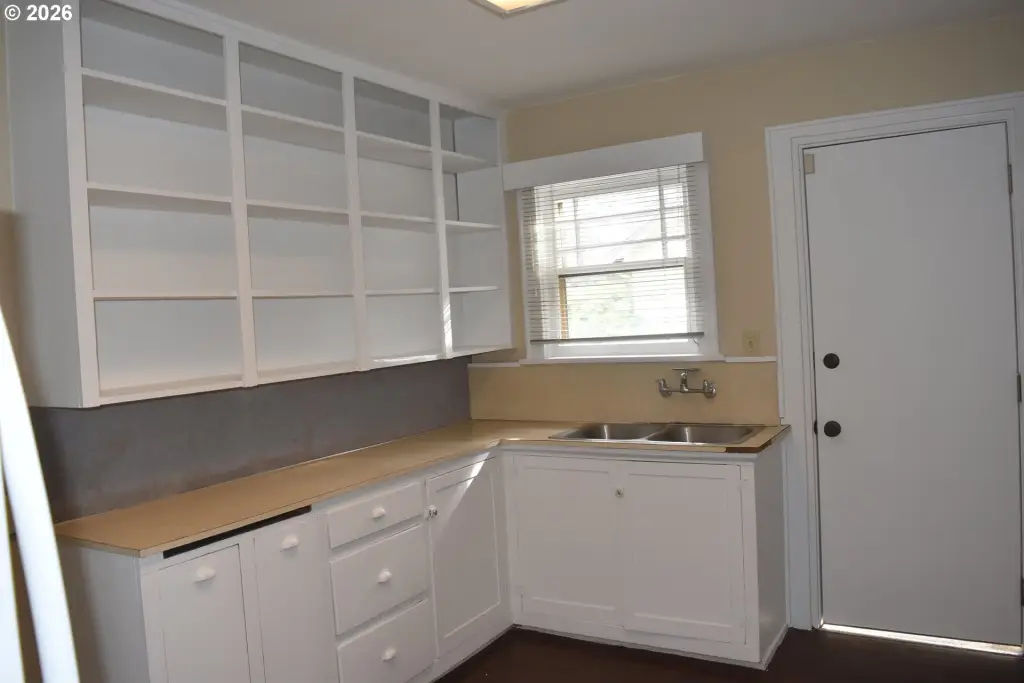
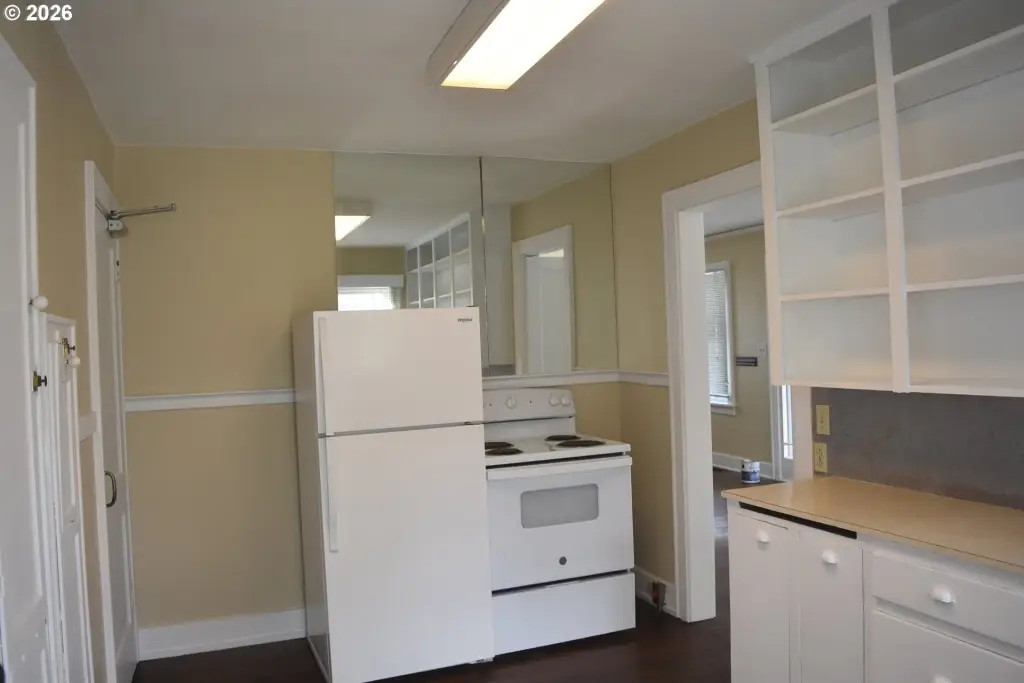
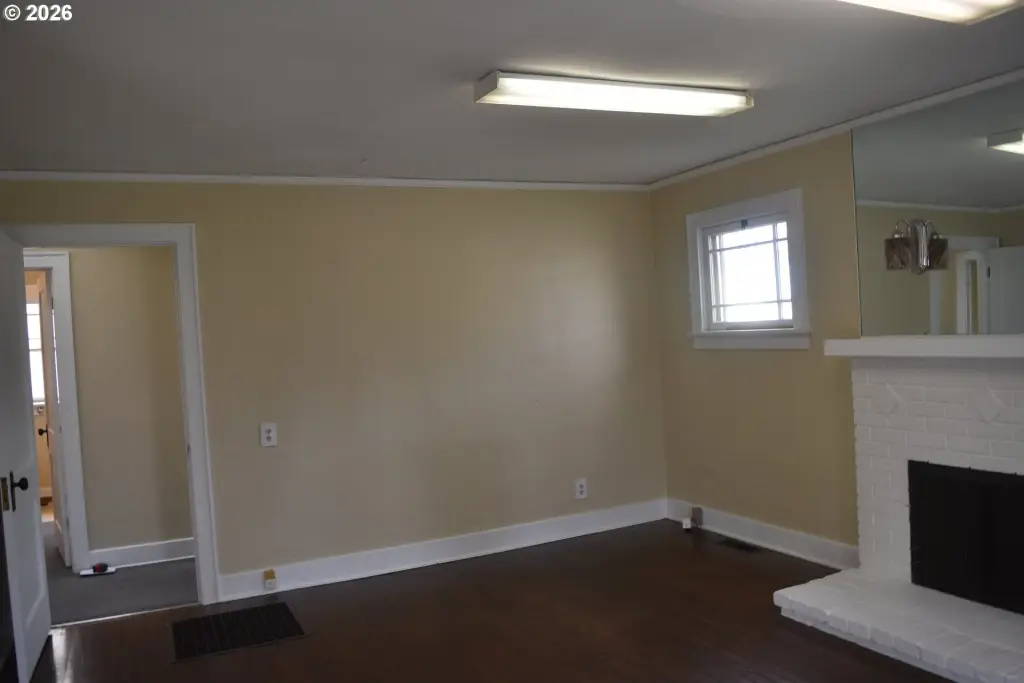
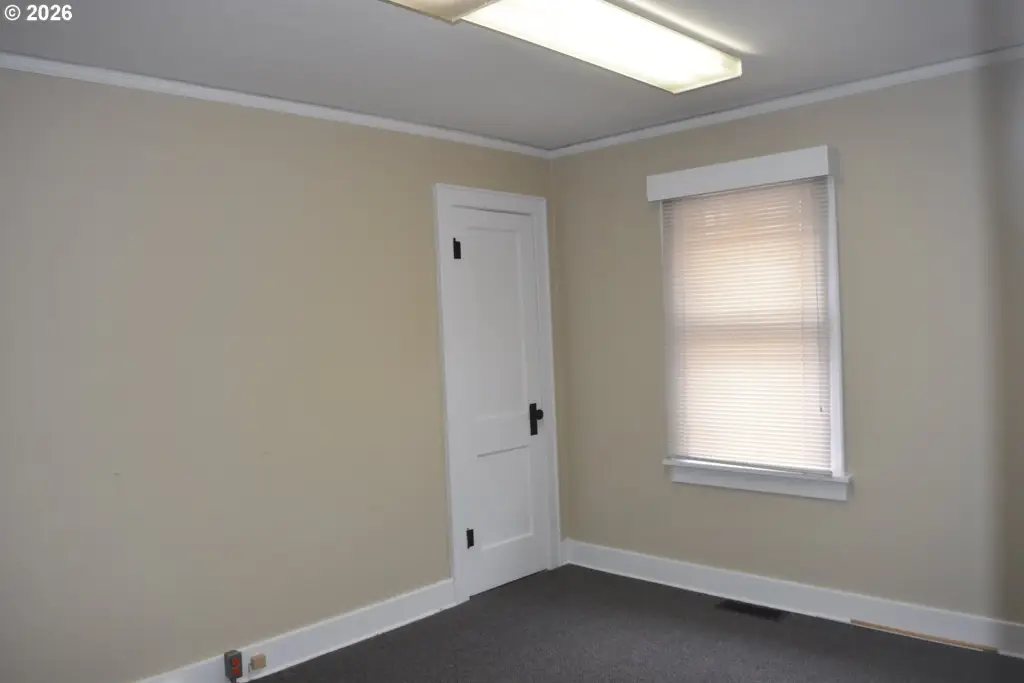
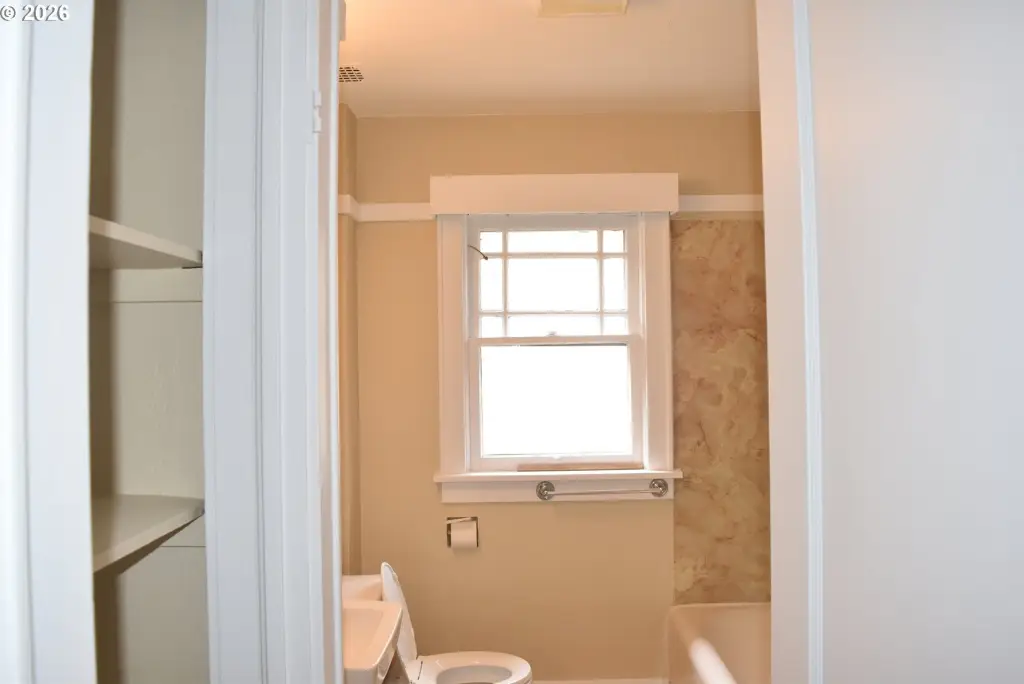
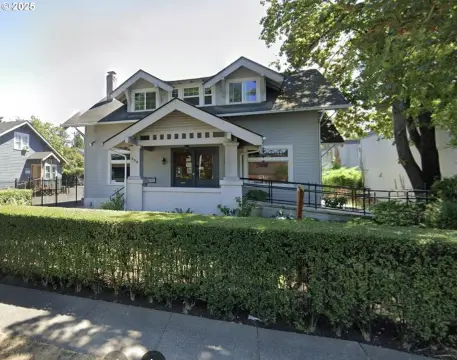
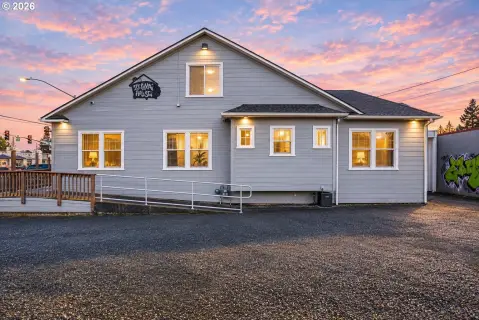
This 968-square-foot office building occupies a 0.11-acre site and was constructed in 1925 as a bungalow-style structure. The property includes an unfinished basement that is excluded from the stated building area, along with frame construction, lap siding, and a composition roof. Heating and cooling are provided by a heat pump, with forced-air heating also present; the HVAC system is new.
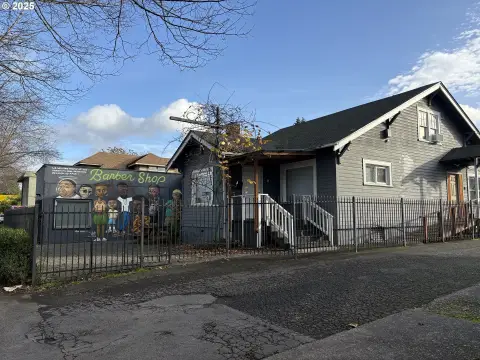
The backyard is enclosed, and a drive-through gate provides access from the 7th St side. The property is located at 710 Van Buren St in Eugene, Oregon, and carries C-2 zoning.
The backyard is enclosed, and a drive-through gate provides access from the 7th St side. The property is located at 710 Van Buren St in Eugene, Oregon, and carries C-2 zoning.
Key Highlights
- 968 SF office building on a 0.11‑acre lot
- C‑2 zoning
- 1925 bungalow‑style building with frame construction and lap siding
Financial Insights
Estimated NOI and Cap Rate
NOI / Yr
$14,810
Cap Rate
4.56%
Suggested Prices Based on Cap Rates
Cap Rate 5%
$296,200
$296.2K
Cap Rate 7%
$211,571
$211.6K
Cap Rate 9%
$164,556
$164.6K
Market Conditions
NOI Build-Up for 968 SF
Gross rent
$23.2K $24.00/SF
− Vacancy
−$3.5K −$3.60/SF
EGI
$19.7K $20.40/SF
− OpEx
−$4.9K −$5.10/SF
NOI
$14.8K $15.30/SF
Area
Eugene, OR
Vacancy
15.00%
Lease Rate
$24.00 /SF/Yr
Expense Ratio
25.00%
Simulate Cap Rate and NOI
Suggested Prices Based on Cap Rates
Cap Rate 5%
$296,200
Cap Rate 7%
$211,571
Cap Rate 9%
$164,556
Alternative Uses
Best Use
Office B
$211.6K
$185.1K – $246.8K
NOI $14,810 @ 7.0% cap · market cap 4.56%
Second Best
—
—
no second resolved use
Theoretical Best
Office A
$292.1K
$255.6K – $340.7K
NOI $20,444 @ 7.0% cap · market cap 6.29%
Zoning and permitted uses should be independently verified with authorities.
Property Analytics
Unlock full access to Insights
Subscribe to Realmo Intelligence
Open Analytics
Current Use
Location Intelligence
Trade Area within ½ mile
1,541
Businesses Nearby
Explore this area
Business Placement
Demographics for 97402, OR
56,610
Population
23,882
Households
2.4
Avg Household Size
38
Median Age
26%
College-Educated
91%
High-School Grad
68.6 sq mi
ZIP Area
825
Density / Sq Mi
$55,743
Median Household Income
$35,728
Median Earnings
$1,287
Median Rent
$330,000
Median Home Value
Check the figures for this property
Cap Rate, Value Estimation, Potential NOI and more
View Realmo Analytics
Market
Vacancy Rate% for Office in West region

Questions? Ask Rey
Realmo’s AI knows this listing — price, zoning, demand, history. Ask anything.






Frequently Asked Questions
What type of property is this?
Office building - C-2-zoned property with a gated drive-through yard and updated HVAC system.
Where is this office building located?
The property is located at 710 VAN BUREN St Eugene, OR.
What is the asking price?
The asking price for this property is $325,000.
What are key features of this property?
This property features: 968 SF office building on a 0.11‑acre lot; C‑2 zoning; 1925 bungalow‑style building with frame construction and lap siding


