Automotive Repair Shop with Paint
For Sale
$1,100,000
7086 Southeastern Ave, Indianapolis, IN 46239
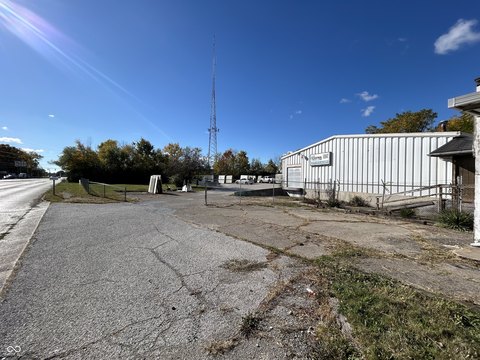
Automotive facility with dedicated repair, painting, office, and equipment areas plus front and rear vehicle access.
Property Size9,000 SF
Price / SF$122.22
Days on Market58
Property Features for 7086 Southeastern Ave
General Information
Standard status
Active
Size
9,000 SF
Site & Location
Road Access
Yes
Fenced Yard
Yes
Additional Details
Business Included
Yes
Clear Height
16 ft
Amenities
custom-built paint booth
separate computer room
two post automotive lifts
driveway connecting front and back
Building Details
Buildings
2
Listing Agency:
Blooming Wilderness Cedar Real Estate Brokerage LLC
Listed By:
Leah Mencke · License #RB14041750
(317) 659-1150
Source:
Mcwatersrealestate
Added: Aug 17
Changed: Oct 7
Last Checked: Oct 7 at 12:55PM
Displayed information is deemed reliable but is not guaranteed and should be independently verified. All listing content including descriptions, pricing, images are the copyrighted material of Blooming Wilderness Cedar Real Estate Brokerage LLC
Investment Insights
Based on property information with market context.
This automotive repair facility includes a 6,000-square-foot primary shop with an office, two bathrooms, a custom-built paint booth, and a separate computer room for paint-mix control. The property also includes a 3,000-square-foot pole barn-style building measuring 30x100 feet with 16-foot ceilings. Two post automotive lifts are in place, and the layout accommodates equipment up to 14 feet tall.
Front and rear road access are connected by a driveway through the property, supporting vehicle and equipment movement between both sides. Additional features include ample parking and a fenced rear section. The property may be acquired as a vacant commercial facility or together with the operating collision repair business and its established customer relationships.
Front and rear road access are connected by a driveway through the property, supporting vehicle and equipment movement between both sides. Additional features include ample parking and a fenced rear section. The property may be acquired as a vacant commercial facility or together with the operating collision repair business and its established customer relationships.
Key Highlights
- 6,000‑square‑foot primary automotive shop
- 3,000‑square‑foot secondary building measuring 30x100 feet
- 16‑foot ceilings in the pole barn‑style building
Financial Insights
Estimated NOI and Cap Rate
NOI / Yr
$100,302
Cap Rate
9.12%
Suggested Prices Based on Cap Rates
Cap Rate 5%
$2,006,040
$2.0M
Cap Rate 7%
$1,432,886
$1.4M
Cap Rate 9%
$1,114,467
$1.1M
Market Conditions
NOI Build-Up for 9,000 SF
Gross rent
$156.6K $17.40/SF
− Vacancy
−$13.3K −$1.48/SF
EGI
$143.3K $15.92/SF
− OpEx
−$43.0K −$4.78/SF
NOI
$100.3K $11.14/SF
Area
ZIP 46239
Vacancy
8.50%
Lease Rate
$17.40 /SF/Yr
Expense Ratio
30.00%
Simulate Cap Rate and NOI
Suggested Prices Based on Cap Rates
Cap Rate 5%
$2,006,040
Cap Rate 7%
$1,432,886
Cap Rate 9%
$1,114,467
Alternative Uses
Best Use
Industrial
$1.51M
$1.32M – $1.76M
NOI $105,605 @ 7.0% cap · market cap 9.60%
Second Best
Retail
$1.43M
$1.25M – $1.67M
NOI $100,302 @ 7.0% cap · market cap 9.12%
Theoretical Best
Office A
$2.28M
$1.99M – $2.66M
NOI $159,408 @ 7.0% cap · market cap 14.49%
Zoning and permitted uses should be independently verified with authorities.
How Realmo checks its estimates
Property Analytics
Unlock full access to Insights
Subscribe to Realmo Intelligence
Open Analytics
Current Use
Lease Details
16 ft
Clear height
Turnkey business
Opportunity
Yes
Fenced yard
Yes
Paved road access
Location Intelligence
Trade Area within ½ mile
81
Businesses Nearby
Well-served
Demand for This Use
Explore this area
Business Placement
Demographics for 46239, IN
33,290
Population
12,284
Households
2.7
Avg Household Size
35
Median Age
37%
College-Educated
92%
High-School Grad
28.3 sq mi
ZIP Area
1,176
Density / Sq Mi
$92,160
Median Household Income
$49,543
Median Earnings
$1,304
Median Rent
$253,000
Median Home Value
Check the figures for this property
Cap Rate, Value Estimation, Potential NOI and more
View Realmo Analytics
Market
Vacancy Rate% for Industrial in Indianapolis, IN

Questions? Ask Rey
Realmo’s AI knows this listing — price, zoning, demand, history. Ask anything.




Similar Off Market Nearby
- Diamond Automotive & M-Collector — 7927 Southeastern Ave, Indianapolis, IN 46239
- Mark's Collision Center — 7086 Southeastern Ave, Indianapolis, IN 46239
- THE AUTO CENTER — 7006 Southeastern Ave, Indianapolis, IN 46239
- A&B Auto Diesel LLC — 7307 E Troy Ave, Indianapolis, IN 46239
- MacAllister Power Systems — 6300 Southeastern Ave suite c, Indianapolis, IN 46203
Frequently Asked Questions
What type of property is this?
Auto shop - Automotive facility with dedicated repair, painting, office, and equipment areas plus front and rear vehicle access.
Where is this auto shop located?
The property is located at 7086 Southeastern Ave Indianapolis, IN.
What is the asking price?
The asking price for this property is $1,100,000.
What are key features of this property?
This property features: 6,000‑square‑foot primary automotive shop; 3,000‑square‑foot secondary building measuring 30x100 feet; 16‑foot ceilings in the pole barn‑style building



