Refinished Flex Space with Fenced
For Sale
$750,000
3910 E 21st St, Indianapolis, IN 46218
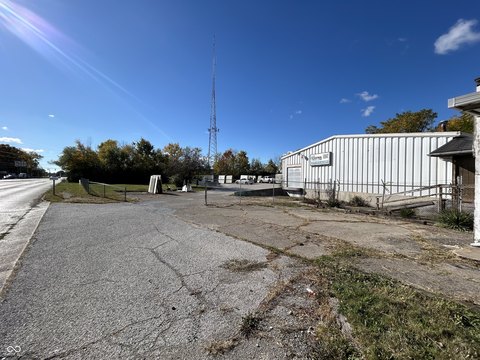
Updated flex property with renovated office areas, upgraded building systems, accessory storage, and secured outdoor space.
Property Size6,603 SF
Price / SF$113.58
Days on Market55
Property Features for 3910 E 21st St
General Information
Standard status
Active
Size
6,603 SF
Site & Location
Highway Access
Yes
Fenced Yard
Yes
Amenities
fenced lot
detached garage
awnings
Building Details
Year Built
1947
Year Renovated
2026
Listing Agency:
Keller Williams Indy Metro NE
Listed By:
Justin Griffith · License #RB14047020
(317) 507-5599
Source:
Megandusing
Added: Aug 20
Changed: Oct 6
Last Checked: Oct 7 at 3:52PM
Displayed information is deemed reliable but is not guaranteed and should be independently verified. All listing content including descriptions, pricing, images are the copyrighted material of Keller Williams Indy Metro NE
Investment Insights
Based on property information with market context.
Built in 1947, this 6,603 SF flex property has undergone a comprehensive 2026 renovation. Improvements include a new roof, overhead doors, electrical system, windows, interior and exterior paint, lighting, gutters, awnings, and LVP flooring in the office areas. The building also contains 3 bathrooms, while a detached garage provides additional storage. A fenced lot adds secured exterior space for the property.
The property is within the 465 loop, with access to I-70 and downtown Indianapolis described as only minutes away. Its combination of updated building components, office improvements, accessory storage, and fenced outdoor area supports a range of flex-oriented commercial requirements.
The property is within the 465 loop, with access to I-70 and downtown Indianapolis described as only minutes away. Its combination of updated building components, office improvements, accessory storage, and fenced outdoor area supports a range of flex-oriented commercial requirements.
Key Highlights
- 6,603 SF flex property built in 1947
- 2026 improvements include roof, overhead doors, electrical, windows, lighting, and paint
- Office areas feature new LVP flooring; building includes 3 bathrooms
Financial Insights
Estimated NOI and Cap Rate
NOI / Yr
$64,894
Cap Rate
8.65%
Suggested Prices Based on Cap Rates
Cap Rate 5%
$1,297,880
$1.3M
Cap Rate 7%
$927,057
$927.1K
Cap Rate 9%
$721,044
$721.0K
Market Conditions
NOI Build-Up for 6,603 SF
Gross rent
$110.9K $16.80/SF
− Vacancy
−$11.1K −$1.68/SF
EGI
$99.8K $15.12/SF
− OpEx
−$34.9K −$5.29/SF
NOI
$64.9K $9.83/SF
Area
Indianapolis, IN
Vacancy
10.00%
Lease Rate
$16.80 /SF/Yr
Expense Ratio
35.00%
Simulate Cap Rate and NOI
Suggested Prices Based on Cap Rates
Cap Rate 5%
$1,297,880
Cap Rate 7%
$927,057
Cap Rate 9%
$721,044
Alternative Uses
Best Use
Flex RnD
$927.1K
$811.2K – $1.08M
NOI $64,894 @ 7.0% cap · market cap 8.65%
Second Best
Warehouse
$571.0K
$499.6K – $666.2K
NOI $39,969 @ 7.0% cap · market cap 5.33%
Theoretical Best
Office A
$1.64M
$1.44M – $1.92M
NOI $115,051 @ 7.0% cap · market cap 15.34%
Zoning and permitted uses should be independently verified with authorities.
How Realmo checks its estimates
Property Analytics
Unlock full access to Insights
Subscribe to Realmo Intelligence
Open Analytics
Current Use
Lease Details
Yes
Fenced yard
Yes
Highway access
Location Intelligence
Trade Area within ½ mile
277
Businesses Nearby
Under-served
Demand for This Use
Explore this area
Business Placement
Demographics for 46218, IN
30,400
Population
15,343
Households
2
Avg Household Size
36
Median Age
11%
College-Educated
80%
High-School Grad
9.5 sq mi
ZIP Area
3,200
Density / Sq Mi
$34,635
Median Household Income
$29,745
Median Earnings
$1,056
Median Rent
$90,200
Median Home Value
Check the figures for this property
Cap Rate, Value Estimation, Potential NOI and more
View Realmo Analytics
Market
Vacancy Rate% for Industrial in Indianapolis, IN

Questions? Ask Rey
Realmo’s AI knows this listing — price, zoning, demand, history. Ask anything.



Similar Off Market Nearby
- JAM's Sweet Treats — 2727 N Denny St, Indianapolis, IN 46218
Frequently Asked Questions
What type of property is this?
Flex space - Updated flex property with renovated office areas, upgraded building systems, accessory storage, and secured outdoor space.
Where is this flex space located?
The property is located at 3910 E 21st St Indianapolis, IN.
What is the asking price?
The asking price for this property is $750,000.
What are key features of this property?
This property features: 6,603 SF flex property built in 1947; 2026 improvements include roof, overhead doors, electrical, windows, lighting, and paint; Office areas feature new LVP flooring; building includes 3 bathrooms


