Long-Term Leased Retail
For Sale
Contact for pricing
7038 -7054 Greenleaf, Whittier, CA 90602
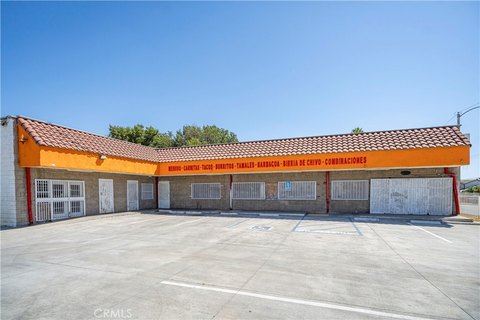
A 100% leased retail asset anchored by a long-operating cinema, with freeway access to major Los Angeles and Orange County corridors.
Property Size34,920 SF
Price / SF$357.96
Days on Market115
Property Features for 7038 -7054 Greenleaf
General Information
Standard status
Active
Size
34,920 SF
Property subtype
Retail
Occupancy
100%
Lease Type
NNN
Investment Type
Net Lease
Additional Details
Highway Access
Yes
Building Details
Year Renovated
2003
Tenancy
Multi
Listing Agency:
CBRE - Orange County
Listed By:
Joe Miller · License #CA 00902422
Source:
Crexi
Added: Jun 20
Changed: Oct 7
Last Checked: Oct 11 at 4:20AM
Displayed information is deemed reliable but is not guaranteed and should be independently verified. All listing content including descriptions, pricing, images are the copyrighted material of CBRE - Orange County
Investment Insights
Based on property information with market context.
The offering consists of a retail property with multiple storefronts at 7038–7054 Greenleaf, presented as a long-term, stabilized asset. The center includes Whittier Village Cinema, which has owned and operated the property for more than 25 years. The offering is described as 100% leased, with tenancy characterized as rarely vacant based on the provided remarks.
The location is in affluent, uptown Whittier, approximately two blocks north of Whittier College. The property is noted as being freeway accessible to the San Gabriel (605) and Santa Ana (5) Freeways, and near main arterial Whittier Boulevard, supporting convenient regional and local access.
For investors or buyers seeking a retail acquisition with established on-site operations and consistent occupancy per the provided information, this asset combines a long-standing cinema presence with a fully leased storefront profile. Its placement near major freeways and a principal thoroughfare can be practical for retailers and service businesses looking for straightforward customer access in a consistently maintained shopping environment.
The location is in affluent, uptown Whittier, approximately two blocks north of Whittier College. The property is noted as being freeway accessible to the San Gabriel (605) and Santa Ana (5) Freeways, and near main arterial Whittier Boulevard, supporting convenient regional and local access.
For investors or buyers seeking a retail acquisition with established on-site operations and consistent occupancy per the provided information, this asset combines a long-standing cinema presence with a fully leased storefront profile. Its placement near major freeways and a principal thoroughfare can be practical for retailers and service businesses looking for straightforward customer access in a consistently maintained shopping environment.
Key Highlights
- 100% leased retail asset anchored by Whittier Village Cinema
- Whittier Village Cinema has been owned and operated for over 25 years
- Parent company, Starlight Cinemas, operates 7 locations
Financial Insights
Estimated NOI and Cap Rate
NOI / Yr
$772,591
Cap Rate
6.18%
Suggested Prices Based on Cap Rates
Cap Rate 5%
$15,451,820
$15.5M
Cap Rate 7%
$11,037,014
$11.0M
Cap Rate 9%
$8,584,344
$8.6M
Market Conditions
NOI Build-Up for 34,920 SF
Gross rent
$1.18M $33.84/SF
− Vacancy
−$78.0K −$2.23/SF
EGI
$1.10M $31.61/SF
− OpEx
−$331.1K −$9.48/SF
NOI
$772.6K $22.12/SF
Area
Los Angeles County, CA
Vacancy
6.60%
Lease Rate
$33.84 /SF/Yr
Expense Ratio
30.00%
Simulate Cap Rate and NOI
Suggested Prices Based on Cap Rates
Cap Rate 5%
$15,451,820
Cap Rate 7%
$11,037,014
Cap Rate 9%
$8,584,344
Alternative Uses
Best Use
Retail
$11.04M
$9.66M – $12.88M
NOI $772,591 @ 7.0% cap · market cap 6.18%
Second Best
—
—
no second resolved use
Theoretical Best
Office A
$18.70M
$16.36M – $21.81M
NOI $1,308,722 @ 7.0% cap · market cap 10.47%
Zoning and permitted uses should be independently verified with authorities.
How Realmo checks its estimates
Property Analytics
Unlock full access to Insights
Subscribe to Realmo Intelligence
Open Analytics
Current Use
Lease Details
Yes
Highway access
Location Intelligence
Trade Area within ½ mile
2,622
Businesses Nearby
105k
Monthly Visits Nearby
Explore this area
Business Placement
Foot Traffic Nearby
Shops & Services 47%
Dining 40%
Hotels & Casinos 12%
Beauty & Spa 1%
ARCO
Shops & Services
23,813 visits/mo
0.4 miles
The Coffee Bean & Tea Leaf
Dining
15,079 visits/mo
0.1 miles
Bank of America
Shops & Services
12,152 visits/mo
0.2 miles
DoubleTree by Hilton Hotel Whittier Los Angeles
Hotels & Casinos
12,114 visits/mo
0.3 miles
Starbucks
Dining
11,275 visits/mo
0.0 miles
Demographics for 90602, CA
25,521
Population
8,514
Households
3
Avg Household Size
36
Median Age
22%
College-Educated
85%
High-School Grad
3.8 sq mi
ZIP Area
6,716
Density / Sq Mi
$67,259
Median Household Income
$37,237
Median Earnings
$1,719
Median Rent
$729,300
Median Home Value
Check the figures for this property
Cap Rate, Value Estimation, Potential NOI and more
View Realmo Analytics
Market
Vacancy Rate% for Retail in West region

Questions? Ask Rey
Realmo’s AI knows this listing — price, zoning, demand, history. Ask anything.




Frequently Asked Questions
What type of property is this?
Retail space - A 100% leased retail asset anchored by a long-operating cinema, with freeway access to major Los Angeles and Orange County corridors.
Where is this retail space located?
The property is located at 7038 -7054 Greenleaf Whittier, CA.
What is the asking price?
The asking price for this property is $12,500,000.
What are key features of this property?
This property features: 100% leased retail asset anchored by Whittier Village Cinema; Whittier Village Cinema has been owned and operated for over 25 years; Parent company, Starlight Cinemas, operates 7 locations


