Duplex With Private
For Sale
$415,500
Pending
70 RED MILL DRIVE, Palm Coast, FL 32164
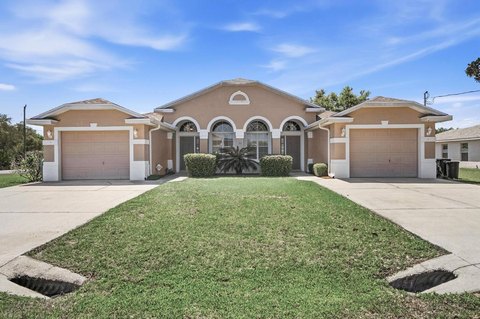
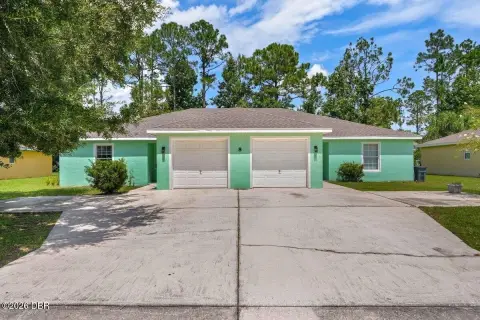
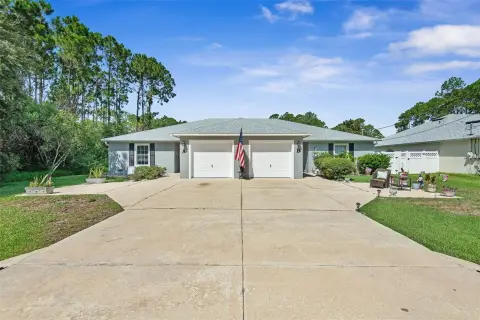
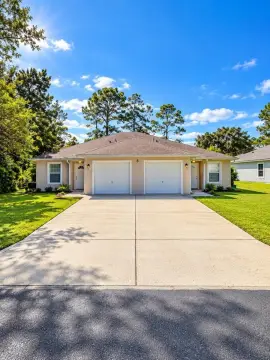
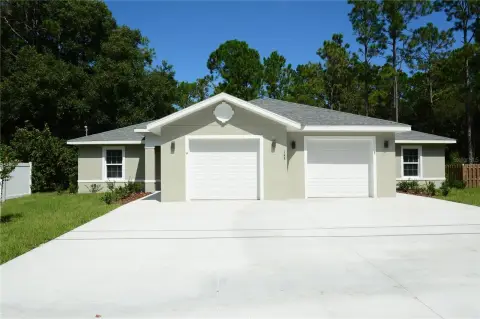
Two matching three-bedroom residences provide flexible rental, ownership, or multigenerational living arrangements.
Property Size2,541 SF
Days on Market66
Property Features for 70 RED MILL DRIVE
General Information
Standard status
Pending
Size
2,541 SF
Property subtype
Duplex
Building Details
Year Built
2003
Listing Agency:
TRADEMARK REALTY GROUP LLC
(386) 447-6889
Listed By:
Nicholas Michael · License #3457628
(386) 338-7711
Source:
Dennisrealty
Added: Aug 3
Changed: Oct 6
Last Checked: Oct 5 at 6:46PM
Displayed information is deemed reliable but is not guaranteed and should be independently verified. All listing content including descriptions, pricing, images are the copyrighted material of TRADEMARK REALTY GROUP LLC
Investment Insights
Based on property information with market context.
Built in 2003, this duplex includes two matching residences, each with three bedrooms, two full bathrooms, and an open living-and-dining layout. Luxury vinyl plank flooring extends through the main living areas, while the bedrooms feature carpeting. Sliding doors connect both residences to separate rear patios, adding private outdoor space to each floor plan. The property measures 2,541 square feet.
The duplex is in the Lehigh Woods community of Palm Coast and faces a wooded area, with no residences immediately opposite the property. Shopping, restaurants, schools, and parks are located nearby, while US-1 and I-95 provide regional road access. The matching layouts support rental use, owner occupancy in one residence, or multigenerational living.
The duplex is in the Lehigh Woods community of Palm Coast and faces a wooded area, with no residences immediately opposite the property. Shopping, restaurants, schools, and parks are located nearby, while US-1 and I-95 provide regional road access. The matching layouts support rental use, owner occupancy in one residence, or multigenerational living.
Key Highlights
- Two matching residences, each with 3 bedrooms and 2 full bathrooms
- 2,541‑square‑foot duplex built in 2003
- Private rear patio assigned to each residence
Financial Insights
Estimated NOI and Cap Rate
NOI / Yr
$29,340
Cap Rate
7.06%
Suggested Prices Based on Cap Rates
Cap Rate 5%
$586,800
$586.8K
Cap Rate 7%
$419,143
$419.1K
Cap Rate 9%
$326,000
$326.0K
Market Conditions
NOI Build-Up for 2,541 SF
Gross rent
$44.2K $17.40/SF
− Vacancy
−$2.3K −$0.90/SF
EGI
$41.9K $16.50/SF
− OpEx
−$12.6K −$4.95/SF
NOI
$29.3K $11.55/SF
Area
Flagler County, FL
Vacancy
5.20%
Lease Rate
$17.40 /SF/Yr
Expense Ratio
30.00%
Simulate Cap Rate and NOI
Suggested Prices Based on Cap Rates
Cap Rate 5%
$586,800
Cap Rate 7%
$419,143
Cap Rate 9%
$326,000
Alternative Uses
Best Use
Multifamily LT 5
$419.1K
$366.8K – $489.0K
NOI $29,340 @ 7.0% cap · market cap 7.06%
Second Best
Apartment 5plus
$372.4K
$325.8K – $434.5K
NOI $26,067 @ 7.0% cap · market cap 6.27%
Theoretical Best
Office A
$610.6K
$534.3K – $712.4K
NOI $42,744 @ 7.0% cap · market cap 10.29%
Zoning and permitted uses should be independently verified with authorities.
Property Analytics
Unlock full access to Insights
Subscribe to Realmo Intelligence
Open Analytics
Current Use
Location Intelligence
Trade Area within ½ mile
68
Businesses Nearby
Explore this area
Business Placement
Demographics for 32164, FL
49,412
Population
22,902
Households
2.2
Avg Household Size
48
Median Age
26%
College-Educated
91%
High-School Grad
32.5 sq mi
ZIP Area
1,520
Density / Sq Mi
$71,738
Median Household Income
$37,976
Median Earnings
$1,724
Median Rent
$308,100
Median Home Value
Check the figures for this property
Cap Rate, Value Estimation, Potential NOI and more
View Realmo Analytics
Market
Vacancy Rate% for Multifamily in South region

Questions? Ask Rey
Realmo’s AI knows this listing — price, zoning, demand, history. Ask anything.






Frequently Asked Questions
What type of property is this?
Duplex - Two matching three-bedroom residences provide flexible rental, ownership, or multigenerational living arrangements.
Where is this duplex located?
The property is located at 70 RED MILL DRIVE Palm Coast, FL.
What is the asking price?
The asking price for this property is $415,500.
What are key features of this property?
This property features: Two matching residences, each with 3 bedrooms and 2 full bathrooms; 2,541‑square‑foot duplex built in 2003; Private rear patio assigned to each residence