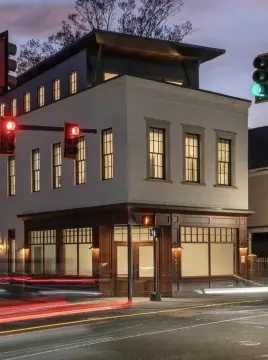
Mixed-Use Property with Restaurant
For Sale
Contact for pricing
69 Columbus Street, Charleston, SC 29403
Four-space mixed-use property combining barber, restaurant, and residential components.
Property Size4,328 SF
Price / SF$462.11
Days on Market52
Property Features for 69 Columbus Street
General Information
Standard status
Active
Size
4,328 SF
Property subtype
Retail, Land, Multifamily
Zoning
City of Charleston - GB - General Business
Building Details
Year Built
1971
Units
4
Listing Agency:
The AgentOwned Realty Co
Listed By:
Doug Richardson · License #SC 79556
(843) 871-9133
Source:
Crexi
Added: Aug 27
Changed: Oct 12
Last Checked: Oct 16 at 9:31AM
Displayed information is deemed reliable but is not guaranteed and should be independently verified. All listing content including descriptions, pricing, images are the copyrighted material of The AgentOwned Realty Co

Ask AI about this property
Review the available facts, identify missing information and prepare questions for the agent.
Investment Insights
Based on property information with market context.
This mixed-use property comprises two buildings with four distinct spaces totaling 4,328 square feet. The main building includes a 2,760-square-foot barber shop and school renovated in 2022, along with a separate 392-square-foot barber shop. A second 392-square-foot space is configured as a restaurant shell with a hood, three-compartment hand sink, mop sink, restroom, grease trap, and separate meter; renovation is needed. The property also includes a 784-square-foot upstairs apartment with two bedrooms and two bathrooms, currently undergoing complete renovation.
Constructed in 1971, the property is zoned City of Charleston - GB - General Business. The combination of commercial service, restaurant, and residential space creates a varied mixed-use configuration within one property.
Constructed in 1971, the property is zoned City of Charleston - GB - General Business. The combination of commercial service, restaurant, and residential space creates a varied mixed-use configuration within one property.
Key Highlights
- 4,328 SF across two buildings and four spaces
- 2,760 SF barber shop and school renovated in 2022
- 392 SF restaurant shell with hood, grease trap, and separate meter
Financial Insights
Estimated NOI and Cap Rate
NOI / Yr
$70,032
Cap Rate
3.50%
Suggested Prices Based on Cap Rates
Cap Rate 5%
$1,400,640
$1.4M
Cap Rate 7%
$1,000,457
$1.0M
Cap Rate 9%
$778,133
$778.1K
Market Conditions
NOI Build-Up for 4,328 SF
Gross rent
$101.3K $23.40/SF
− Vacancy
−$7.9K −$1.83/SF
EGI
$93.4K $21.57/SF
− OpEx
−$23.3K −$5.39/SF
NOI
$70.0K $16.18/SF
Area
Charleston, SC
Vacancy
7.80%
Lease Rate
$23.40 /SF/Yr
Expense Ratio
25.00%
Simulate Cap Rate and NOI
Suggested Prices Based on Cap Rates
Cap Rate 5%
$1,400,640
Cap Rate 7%
$1,000,457
Cap Rate 9%
$778,133
Alternative Uses
Best Use
Specialty Retail
$1.00M
$875.4K – $1.17M
NOI $70,032 @ 7.0% cap · market cap 3.50%
Second Best
Retail
$832.5K
$728.5K – $971.3K
NOI $58,277 @ 7.0% cap · market cap 2.91%
Theoretical Best
Office A
$1.17M
$1.02M – $1.37M
NOI $81,986 @ 7.0% cap · market cap 4.10%
Zoning and permitted uses should be independently verified with authorities.
How Realmo checks its estimates
Property Analytics
Unlock full access to Insights
Subscribe to Realmo Intelligence
Open Analytics
Current Use
Location Intelligence
Trade Area within ½ mile
2,537
Businesses Nearby
93k
Monthly Visits Nearby
Explore this area
Business Placement
Foot Traffic Nearby
Shops & Services 41%
Hotels & Casinos 32%
Dining 15%
Apparel 7%
Hyatt House
Hotels & Casinos
20,182 visits/mo
0.3 miles
Circle K
Shops & Services
16,310 visits/mo
0.3 miles
Exxon
Shops & Services
11,361 visits/mo
0.2 miles
Jeni's Splendid Ice Creams
Dining
6,518 visits/mo
0.4 miles
Homewood Suites by Hilton Charleston Historic District
Hotels & Casinos
5,952 visits/mo
0.2 miles
Demographics for 29403, SC
21,363
Population
13,013
Households
1.6
Avg Household Size
30
Median Age
57%
College-Educated
92%
High-School Grad
5.4 sq mi
ZIP Area
3,956
Density / Sq Mi
$65,689
Median Household Income
$43,421
Median Earnings
$1,658
Median Rent
$624,000
Median Home Value
Check the figures for this property
Cap Rate, Value Estimation, Potential NOI and more
View Realmo Analytics
Market
Vacancy Rate% for Retail in Charleston, SC



Frequently Asked Questions
What type of property is this?
Mixed-use property - Four-space mixed-use property combining barber, restaurant, and residential components.
Where is this mixed-use property located?
The property is located at 69 Columbus Street Charleston, SC.
What is the asking price?
The asking price for this property is $2,000,000.
What are key features of this property?
This property features: 4,328 SF across two buildings and four spaces; 2,760 SF barber shop and school renovated in 2022; 392 SF restaurant shell with hood, grease trap, and separate meter


