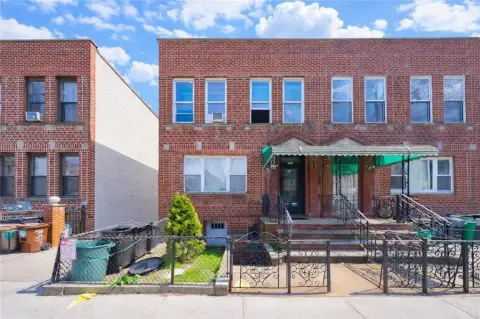
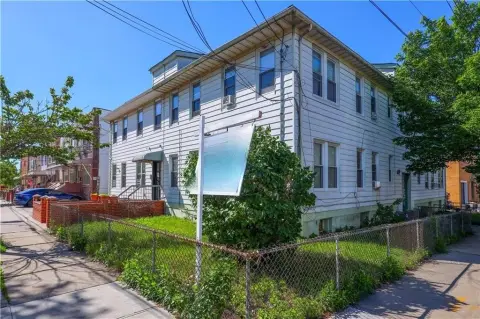
Detached Quadplex with Walkout
For Sale
$2,300,000
678 Rutland Road, Brooklyn, NY 11203
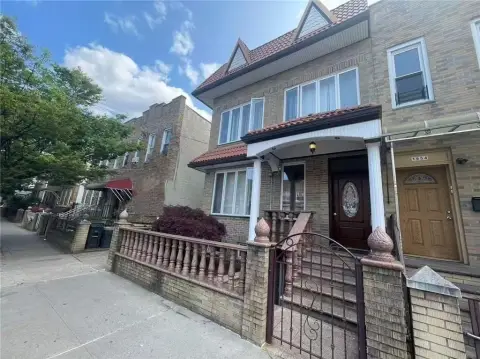
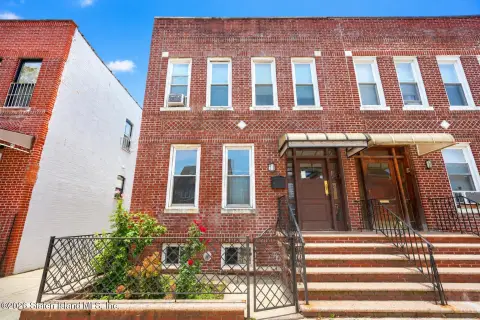
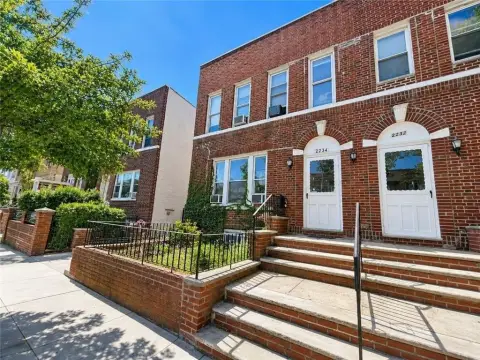
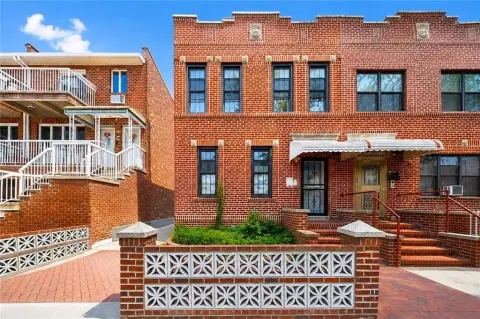
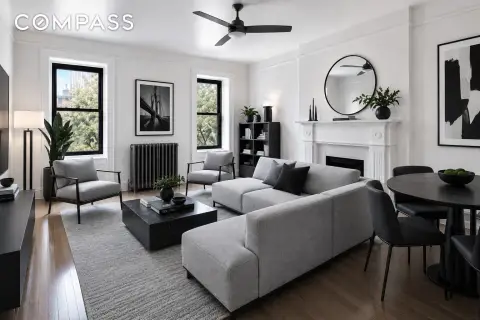
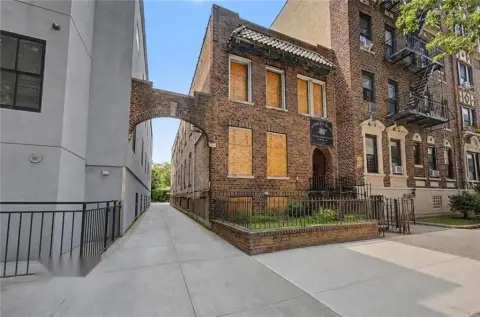
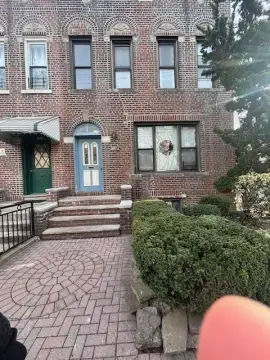
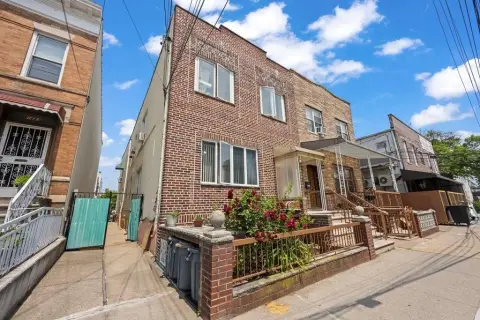
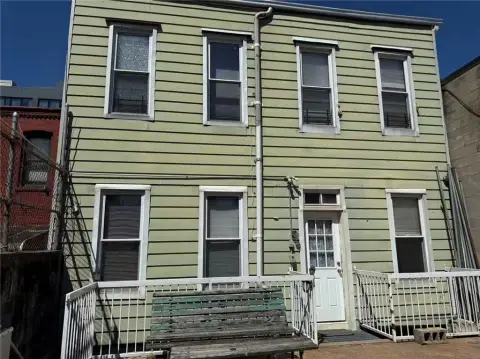
Spacious detached four-unit home with private outdoor space and a walkout basement layout for flexible living or rental use.
Property Size3,186 SF
Days on Market128
Property Features for 678 Rutland Road
General Information
Standard status
Active
Size
3,186 SF
Property subtype
Residential Income
Taxes and HOA fees
Annual Taxes
$10,127
Amenities
Electric
Baseboard
Walk-Out Access
Off Street
Building Details
Building Size
3,186 SF
Year Built
2006
Listed By:
Kadiatou Balde LHC
(646) 726-7948
Source:
Evrealestate
Added: Jun 18
Changed: Oct 13
Last Checked: Oct 23 at 7:24AM
Displayed information is deemed reliable but is not guaranteed and should be independently verified. All listing content including descriptions, pricing, images are the copyrighted material of Kadiatou Balde LHC

Ask AI about this property
Review the available facts, identify missing information and prepare questions for the agent.
Investment Insights
Based on property information with market context.
This fully detached multi-family property is arranged as four separate residential units across multiple levels. The first-floor unit offers 2 bedrooms and 2 full bathrooms with a functional layout. The second-floor unit includes 3 bedrooms and 2 full bathrooms and features a private balcony overlooking the backyard. The third-floor unit mirrors this configuration, with 3 bedrooms, 2 full bathrooms, and its own private backyard-facing balcony.
A walkout basement completes the building with additional living space, including 2 bedrooms and 1 full bathroom, along with separate walkout access. The property is described as being in a detached configuration and is positioned in the heart of East Flatbush, Brooklyn. The surrounding area is noted as convenient to public transportation, shopping, dining, schools, and neighborhood amenities, with TransitScore listed as 98 and WalkScore listed as 88.
For buyers and owner-occupants, the layout provides options for rental income while also supporting multi-generational living or a combination of live-in and investment use. The presence of multiple bedrooms across all levels and the added basement access can be useful for households seeking separation, privacy, or a flexible arrangement. Schedule a private showing to review the units and understand how the spaces can be utilized.
A walkout basement completes the building with additional living space, including 2 bedrooms and 1 full bathroom, along with separate walkout access. The property is described as being in a detached configuration and is positioned in the heart of East Flatbush, Brooklyn. The surrounding area is noted as convenient to public transportation, shopping, dining, schools, and neighborhood amenities, with TransitScore listed as 98 and WalkScore listed as 88.
For buyers and owner-occupants, the layout provides options for rental income while also supporting multi-generational living or a combination of live-in and investment use. The presence of multiple bedrooms across all levels and the added basement access can be useful for households seeking separation, privacy, or a flexible arrangement. Schedule a private showing to review the units and understand how the spaces can be utilized.
Key Highlights
- Detached multi‑family home built in 2006 with four units plus a walkout basement level
- First‑floor unit: 2 bedrooms and 2 full bathrooms
- Second‑floor unit: 3 bedrooms, 2 full bathrooms, and a private balcony overlooking the backyard
Financial Insights
Estimated NOI and Cap Rate
NOI / Yr
$111,579
Cap Rate
4.85%
Suggested Prices Based on Cap Rates
Cap Rate 5%
$2,231,580
$2.2M
Cap Rate 7%
$1,593,986
$1.6M
Cap Rate 9%
$1,239,767
$1.2M
Market Conditions
NOI Build-Up for 3,186 SF
Gross rent
$162.5K $51.00/SF
− Vacancy
−$3.1K −$0.97/SF
EGI
$159.4K $50.03/SF
− OpEx
−$47.8K −$15.01/SF
NOI
$111.6K $35.02/SF
Area
Brooklyn, NY
Vacancy
1.90%
Lease Rate
$51.00 /SF/Yr
Expense Ratio
30.00%
Simulate Cap Rate and NOI
Suggested Prices Based on Cap Rates
Cap Rate 5%
$2,231,580
Cap Rate 7%
$1,593,986
Cap Rate 9%
$1,239,767
Alternative Uses
Best Use
Multifamily LT 5
$1.59M
$1.39M – $1.86M
NOI $111,579 @ 7.0% cap · market cap 4.85%
Second Best
Apartment 5plus
$1.39M
$1.22M – $1.62M
NOI $97,265 @ 7.0% cap · market cap 4.23%
Theoretical Best
Specialty Retail
$2.64M
$2.31M – $3.08M
NOI $184,661 @ 7.0% cap · market cap 8.03%
Zoning and permitted uses should be independently verified with authorities.
How Realmo checks its estimates
Property Analytics
Contact the owner directly
Get the owner's phone numbers and email
Open Analytics
Location Intelligence
Trade Area within ½ mile
5,940
Businesses Nearby
Explore this area
Business Placement
Demographics for 11203, NY
81,824
Population
33,434
Households
2.4
Avg Household Size
41
Median Age
26%
College-Educated
88%
High-School Grad
2.1 sq mi
ZIP Area
38,964
Density / Sq Mi
$68,028
Median Household Income
$47,302
Median Earnings
$1,566
Median Rent
$677,700
Median Home Value
Check the figures for this property
Cap Rate, Value Estimation, Potential NOI and more
View Realmo Analytics
Market
Vacancy Rate% for Multifamily in Northeast region

Frequently Asked Questions
What type of property is this?
Quadplex - Spacious detached four-unit home with private outdoor space and a walkout basement layout for flexible living or rental use.
Where is this quadplex located?
The property is located at 678 Rutland Road Brooklyn, NY.
What is the asking price?
The asking price for this property is $2,300,000.
What are key features of this property?
This property features: Detached multi‑family home built in 2006 with four units plus a walkout basement level; First‑floor unit: 2 bedrooms and 2 full bathrooms; Second‑floor unit: 3 bedrooms, 2 full bathrooms, and a private balcony overlooking the backyard


