Turnkey Triplex with Long-Term
For Sale
$689,900
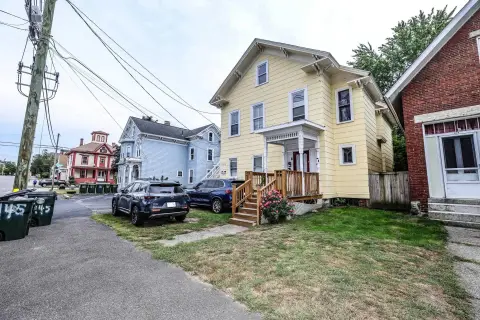
67 Pennacook St, Manchester, NH 03104
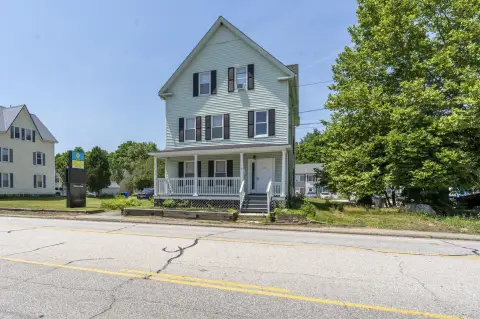
Three-unit property includes a two-way entry duplex plus an attached 2-bedroom accessory dwelling.
Property Size3,069 SF
Price / SF$224.80
Days on Market96
Property Features for 67 Pennacook St
General Information
Standard status
Active
Size
3,069 SF
Property subtype
Multi-Family
Site & Location
Neighborhood
Straw/ Smyth
Building Details
Year Built
1930
Listing Agency:
BHHS Verani Londonderry
Listed By:
Betty Mak
(603) 548-6047
Source:
Lawanaandcompany
Added: Jul 23
Changed: Oct 25
Last Checked: Oct 7 at 3:02PM
Displayed information is deemed reliable but is not guaranteed and should be independently verified. All listing content including descriptions, pricing, images are the copyrighted material of BHHS Verani Londonderry

Ask AI about this property
Review the available facts, identify missing information and prepare questions for the agent.
Investment Insights
Based on property information with market context.
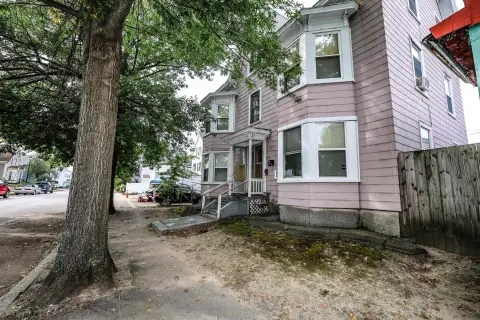
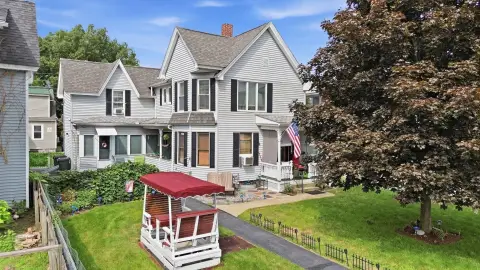
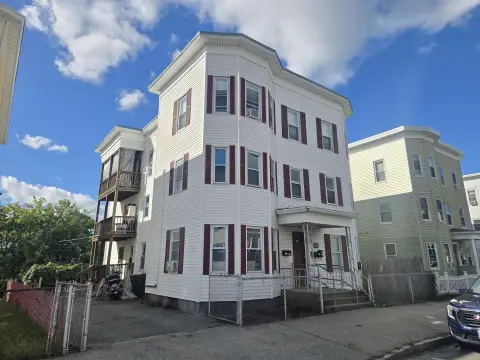
Located at 67 Pennacook Street in Manchester’s North End, this well-maintained multi-family offering combines two distinct buildings into one package. The main dwelling is set up as a two-way entry duplex, with two spacious units, each featuring 2 bedrooms, 1 full bath, and a wide, functional kitchen. Attached to the property is a second dwelling configured as an in-law suite or ADU, offering 2 bedrooms and 1.5 baths.
As of today, two of the three units are currently occupied by long-term tenants with 10+ years of tenure. The triplex is presented as delivering guaranteed rental income of $43,000+ annually. Recent upgrades include backyard fencing, brand-new gas boilers, and a new water heater.
Private showings begin 7/22/2026 (Wed.).
As of today, two of the three units are currently occupied by long-term tenants with 10+ years of tenure. The triplex is presented as delivering guaranteed rental income of $43,000+ annually. Recent upgrades include backyard fencing, brand-new gas boilers, and a new water heater.
Private showings begin 7/22/2026 (Wed.).
Key Highlights
- Three‑unit multi‑family in Manchester’s North End: two‑way entry duplex plus an attached 2‑bedroom ADU/in‑law unit.
- Duplex layout includes two units, each with 2 bedrooms and 1 full bath, plus wide, functional kitchens.
- Attached ADU offers 2 bedrooms and 1.5 baths for extended family use or additional rental income.
Financial Insights
Estimated NOI and Cap Rate
NOI / Yr
$41,415
Cap Rate
6.00%
Suggested Prices Based on Cap Rates
Cap Rate 5%
$828,300
$828.3K
Cap Rate 7%
$591,643
$591.6K
Cap Rate 9%
$460,167
$460.2K
Market Conditions
NOI Build-Up for 3,069 SF
Gross rent
$62.6K $20.40/SF
− Vacancy
−$3.4K −$1.12/SF
EGI
$59.2K $19.28/SF
− OpEx
−$17.7K −$5.78/SF
NOI
$41.4K $13.49/SF
Area
Manchester, NH
Vacancy
5.50%
Lease Rate
$20.40 /SF/Yr
Expense Ratio
30.00%
Simulate Cap Rate and NOI
Suggested Prices Based on Cap Rates
Cap Rate 5%
$828,300
Cap Rate 7%
$591,643
Cap Rate 9%
$460,167
Alternative Uses
Best Use
Multifamily LT 5
$591.6K
$517.7K – $690.3K
NOI $41,415 @ 7.0% cap · market cap 6.00%
Second Best
Apartment 5plus
$550.9K
$482.1K – $642.8K
NOI $38,566 @ 7.0% cap · market cap 5.59%
Theoretical Best
Specialty Retail
$753.7K
$659.5K – $879.3K
NOI $52,756 @ 7.0% cap · market cap 7.65%
Zoning and permitted uses should be independently verified with authorities.
How Realmo checks its estimates
Property Analytics
Who owns this building?
See the owner, sales and loan history
Open Analytics
Location Intelligence
Trade Area within ½ mile
2,337
Businesses Nearby
Explore this area
Business Placement
Demographics for 03104, NH
34,324
Population
15,715
Households
2.2
Avg Household Size
38
Median Age
43%
College-Educated
94%
High-School Grad
8.3 sq mi
ZIP Area
4,135
Density / Sq Mi
$84,513
Median Household Income
$48,513
Median Earnings
$1,455
Median Rent
$364,200
Median Home Value
Check the figures for this property
Cap Rate, Value Estimation, Potential NOI and more
View Realmo Analytics
Market
Vacancy Rate% for Multifamily in Northeast region






Frequently Asked Questions
What type of property is this?
Triplex - Three-unit property includes a two-way entry duplex plus an attached 2-bedroom accessory dwelling.
Where is this triplex located?
The property is located at 67 Pennacook St Manchester, NH.
What is the asking price?
The asking price for this property is $689,900.
What are key features of this property?
This property features: Three‑unit multi‑family in Manchester’s North End: two‑way entry duplex plus an attached 2‑bedroom ADU/in‑law unit.; Duplex layout includes two units, each with 2 bedrooms and 1 full bath, plus wide, functional kitchens.; Attached ADU offers 2 bedrooms and 1.5 baths for extended family use or additional rental income.


