Reinforced Concrete Barn on
For Sale
$1,279,000
6690 Pineland Road, Bokeelia, FL 33922
Land, Bokeelia, FL
Property Size6,000 SF
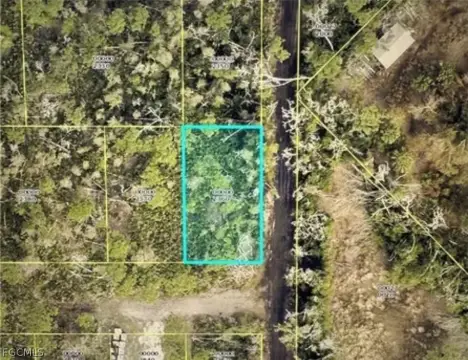
Lot Size3.96 Acres
Price / SF$213.17
Days on Market139
Property Features for 6690 Pineland Road
General Information
Property type
Land
Property subtype
Other
Zoning description
AG-2
Subdivision
PINELAND
Lot features
Irregular Lot, Oversized Lot, Acreage
Directions
Turn onto Pineland Rd, property is located on the right
Standard status
Active
APN
08-44-22-01-0000F.0010
Lot size
3.96 Acres
Taxes and HOA fees
Tax Year
2025
Tax Description
BEG AT NW COR SW 1/4 OF SE 1/4 OF NW 1/4 + POB TH GO S 45 DEG E 838 FT TH S 87
Tax Annual Amount
1533
Legal Description
BEG AT NW COR SW 1/4 OF SE 1/4 OF NW 1/4 + POB TH GO S 45 DEG E 838 FT TH S 87
Utilities
Water source
Well
Listing Agency:
Century 21 Sunbelt Realty · Century 21 Real Estate
(239) 283-1100
Listed By:
Brady Meier · License #258031337
(239) 425-7667
Added: May 26
Changed: Aug 27
Last Checked: Oct 11 at 8:06PM
MLS# 2026023455
Copyright © 2026 Florida Gulf Coast Multiple Listing Service, Inc. All rights reserved. All information provided by the listing agent/broker is deemed reliable but is not guaranteed and should be independently verified.
Investment Insights
Based on property information with market context.
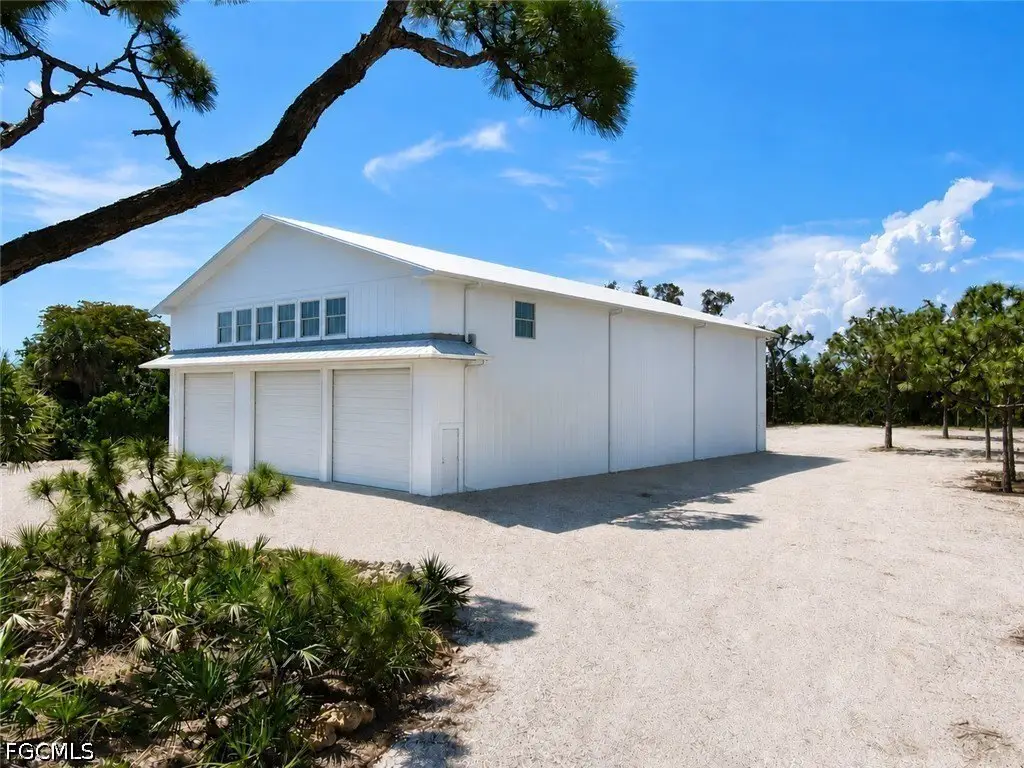
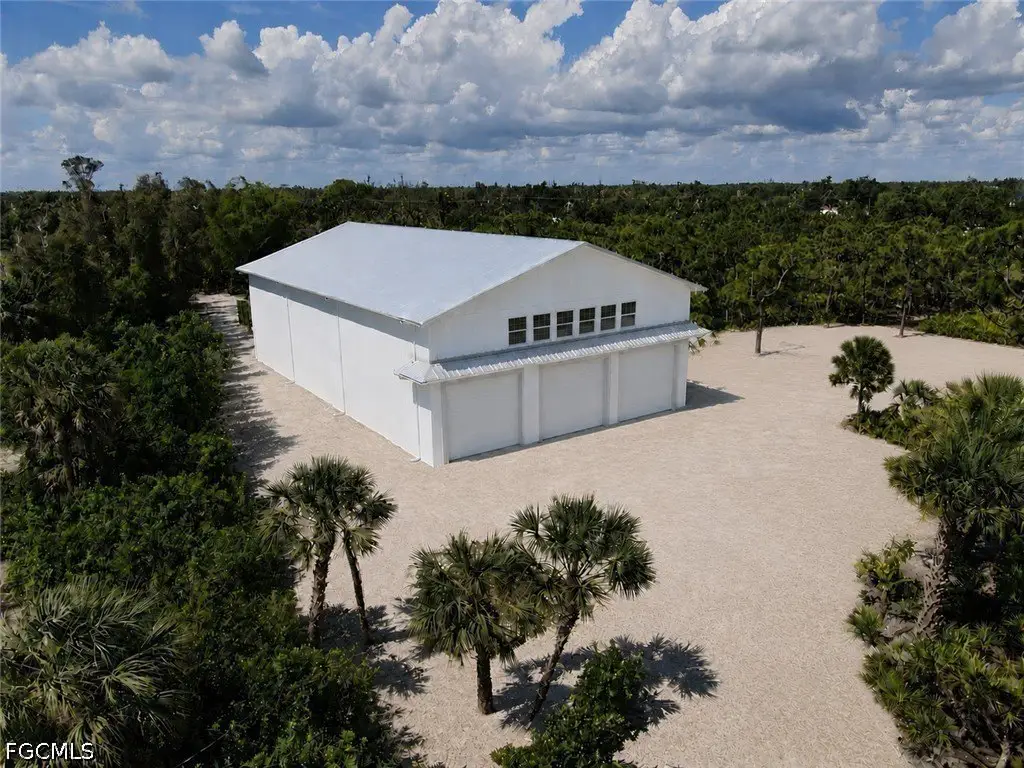
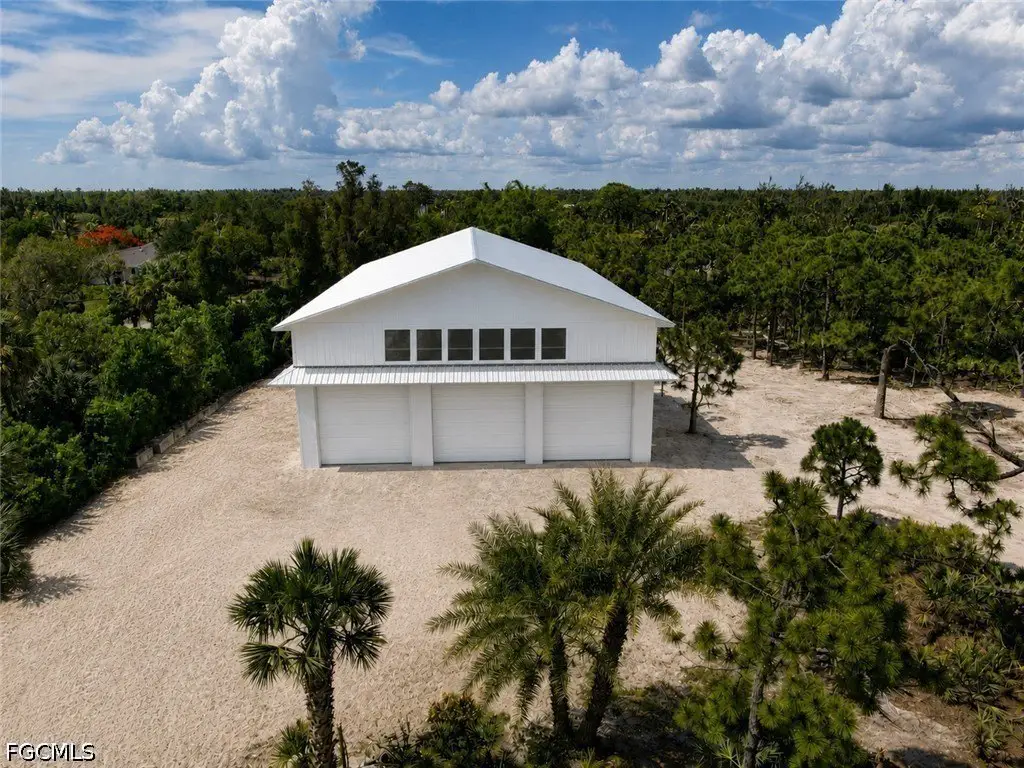
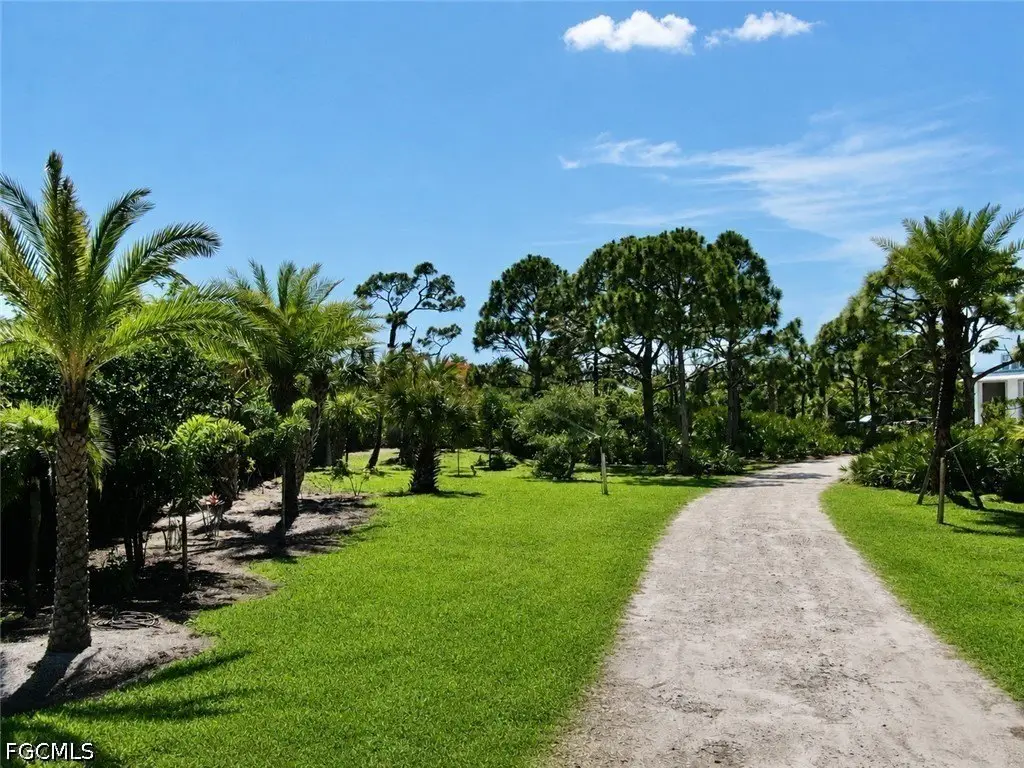
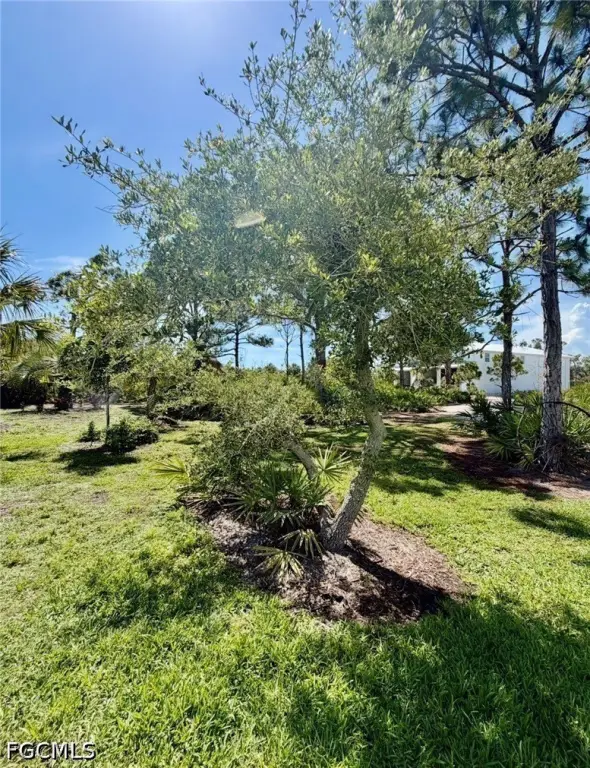
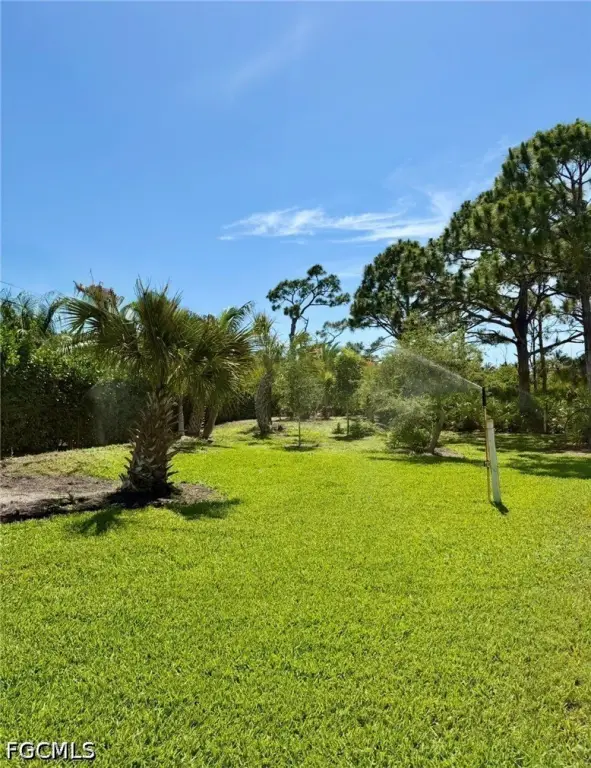
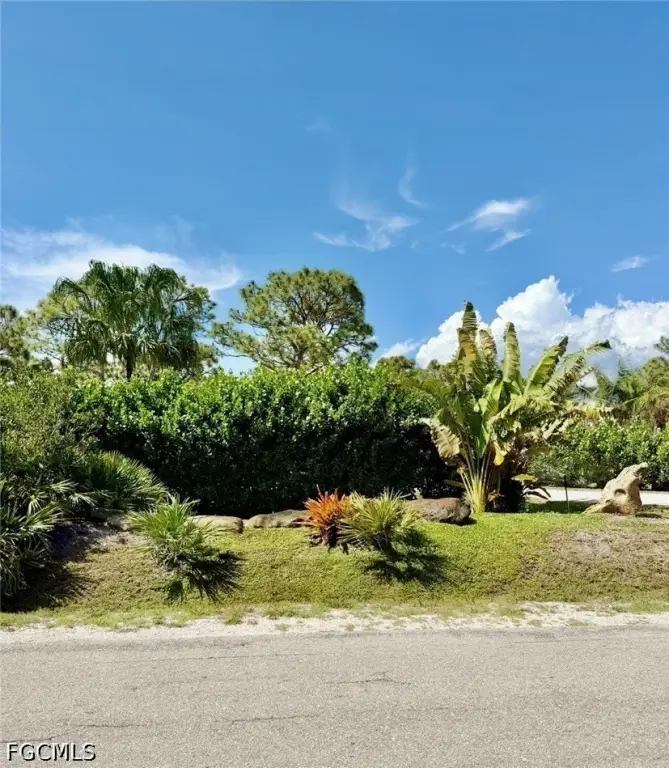
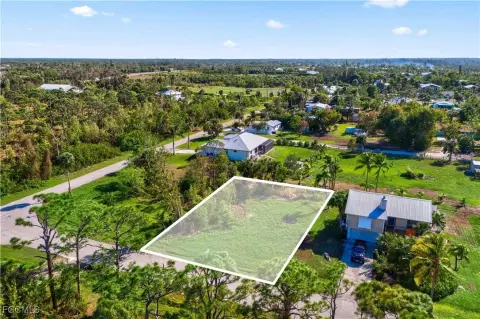
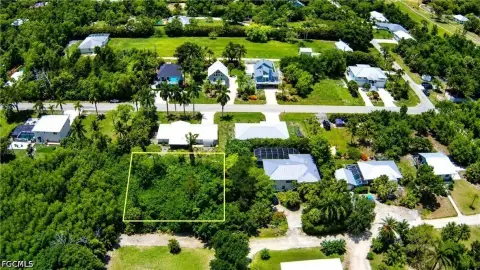
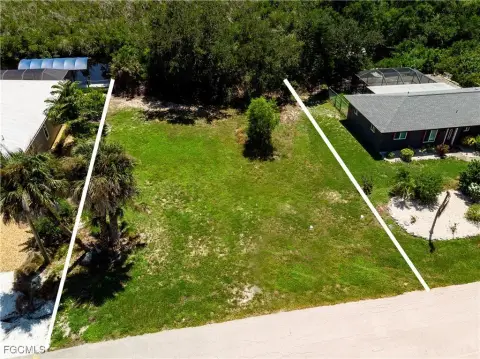
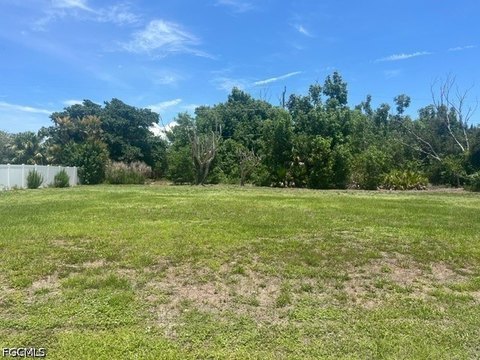
The property includes a reinforced concrete barn measuring 60 feet by 100 feet, topped with a durable metal roof. The barn is situated on an approximately 3.959-acre parcel and the site has been improved with a well plus irrigation installed. Additional work includes vegetation cleanup, loads of fill dirt brought in, and two culverts installed, along with professionally completed landscaping using low-maintenance plants and trees.
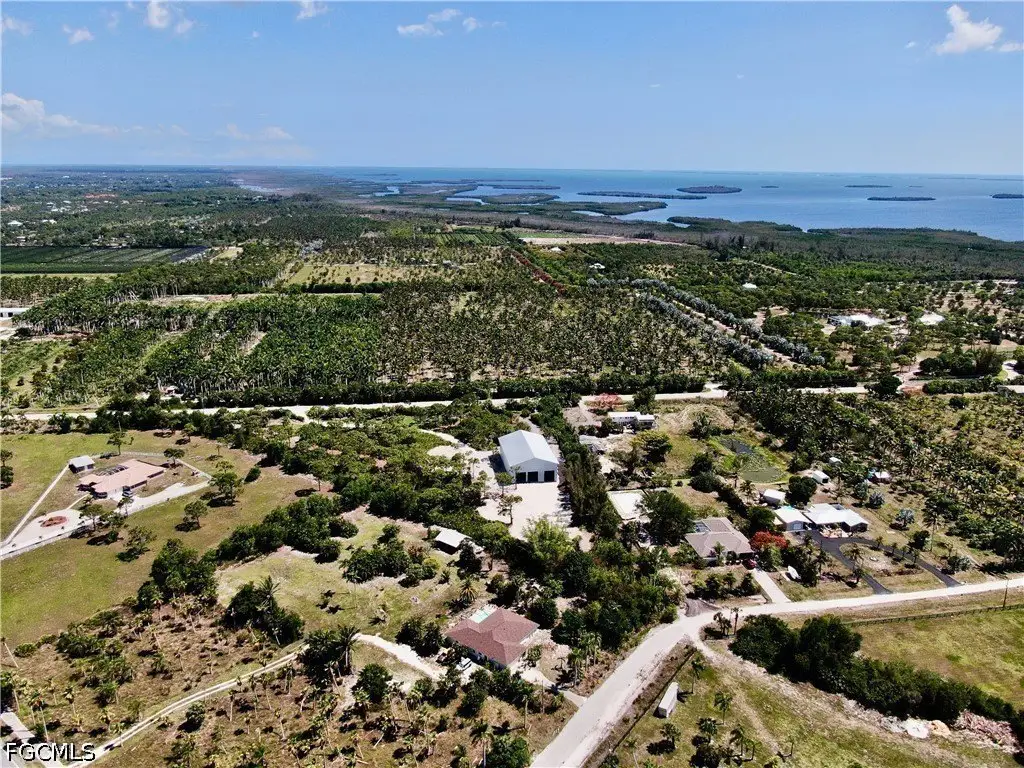
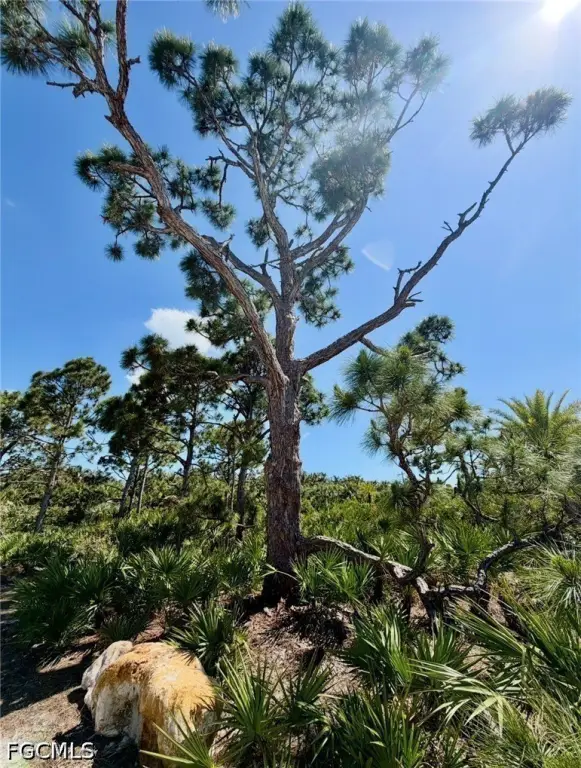
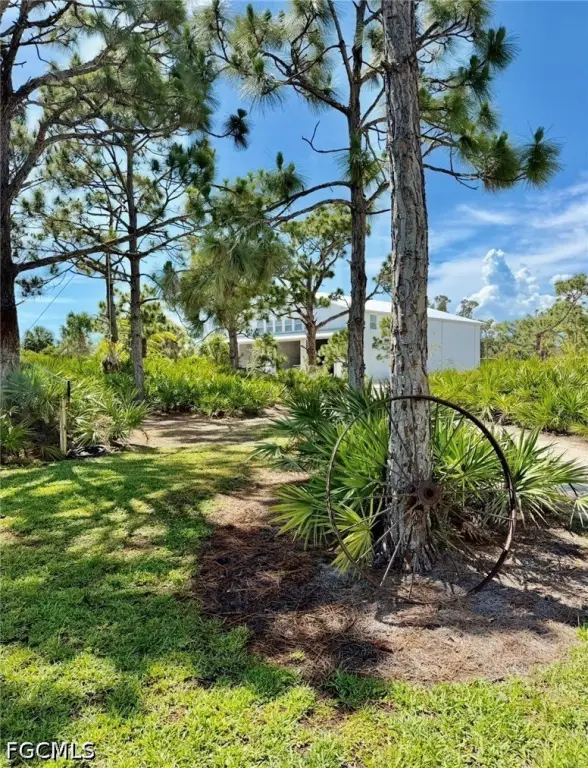
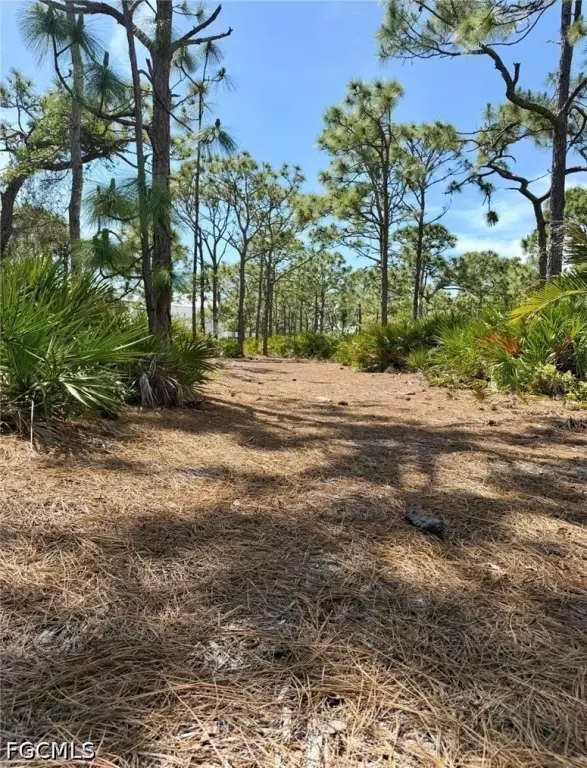
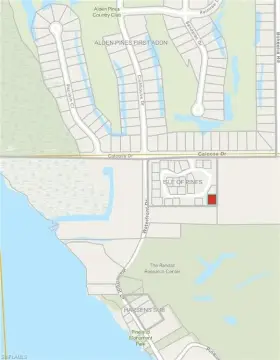
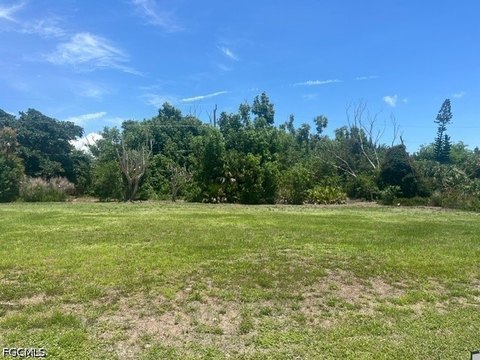
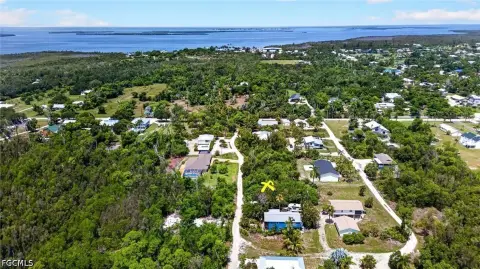
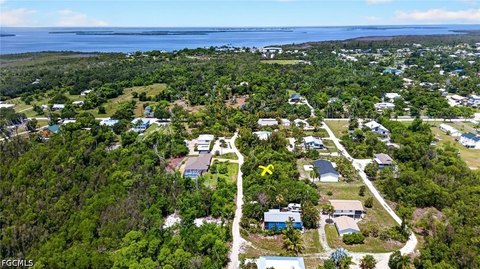
Located at 6690 Pineland Road in Bokeelia, Florida, the property is described as being surrounded by mature pine trees and native palmettos, offering a private setting. The public remarks note an option to add road access from the north side from Capri Ln, though that access area is currently overgrown. The area amenities mentioned include the Randell Research Center at the Calusa Indian mound preserve, the Alden Pines Golf Course, Safe Harbor Marina with ferries to the outer islands, and the Tarpon Lodge.
This offering may fit buyers looking for a sturdy, weather-tolerant structure on a larger land parcel for development or custom use, with site utilities and landscaping already addressed. The reinforced concrete construction and completed site improvements can help reduce upfront work when planning future expansion or building plans on the property.
Located at 6690 Pineland Road in Bokeelia, Florida, the property is described as being surrounded by mature pine trees and native palmettos, offering a private setting. The public remarks note an option to add road access from the north side from Capri Ln, though that access area is currently overgrown. The area amenities mentioned include the Randell Research Center at the Calusa Indian mound preserve, the Alden Pines Golf Course, Safe Harbor Marina with ferries to the outer islands, and the Tarpon Lodge.
This offering may fit buyers looking for a sturdy, weather-tolerant structure on a larger land parcel for development or custom use, with site utilities and landscaping already addressed. The reinforced concrete construction and completed site improvements can help reduce upfront work when planning future expansion or building plans on the property.
Key Highlights
- Reinforced concrete barn with metal roof on a 4‑acre landscaped parcel.
- Located in the desirable Pineland neighborhood of Bokeelia, Pine Island.
- Built to withstand severe weather and sits above the flood plain.
Property Analytics
Unlock full access to Insights
Subscribe to Realmo Intelligence
Open Analytics
Current Use
Location Intelligence
Trade Area within ½ mile
32
Businesses Nearby
Explore this area
Business Placement
Demographics for 33922, FL
4,326
Population
2,925
Households
1.5
Avg Household Size
59
Median Age
34%
College-Educated
87%
High-School Grad
20.9 sq mi
ZIP Area
207
Density / Sq Mi
$68,579
Median Household Income
$34,503
Median Earnings
$1,110
Median Rent
$330,100
Median Home Value
Check the figures for this property
Cap Rate, Value Estimation, Potential NOI and more
View Realmo Analytics

Questions? Ask Rey
Realmo’s AI knows this listing — price, zoning, demand, history. Ask anything.



Frequently Asked Questions
What type of property is this?
Residential land & home lot - Reinforced concrete barn on nearly four acres with metal roofing and planned site improvements on Pineland Road.
Where is this residential land & home lot located?
The property is located at 6690 Pineland Road Bokeelia, FL.
What is the asking price?
The asking price for this property is $1,279,000.
What are key features of this property?
This property features: Reinforced concrete barn with metal roof on a 4‑acre landscaped parcel.; Located in the desirable Pineland neighborhood of Bokeelia, Pine Island.; Built to withstand severe weather and sits above the flood plain.


