Live-Work Triplex with
6674 Fm 2767 Tyler, TX 75708
For Sale
$500,000
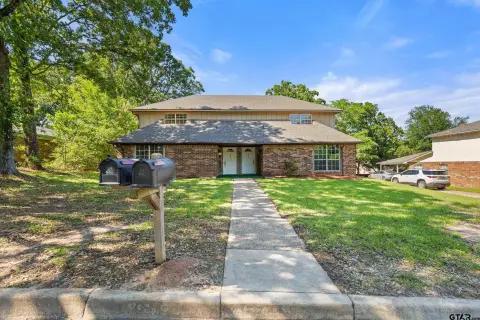
Renovated three-unit triplex includes tile finishes and utility room upgrades, plus an on-site commercial workshop building.
Property Size4,788 SF
Price / SF$104.43
Days on Market26
Property Features for 6674 Fm 2767
General Information
- Standard status
- Active
- Size
- 4,788 SF
Listing Agency:
ADT Realty Brokers
(903) 530-4171
Listed By:
Kyle Smith · License #0359850
(903) 530-4171
Source:
Exprealty
Added: Jul 1
Changed: Jul 24
Last Checked: Jul 25 at 6:01PM
Displayed information is deemed reliable but is not guaranteed and should be independently verified. All listing content including descriptions, pricing, images are the copyrighted material of ADT Realty Brokers
Investment Insights
Based on property information with market context.
This property combines a renovated three-unit triplex with an attached commercial workshop building. The triplex units have been recently remodeled with updated flooring, fresh paint, appliances, and tile surfaces designed for easier maintenance. Utility rooms have been added to two of the three units, and the third unit includes kitchen space that can accommodate a stackable setup.
The commercial building, formerly used for the owners business, offers features intended for hands-on work, including rolling track/lift support for heavier tasks and two oversized offices. The building also includes a bath with shower in one office and a half bath in the shop storage/parts area. A carport is also present, providing an additional option for utility room placement if desired.
With a mix of residential income units and flexible workshop space, the configuration supports multiple day-to-day layouts within one property footprint.
The commercial building, formerly used for the owners business, offers features intended for hands-on work, including rolling track/lift support for heavier tasks and two oversized offices. The building also includes a bath with shower in one office and a half bath in the shop storage/parts area. A carport is also present, providing an additional option for utility room placement if desired.
With a mix of residential income units and flexible workshop space, the configuration supports multiple day-to-day layouts within one property footprint.
Key Highlights
- Renovated three‑unit triplex with newly remodeled flooring, paint, and appliances in all three units
- Two of the three units include added utility rooms
- Tile surfaces throughout for easy maintenance and durability
Financial Insights For Multifamily LT 5
Simulate Cap Rate and NOI
NOI Build-Up
- Vacancy
- income lost from leasable area expected to sit empty during the year — subtracted from gross rent.
- EGI (Effective Gross Income)
- gross rent minus vacancy losses — the realistic income before paying operating costs.
- OpEx (Operating Expenses)
- recurring costs to operate the property (property tax, insurance, utilities, maintenance, management) — excludes financing and capital improvements.
- NOI (Net Operating Income)
- income a property generates after operating costs but before financing and taxes.
| Component | $ | $/SF |
|---|---|---|
| Gross rent | $66.1k | $13.80 |
| − Vacancy | −$4.3k | −$0.90 |
| EGI | $61.8k | $12.90 |
| − OpEx | −$18.5k | −$3.87 |
| NOI | $43.2k | $9.03 |
4,788 SF · lease $13.80/SF/yr · vacancy 6.50% · expense 30.00%
Alternative Uses
Best Use
Multifamily LT 5
$617.8K
$540.6K – $720.8K
NOI $43,246 @ 7.0% cap · market cap 8.65%
Second Best
Apartment 5plus
$579.0K
$506.6K – $675.5K
NOI $40,528 @ 7.0% cap · market cap 8.11%
Theoretical Best
Office A
$1.07M
$935.1K – $1.25M
NOI $74,806 @ 7.0% cap · market cap 14.96%
Zoning and permitted uses should be independently verified with local authorities.
Property Analytics
Location Intelligence
Current Use by Public Records
Diamond Core/Testco Inc
Oilfield



FAQs
What type of property is this?
Triplex - Renovated three-unit triplex includes tile finishes and utility room upgrades, plus an on-site commercial workshop building.
Where is this triplex located?
The property is located at 6674 Fm 2767 Tyler, TX.
What is the asking price?
The asking price for this property is $500,000.
What are key features of this property?
This property features: Renovated three‑unit triplex with newly remodeled flooring, paint, and appliances in all three units; Two of the three units include added utility rooms; Tile surfaces throughout for easy maintenance and durability