Office Warehouse Near
For Sale
$1,350,000
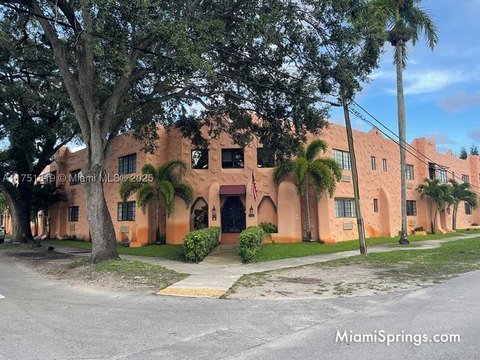
660 Miller Dr, Miami Springs, FL 33166
2,849 SF office warehouse with ample parking.
Property Size2,849 SF
Lot Size0.22 Acres
Price / SF$473.85
Days on Market344
Property Features for 660 Miller Dr
General Information
Standard status
Active
Size
2,849 SF
Lot size
0.22 Acres
Property subtype
Industrial
Taxes and HOA fees
Annual Taxes
$14,535
Building Details
Building Size
2,849 SF
Year Built
1950
Listing Agency:
The Keyes Company
Listed By:
Sonia Diaz · License #3245875
(305) 785-2687
Source:
Vanessafrankmiami
Added: Oct 30, 2025
Changed: Sep 29
Last Checked: Oct 7 at 3:40PM
Displayed information is deemed reliable but is not guaranteed and should be independently verified. All listing content including descriptions, pricing, images are the copyrighted material of The Keyes Company
Investment Insights
Based on property information with market context.
This 2,849 adjusted square foot office warehouse is situated on a 9,450 square foot lot. The structure includes 1,750 square feet of warehouse area and 1,100 square feet of office area. The property features three offices, three bathrooms, and a kitchen area. It is ADA compliant and equipped with full CCTV and access control. Ample front and rear parking is available. The warehouse has street and rear loading access. The property is located across from the airport and close to the SR 112 ramp, providing convenient access.
Key Highlights
- 2,849 SF Office Warehouse featuring 1,750 SF Warehouse and 1,100 SF Office.
- Ample front and rear parking available.
- Great location across from the airport and close to SR 112 ramp.
Financial Insights
Estimated NOI and Cap Rate
NOI / Yr
$62,667
Cap Rate
4.64%
Suggested Prices Based on Cap Rates
Cap Rate 5%
$1,253,340
$1.3M
Cap Rate 7%
$895,243
$895.2K
Cap Rate 9%
$696,300
$696.3K
Market Conditions
NOI Build-Up for 2,849 SF
Gross rent
$102.6K $36.00/SF
− Vacancy
−$6.2K −$2.16/SF
EGI
$96.4K $33.84/SF
− OpEx
−$33.7K −$11.84/SF
NOI
$62.7K $22.00/SF
Area
Miami-Dade County, FL
Vacancy
6.00%
Lease Rate
$36.00 /SF/Yr
Expense Ratio
35.00%
Simulate Cap Rate and NOI
Suggested Prices Based on Cap Rates
Cap Rate 5%
$1,253,340
Cap Rate 7%
$895,243
Cap Rate 9%
$696,300
Alternative Uses
Best Use
Flex RnD
$895.2K
$783.3K – $1.04M
NOI $62,667 @ 7.0% cap · market cap 4.64%
Second Best
Warehouse
$533.5K
$466.9K – $622.5K
NOI $37,348 @ 7.0% cap · market cap 2.77%
Theoretical Best
Office A
$1.45M
$1.26M – $1.69M
NOI $101,179 @ 7.0% cap · market cap 7.49%
Zoning and permitted uses should be independently verified with authorities.
Property Analytics
Unlock full access to Insights
Subscribe to Realmo Intelligence
Open Analytics
Current Use
Location Intelligence
Trade Area within ½ mile
867
Businesses Nearby
Balanced
Demand for This Use
Explore this area
Business Placement
Demographics for 33166, FL
26,106
Population
10,838
Households
2.4
Avg Household Size
41
Median Age
42%
College-Educated
83%
High-School Grad
7.9 sq mi
ZIP Area
3,305
Density / Sq Mi
$78,166
Median Household Income
$39,744
Median Earnings
$1,766
Median Rent
$489,200
Median Home Value
Check the figures for this property
Cap Rate, Value Estimation, Potential NOI and more
View Realmo Analytics
Market
Vacancy Rate% for Industrial in South region

Questions? Ask Rey
Realmo’s AI knows this listing — price, zoning, demand, history. Ask anything.




Similar Off Market Nearby
- Miami Sandwich and Salad — 3750 NW 28th St #415, Miami, FL 33142
- Mobile Bar Miami — 751 SE Park Dr apt 203, Hialeah, FL 33010
- Air Catering International — 455 E Okeechobee Rd, Hialeah, FL 33010
- Bar Solution Services — 3745 NW 50th St Unit A, Miami, FL 33142
Frequently Asked Questions
What type of property is this?
Flex space - 2,849 SF office warehouse with ample parking.
Where is this flex space located?
The property is located at 660 Miller Dr Miami Springs, FL.
What is the asking price?
The asking price for this property is $1,350,000.
What are key features of this property?
This property features: 2,849 SF Office Warehouse featuring 1,750 SF Warehouse and 1,100 SF Office.; Ample front and rear parking available.; Great location across from the airport and close to SR 112 ramp.



