Industrial Warehouse with Roll-Up
For Sale
Contact for pricing
6553 Lakes Industrial Pkwy, Lake Park, GA 31636
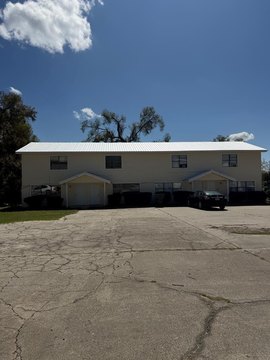
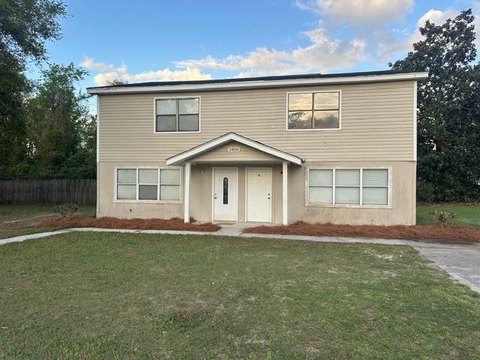
Industrial space includes an office, restroom, and direct interstate access via I-75.
Property Size6,250 SF
Price / SF$93.76
Days on Market227

Ask AI about this property
Review the available facts, identify missing information and prepare questions for the agent.
Property Features for 6553 Lakes Industrial Pkwy
General Information
Standard status
Active
Size
6,250 SF
Property subtype
Industrial
Listing Agency:
Bird Commercial Real Estate
Listed By:
Frank Bo Bird IV · License #GA 391091
Source:
Crexi
Added: Mar 2
Changed: Oct 14
Last Checked: Oct 14 at 9:36PM
Displayed information is deemed reliable but is not guaranteed and should be independently verified. All listing content including descriptions, pricing, images are the copyrighted material of Bird Commercial Real Estate
Investment Insights
Based on property information with market context.
The industrial warehouse at 6553 Lakes Industrial Pkwy in Lake Park, Georgia, contains 6,250 SF on 1.0 usable acre. The building includes two 14-foot roll-up doors, an office, and a restroom, with a 16-foot eave height. Building systems include a standing seam metal roof, 3-phase 400-amp power, municipal water and sewer, and natural gas availability. The structure is also plumbed for an air compressor.
Access to I-75 is available via Exit 2, supporting regional and interstate connectivity. The property is directly adjacent to a Home Depot distribution center. An additional 1-acre lot owned by the Development Authority can be made available as well.
Access to I-75 is available via Exit 2, supporting regional and interstate connectivity. The property is directly adjacent to a Home Depot distribution center. An additional 1-acre lot owned by the Development Authority can be made available as well.
Key Highlights
- 6,250 SF industrial building on 1.0 usable acre
- Two 14‑foot roll‑up doors and 16‑foot eave height
- 3‑phase 400‑amp power with natural gas availability
Financial Insights
Estimated NOI and Cap Rate
NOI / Yr
$36,837
Cap Rate
6.29%
Suggested Prices Based on Cap Rates
Cap Rate 5%
$736,740
$736.7K
Cap Rate 7%
$526,243
$526.2K
Cap Rate 9%
$409,300
$409.3K
Market Conditions
NOI Build-Up for 6,250 SF
Gross rent
$46.5K $7.44/SF
− Vacancy
−$3.2K −$0.51/SF
EGI
$43.3K $6.93/SF
− OpEx
−$6.5K −$1.04/SF
NOI
$36.8K $5.89/SF
Area
Lowndes County, GA
Vacancy
6.80%
Lease Rate
$7.44 /SF/Yr
Expense Ratio
15.00%
Simulate Cap Rate and NOI
Suggested Prices Based on Cap Rates
Cap Rate 5%
$736,740
Cap Rate 7%
$526,243
Cap Rate 9%
$409,300
Alternative Uses
Best Use
Warehouse
$526.2K
$460.5K – $614.0K
NOI $36,837 @ 7.0% cap · market cap 6.29%
Second Best
—
—
no second resolved use
Theoretical Best
Office A
$948.9K
$830.3K – $1.11M
NOI $66,420 @ 7.0% cap · market cap 11.33%
Zoning and permitted uses should be independently verified with authorities.
How Realmo checks its estimates
Property Analytics
Unlock full access to Insights
Subscribe to Realmo Intelligence
Open Analytics
Current Use
Location Intelligence
Trade Area within ½ mile
6
Businesses Nearby
Well-served
Demand for This Use
Explore this area
Business Placement
Demographics for 31636, GA
10,136
Population
4,989
Households
2
Avg Household Size
39
Median Age
18%
College-Educated
92%
High-School Grad
185.8 sq mi
ZIP Area
55
Density / Sq Mi
$64,340
Median Household Income
$37,348
Median Earnings
$814
Median Rent
$204,200
Median Home Value
Check the figures for this property
Cap Rate, Value Estimation, Potential NOI and more
View Realmo Analytics
Market
Vacancy Rate% for Industrial in South region


Frequently Asked Questions
What type of property is this?
Warehouse - Industrial space includes an office, restroom, and direct interstate access via I-75.
Where is this warehouse located?
The property is located at 6553 Lakes Industrial Pkwy Lake Park, GA.
What is the asking price?
The asking price for this property is $586,000.
What are key features of this property?
This property features: 6,250 SF industrial building on 1.0 usable acre; Two 14‑foot roll‑up doors and 16‑foot eave height; 3‑phase 400‑amp power with natural gas availability


