Renovated Two-Unit
For Sale
$1,890,000
652 Belmont Street, Watertown, MA 02472
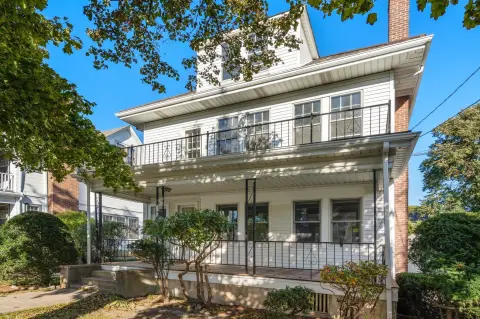
Historic character pairs with updated kitchens, baths, in-unit laundry, basement storage, and private outdoor space.
Property Size3,137 SF
Price / SF$602.49
Days on Market183
Property Features for 652 Belmont Street
General Information
Standard status
Active
Size
3,137 SF
Total Parking Spaces
4
Property subtype
Multi-Family
Zoning
T
Units
Unit Mix
2 x 3BR/2BA
Multifamily Units
2
Additional Details
Public Transit
Yes
Amenities
private patio
basement storage
in-unit laundry
Central Air, Individual, Unit Control
Forced Air, Natural Gas, Individual, Unit Control
Electric Dryer Hookup, Washer Hookup
Tile, Hardwood
Range, Dishwasher, Disposal, Microwave, Refrigerator
2
Other, Living Room, Kitchen, Laundry Room, Loft, Office/Den
No
Shingle
Rain Gutters
Public Transportation, Shopping, Pool, Tennis Court(s), Park, Walk/Jog Trails, Golf, Medical Facility, Laundromat, Bike Path, Highway Access, House of Worship, Private School, Public School, University, Other
for Gas Range, for Electric Dryer, Washer Hookup
4
Building Details
Building Size
3,137 SF
Year Built
1900
Stories
2
Listing Agency:
eXp Realty
Listed By:
The Denman Group
(617) 702-4842
Source:
Reishomesearch
Added: Apr 15
Changed: Aug 29
Last Checked: Apr 22 at 11:01AM
Displayed information is deemed reliable but is not guaranteed and should be independently verified. All listing content including descriptions, pricing, images are the copyrighted material of eXp Realty
Investment Insights
Based on property information with market context.
This 3,137-square-foot duplex, built in 1900, contains two three-bedroom, two-bath units. The interiors combine preserved architectural details—including coffered ceilings, oak hardwood floors, wainscoting, crown molding, and ceiling medallions—with extensive modern updates. Each residence features an eat-in kitchen with GE stainless appliances, white shaker cabinetry, gold hardware, and marble subway tile. Brand-new bathrooms include primary suites with private en-suites and walk-in showers. A wood-burning fireplace adds a traditional focal point, while in-unit laundry, basement storage, a driveway, and a private patio complete the property’s practical features.
The property is positioned on the Belmont-Watertown line, with Arsenal Yards nearby and MBTA bus service connecting to Cambridge and Boston. Its two-unit configuration and substantial unit layouts provide a clear multifamily format with updated residential finishes and retained historic character.
The property is positioned on the Belmont-Watertown line, with Arsenal Yards nearby and MBTA bus service connecting to Cambridge and Boston. Its two-unit configuration and substantial unit layouts provide a clear multifamily format with updated residential finishes and retained historic character.
Key Highlights
- Two‑unit duplex with 3‑bed, 2‑bath layouts in each unit
- 3,137 square feet; built in 1900
- Updated eat‑in kitchens with GE stainless appliances and marble subway tile
Financial Insights
Estimated NOI and Cap Rate
NOI / Yr
$66,380
Cap Rate
3.51%
Suggested Prices Based on Cap Rates
Cap Rate 5%
$1,327,600
$1.3M
Cap Rate 7%
$948,286
$948.3K
Cap Rate 9%
$737,556
$737.6K
Market Conditions
NOI Build-Up for 3,137 SF
Gross rent
$99.8K $31.80/SF
− Vacancy
−$4.9K −$1.57/SF
EGI
$94.8K $30.23/SF
− OpEx
−$28.4K −$9.07/SF
NOI
$66.4K $21.16/SF
Area
Middlesex County, MA
Vacancy
4.94%
Lease Rate
$31.80 /SF/Yr
Expense Ratio
30.00%
Simulate Cap Rate and NOI
Suggested Prices Based on Cap Rates
Cap Rate 5%
$1,327,600
Cap Rate 7%
$948,286
Cap Rate 9%
$737,556
Alternative Uses
Best Use
Multifamily LT 5
$948.3K
$829.8K – $1.11M
NOI $66,380 @ 7.0% cap · market cap 3.51%
Second Best
Apartment 5plus
$891.7K
$780.2K – $1.04M
NOI $62,416 @ 7.0% cap · market cap 3.30%
Theoretical Best
Office A
$1.86M
$1.62M – $2.17M
NOI $129,996 @ 7.0% cap · market cap 6.88%
Zoning and permitted uses should be independently verified with authorities.
How Realmo checks its estimates
Property Analytics
Unlock full access to Insights
Subscribe to Realmo Intelligence
Open Analytics
Current Use
Lease Details
2
Residential units
Location Intelligence
Trade Area within ½ mile
799
Businesses Nearby
Explore this area
Business Placement
Demographics for 02472, MA
35,392
Population
17,069
Households
2.1
Avg Household Size
39
Median Age
67%
College-Educated
95%
High-School Grad
4.0 sq mi
ZIP Area
8,848
Density / Sq Mi
$123,383
Median Household Income
$77,537
Median Earnings
$2,356
Median Rent
$737,600
Median Home Value
Check the figures for this property
Cap Rate, Value Estimation, Potential NOI and more
View Realmo Analytics
Market
Vacancy Rate% for Multifamily in Northeast region

Questions? Ask Rey
Realmo’s AI knows this listing — price, zoning, demand, history. Ask anything.



Frequently Asked Questions
What type of property is this?
Duplex - Historic character pairs with updated kitchens, baths, in-unit laundry, basement storage, and private outdoor space.
Where is this duplex located?
The property is located at 652 Belmont Street Watertown, MA.
What is the asking price?
The asking price for this property is $1,890,000.
What are key features of this property?
This property features: Two‑unit duplex with 3‑bed, 2‑bath layouts in each unit; 3,137 square feet; built in 1900; Updated eat‑in kitchens with GE stainless appliances and marble subway tile


