Multi-Tenant Medical Office
For Sale
$2,250,000
650 -660 Rio Lindo Ave, Chico, CA 95926
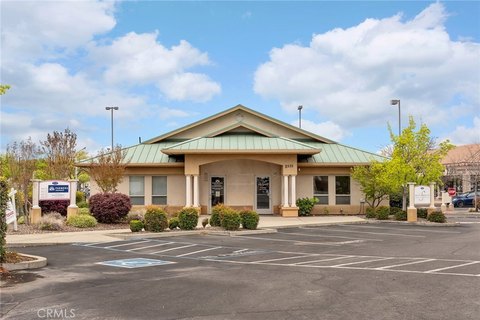
Two single-story buildings offer separately parceled medical office suites with dedicated parking and current full occupancy.
Property Size12,742 SF
Lot Size1.50 Acres
Price / SF$176.58
Days on Market48
Property Features for 650 -660 Rio Lindo Ave
General Information
Standard status
Active
Size
12,742 SF
Lot size
1.50 Acres
Property subtype
Office Medical
Occupancy
100%
Additional Details
Cap Rate
7%
Highway Access
Yes
Office Units
6
Amenities
12,742 Total Square-Feet Multi-Tenant Medical Office Buildings
100% Occupied With Diversified Tenant Mix
Low 3% Market Vacancy | Supply Constrained Market Supporting Long- Term Occupancy
Less Than 2 Miles From Enloe Medical Center| 300+ Bed Regional Hospital
Excellent Visibility and Accessibility From Rio Lindo Ave | Convenient Access to Highway 99
Building Details
Building Size
12,742 SF
Year Built
1993
Buildings
2
Stories
1
Tenancy
Multi
Listed By:
Ryan Gonzales · License #License(s): CA: 01109934, NV: BS.0146068
(858) 373-3127
Source:
Marcusmillichap
Added: Aug 20
Changed: Sep 14
Last Checked: Oct 5 at 3:11PM
Displayed information is deemed reliable but is not guaranteed and should be independently verified. All listing content including descriptions, pricing, images are the copyrighted material of Ryan Gonzales
Investment Insights
Based on property information with market context.
This medical office portfolio includes two single-story buildings totaling 12,742 gross square feet on approximately 1.50 acres. Built in 1993, the property contains six suites across the two structures: four at 650 Rio Lindo Ave and two at 660 Rio Lindo Ave. Each building occupies its own parcel and has a dedicated parking lot. The portfolio is currently 100% leased and may be acquired together or as separate buildings.
The property is located in Chico’s medical corridor, less than two miles from Enloe Medical Center, a regional hospital with more than 300 beds. Access to Highway 99 and other major arterial roadways supports convenient travel for patients and staff. Ample on-site parking and direct access to primary thoroughfares further support day-to-day medical office operations.
The property is located in Chico’s medical corridor, less than two miles from Enloe Medical Center, a regional hospital with more than 300 beds. Access to Highway 99 and other major arterial roadways supports convenient travel for patients and staff. Ample on-site parking and direct access to primary thoroughfares further support day-to-day medical office operations.
Key Highlights
- 12,742 gross square feet across two medical office buildings
- Six suites total: four at 650 Rio Lindo Ave and two at 660 Rio Lindo Ave
- Approximately 1.50 acres with each building on its own parcel
Financial Insights
Estimated NOI and Cap Rate
NOI / Yr
$148,164
Cap Rate
6.59%
Suggested Prices Based on Cap Rates
Cap Rate 5%
$2,963,280
$3.0M
Cap Rate 7%
$2,116,629
$2.1M
Cap Rate 9%
$1,646,267
$1.6M
Market Conditions
NOI Build-Up for 12,742 SF
Gross rent
$259.9K $20.40/SF
− Vacancy
−$13.0K −$1.02/SF
EGI
$246.9K $19.38/SF
− OpEx
−$98.8K −$7.75/SF
NOI
$148.2K $11.63/SF
Area
Chico, CA
Vacancy
5.00%
Lease Rate
$20.40 /SF/Yr
Expense Ratio
40.00%
Simulate Cap Rate and NOI
Suggested Prices Based on Cap Rates
Cap Rate 5%
$2,963,280
Cap Rate 7%
$2,116,629
Cap Rate 9%
$1,646,267
Alternative Uses
Best Use
Healthcare Medical
$2.12M
$1.85M – $2.47M
NOI $148,164 @ 7.0% cap · market cap 6.59%
Second Best
Office B
$1.93M
$1.69M – $2.25M
NOI $134,848 @ 7.0% cap · market cap 5.99%
Theoretical Best
Office A
$2.57M
$2.25M – $3.00M
NOI $180,089 @ 7.0% cap · market cap 8.00%
Zoning and permitted uses should be independently verified with authorities.
Property Analytics
Unlock full access to Insights
Subscribe to Realmo Intelligence
Open Analytics
Current Use
Lease Details
6
Office units
Multi-tenant
Tenancy
Yes
Highway access
Location Intelligence
Trade Area within ½ mile
2,275
Businesses Nearby
Balanced
Demand for This Use
Explore this area
Business Placement
Demographics for 95926, CA
41,259
Population
18,566
Households
2.2
Avg Household Size
31
Median Age
45%
College-Educated
96%
High-School Grad
7.8 sq mi
ZIP Area
5,290
Density / Sq Mi
$62,334
Median Household Income
$27,870
Median Earnings
$1,418
Median Rent
$462,900
Median Home Value
Check the figures for this property
Cap Rate, Value Estimation, Potential NOI and more
View Realmo Analytics
Market
Vacancy Rate% for Office in West region

Questions? Ask Rey
Realmo’s AI knows this listing — price, zoning, demand, history. Ask anything.




Similar Off Market Nearby
- Riverwood Veterinary Hospital — 1900 Mangrove Ave #50, Chico, CA 95926
- Vietnam Vets — Chico, CA 95926
- PawPrints Spay/Neuter Clinic — 2607 Esplanade, Chico, CA 95973
- PetSites — 2607 Esplanade, Chico, CA 95973
- Chico Pet Vet — 2156 Pillsbury Rd, Chico, CA 95926
Frequently Asked Questions
What type of property is this?
Medical Office Space - Two single-story buildings offer separately parceled medical office suites with dedicated parking and current full occupancy.
Where is this medical office space located?
The property is located at 650 -660 Rio Lindo Ave Chico, CA.
What is the asking price?
The asking price for this property is $2,250,000.
What are key features of this property?
This property features: 12,742 gross square feet across two medical office buildings; Six suites total: four at 650 Rio Lindo Ave and two at 660 Rio Lindo Ave; Approximately 1.50 acres with each building on its own parcel



