Two-Unit Duplex with
For Sale
$749,000
Pending
65 Roosevelt, Stamford, CT 06902
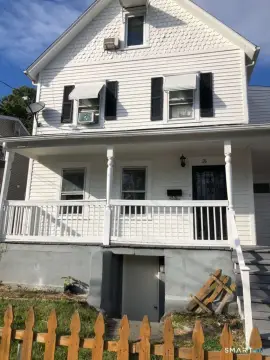
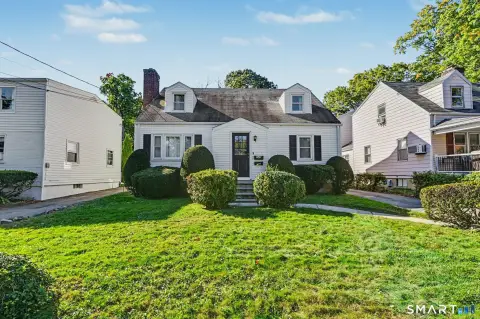
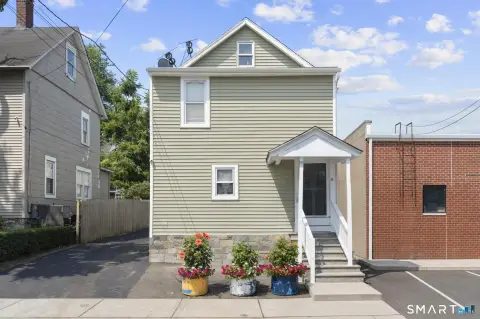
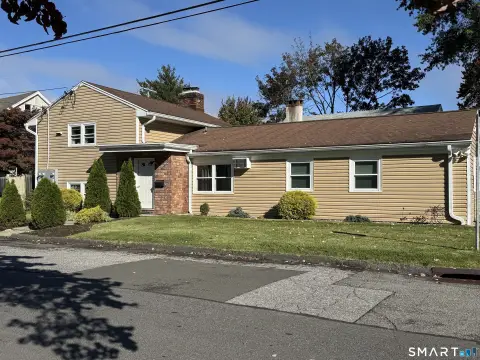
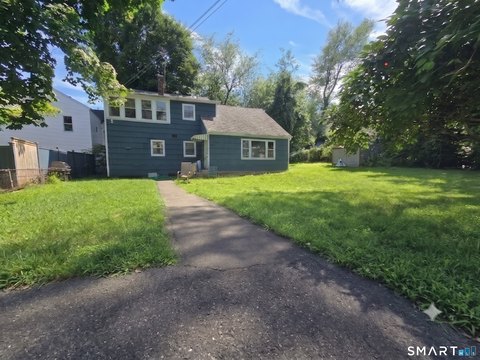
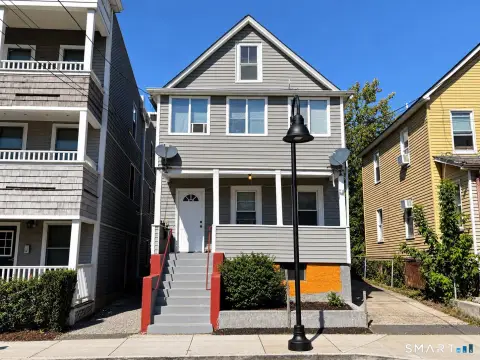
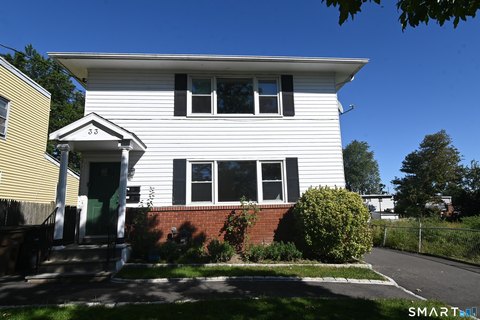
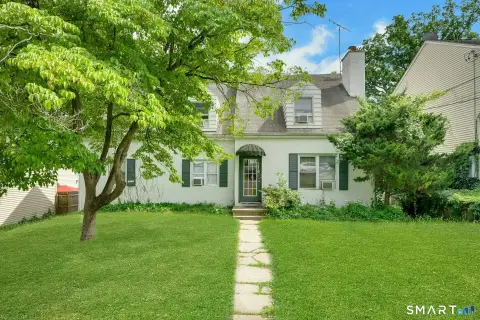
Two separately entered residences feature eat-in kitchens, covered decks, private rear-yard access, and off-street parking.
Property Size1,952 SF
Days on Market49
Property Features for 65 Roosevelt
General Information
Standard status
Pending
Size
1,952 SF
Property subtype
2 Family
Lease Term
Listing ID: 24205120, Standard Status: Active Under Contract, MLS Status: Under Contract - Continue to Show, Property Subtype: 2 Family, 46 days on market
Site & Location
Public Transit
Yes
Utilities to Site
Yes
Units
Unit Mix
2 x 2BR/1BA
Multifamily Units
2
Amenities
covered decks
carport
Building Details
Building Size
1,952 SF
Year Built
1952
Listing Agency:
William Pitt Sotheby's Int'l
(203) 968-1500
Listed By:
Barbara Hickey · License #RES.0764883
(203) 912-0578
Source:
Iverty
Added: Sep 8
Changed: Oct 25
Last Checked: Oct 24 at 5:41PM
Displayed information is deemed reliable but is not guaranteed and should be independently verified. All listing content including descriptions, pricing, images are the copyrighted material of William Pitt Sotheby's Int'l

Ask AI about this property
Review the available facts, identify missing information and prepare questions for the agent.
Investment Insights
Based on property information with market context.
This 1952 duplex contains two two-bedroom, one-bath residences, each with its own front and rear entry. Both units offer spacious living rooms, eat-in kitchens, and kitchen access to covered decks leading toward the level rear yard. The first-floor unit includes a gas stove connection, while the second-floor unit has been occupied by the same tenant for 30+ years.
A full basement is accessed through a hatchway door. Building systems include baseboard and radiator heat served by one oil-fired boiler with two zones, one hot water heater, and two electrical meters. A gas line serves the first-floor unit. The property also includes a long rear driveway, carport, and off-street parking. Located at 65 Roosevelt Ave in Stamford, the property has a 96 Walk Score, 75 Bike Score, and 73 Transit Score.
A full basement is accessed through a hatchway door. Building systems include baseboard and radiator heat served by one oil-fired boiler with two zones, one hot water heater, and two electrical meters. A gas line serves the first-floor unit. The property also includes a long rear driveway, carport, and off-street parking. Located at 65 Roosevelt Ave in Stamford, the property has a 96 Walk Score, 75 Bike Score, and 73 Transit Score.
Key Highlights
- Two‑unit layout with two bedrooms and one bath in each residence
- Front and rear entrances serve both units
- Covered decks connect to the kitchens and lead toward a level rear yard
Financial Insights
Estimated NOI and Cap Rate
NOI / Yr
$37,946
Cap Rate
5.07%
Suggested Prices Based on Cap Rates
Cap Rate 5%
$758,920
$758.9K
Cap Rate 7%
$542,086
$542.1K
Cap Rate 9%
$421,622
$421.6K
Market Conditions
NOI Build-Up for 1,972 SF
Gross rent
$58.0K $29.40/SF
− Vacancy
−$3.8K −$1.91/SF
EGI
$54.2K $27.49/SF
− OpEx
−$16.3K −$8.25/SF
NOI
$37.9K $19.24/SF
Area
Stamford, CT
Vacancy
6.50%
Lease Rate
$29.40 /SF/Yr
Expense Ratio
30.00%
Simulate Cap Rate and NOI
Suggested Prices Based on Cap Rates
Cap Rate 5%
$758,920
Cap Rate 7%
$542,086
Cap Rate 9%
$421,622
Alternative Uses
Best Use
Multifamily LT 5
$542.1K
$474.3K – $632.4K
NOI $37,946 @ 7.0% cap · market cap 5.07%
Second Best
Apartment 5plus
$484.8K
$424.2K – $565.7K
NOI $33,939 @ 7.0% cap · market cap 4.53%
Theoretical Best
Office A
$713.0K
$623.9K – $831.9K
NOI $49,912 @ 7.0% cap · market cap 6.66%
Zoning and permitted uses should be independently verified with authorities.
How Realmo checks its estimates
Property Analytics
Unlock full access to Insights
Subscribe to Realmo Intelligence
Open Analytics
Lease Details
2
Residential units
Yes
Utilities to site
Location Intelligence
Trade Area within ½ mile
2,041
Businesses Nearby
Explore this area
Business Placement
Demographics for 06902, CT
69,192
Population
30,142
Households
2.3
Avg Household Size
36
Median Age
44%
College-Educated
85%
High-School Grad
10.0 sq mi
ZIP Area
6,919
Density / Sq Mi
$92,527
Median Household Income
$48,285
Median Earnings
$2,139
Median Rent
$515,000
Median Home Value
Check the figures for this property
Cap Rate, Value Estimation, Potential NOI and more
View Realmo Analytics
Market
Vacancy Rate% for Multifamily in Northeast region




Frequently Asked Questions
What type of property is this?
Duplex - Two separately entered residences feature eat-in kitchens, covered decks, private rear-yard access, and off-street parking.
Where is this duplex located?
The property is located at 65 Roosevelt Stamford, CT.
What is the asking price?
The asking price for this property is $749,000.
What are key features of this property?
This property features: Two‑unit layout with two bedrooms and one bath in each residence; Front and rear entrances serve both units; Covered decks connect to the kitchens and lead toward a level rear yard



