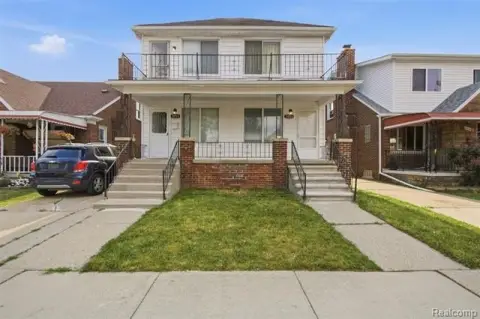
Brick Duplex with Detached
For Sale
$299,900
6406-6408 Mead St, Dearborn, MI 48126
Vacant brick duplex with separate utilities, laundry areas, and recent mechanical and interior updates.
Property Size1,817 SF
Price / SF$165.05
Days on Market48
Property Features for 6406-6408 Mead St
General Information
Standard status
Active
Size
1,817 SF
Total Parking Spaces
2
Property subtype
Multi-Family
Additional Details
Utilities to Site
Yes
Multifamily Units
2
Building Details
Year Built
1929
Construction
brick
Listing Agency:
Rch Brokerage Legacy Inc
(248) 440-2268
Listed By:
In Network Real Estate Group
(248) 655-7955
Source:
Innetworkrealestate
Added: Aug 30
Changed: Oct 15
Last Checked: Oct 14 at 11:08PM
Displayed information is deemed reliable but is not guaranteed and should be independently verified. All listing content including descriptions, pricing, images are the copyrighted material of Rch Brokerage Legacy Inc

Ask AI about this property
Review the available facts, identify missing information and prepare questions for the agent.
Investment Insights
Based on property information with market context.
This two-family brick duplex offers two vacant units with separate electric and gas utilities. Each floor has new HVAC, while the property also includes 2 water heaters and 2 separate laundry spots. Recent interior work includes new carpet throughout and fresh paint, complemented by a new garage door.
A 2-car detached garage sits behind the home and overlooks the alley. The property is located in Dearborn near Maple and William Ford elementary schools, parks, shopping, and major roads. The address is 6406-6408 Mead Street, Dearborn, MI 48126.
A 2-car detached garage sits behind the home and overlooks the alley. The property is located in Dearborn near Maple and William Ford elementary schools, parks, shopping, and major roads. The address is 6406-6408 Mead Street, Dearborn, MI 48126.
Key Highlights
- Two‑family brick duplex with both units vacant
- New HVAC serving both floors
- Separate electric and gas utilities
Financial Insights
Estimated NOI and Cap Rate
NOI / Yr
$17,838
Cap Rate
5.95%
Suggested Prices Based on Cap Rates
Cap Rate 5%
$356,760
$356.8K
Cap Rate 7%
$254,829
$254.8K
Cap Rate 9%
$198,200
$198.2K
Market Conditions
NOI Build-Up for 1,817 SF
Gross rent
$27.3K $15.00/SF
− Vacancy
−$1.8K −$0.98/SF
EGI
$25.5K $14.03/SF
− OpEx
−$7.6K −$4.21/SF
NOI
$17.8K $9.82/SF
Area
Dearborn, MI
Vacancy
6.50%
Lease Rate
$15.00 /SF/Yr
Expense Ratio
30.00%
Simulate Cap Rate and NOI
Suggested Prices Based on Cap Rates
Cap Rate 5%
$356,760
Cap Rate 7%
$254,829
Cap Rate 9%
$198,200
Alternative Uses
Best Use
Multifamily LT 5
$254.8K
$223.0K – $297.3K
NOI $17,838 @ 7.0% cap · market cap 5.95%
Second Best
Apartment 5plus
$233.0K
$203.9K – $271.9K
NOI $16,311 @ 7.0% cap · market cap 5.44%
Theoretical Best
Office A
$400.8K
$350.7K – $467.7K
NOI $28,059 @ 7.0% cap · market cap 9.36%
Zoning and permitted uses should be independently verified with authorities.
How Realmo checks its estimates
Property Analytics
Current Use
Lease Details
2
Residential units
Yes
Utilities to site
Location Intelligence
Trade Area within ½ mile
834
Businesses Nearby
Explore this area
Business Placement
Demographics for 48126, MI
55,863
Population
16,919
Households
3.3
Avg Household Size
28
Median Age
24%
College-Educated
74%
High-School Grad
8.4 sq mi
ZIP Area
6,650
Density / Sq Mi
$42,353
Median Household Income
$27,724
Median Earnings
$1,222
Median Rent
$200,600
Median Home Value
Market
Vacancy Rate% for Multifamily in Midwest region



Frequently Asked Questions
What type of property is this?
Duplex - Vacant brick duplex with separate utilities, laundry areas, and recent mechanical and interior updates.
Where is this duplex located?
The property is located at 6406-6408 Mead St Dearborn, MI.
What is the asking price?
The asking price for this property is $299,900.
What are key features of this property?
This property features: Two‑family brick duplex with both units vacant; New HVAC serving both floors; Separate electric and gas utilities


