Two-Building Flex
For Sale
$865,000
6401 35TH Street N, Pinellas Park, FL 33781
Commercial Sale, PINELLAS PARK, FL
Property Size4,832 SF
Lot Size0.30 Acres
Price / SF$179.01
Days on Market391
Property Features for 6401 35TH Street N
General Information
Property type
Commercial Sale
Property subtype
Other
Security features
Security
Subdivision
TROPICAL HEIGHTS
Directions
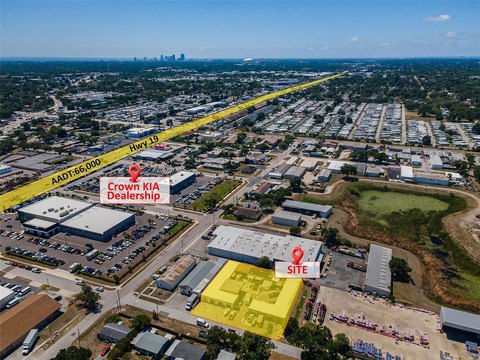
Go South on 34th street N, turn West on 63rd avenue N, turn North on 35th street N, location on left on the corner of 63rd avenue N and 35th street N.
Standard status
Active
APN
34-30-16-92196-005-0130
Size
4,832 SF
Lot size
0.30 Acres
Taxes and HOA fees
Tax Year
2024
Tax Description
TROPICAL HEIGHTS BLK E, LOTS 13 & 14 & S 1/2 OF VAC ALLEY ADJ ON N PER O.R. 5939/80
Tax Annual Amount
7086
Legal Description
TROPICAL HEIGHTS BLK E, LOTS 13 & 14 & S 1/2 OF VAC ALLEY ADJ ON N PER O.R. 5939/80
Utilities
Utilities
Phone Available
Sewer type
Public Sewer
Heating system
Central
Water source
Public
Amenities
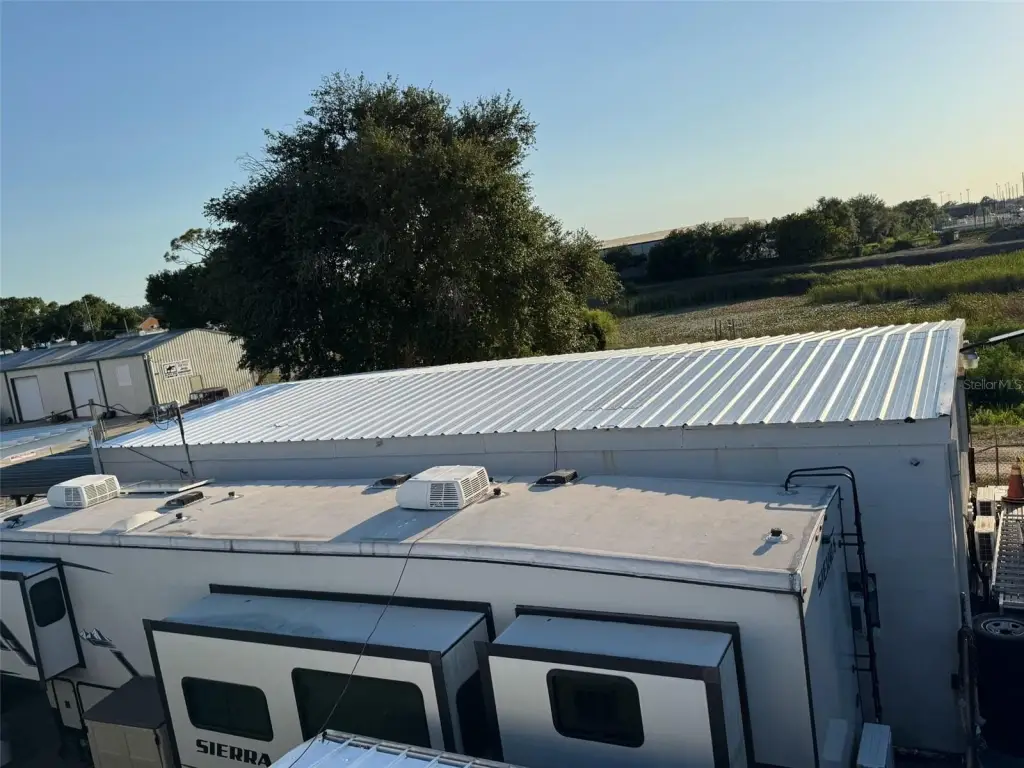
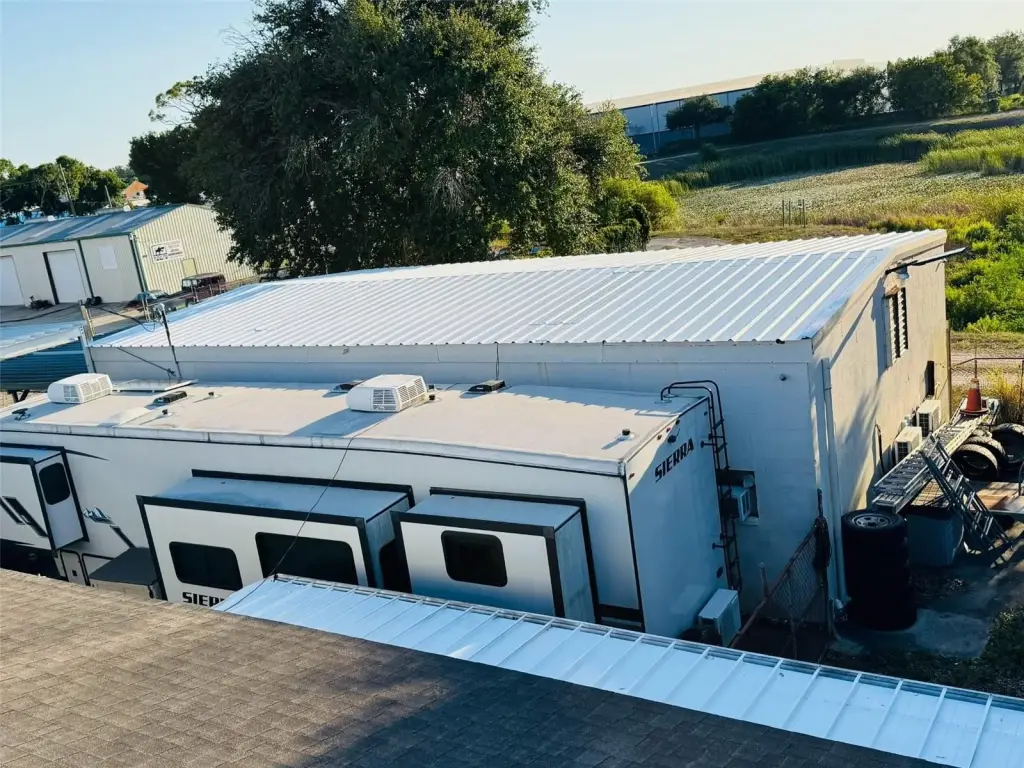
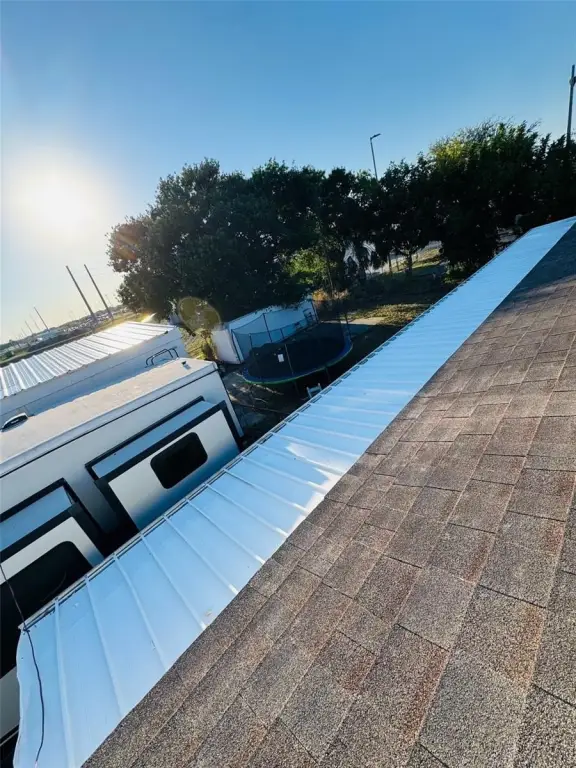
newly completed roof improvements
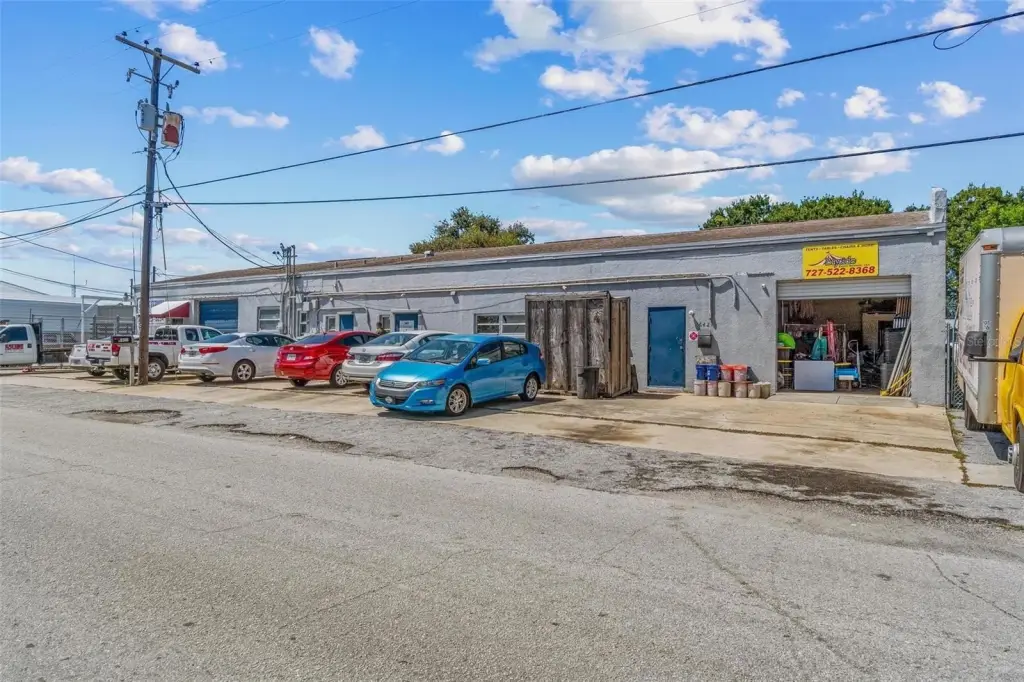
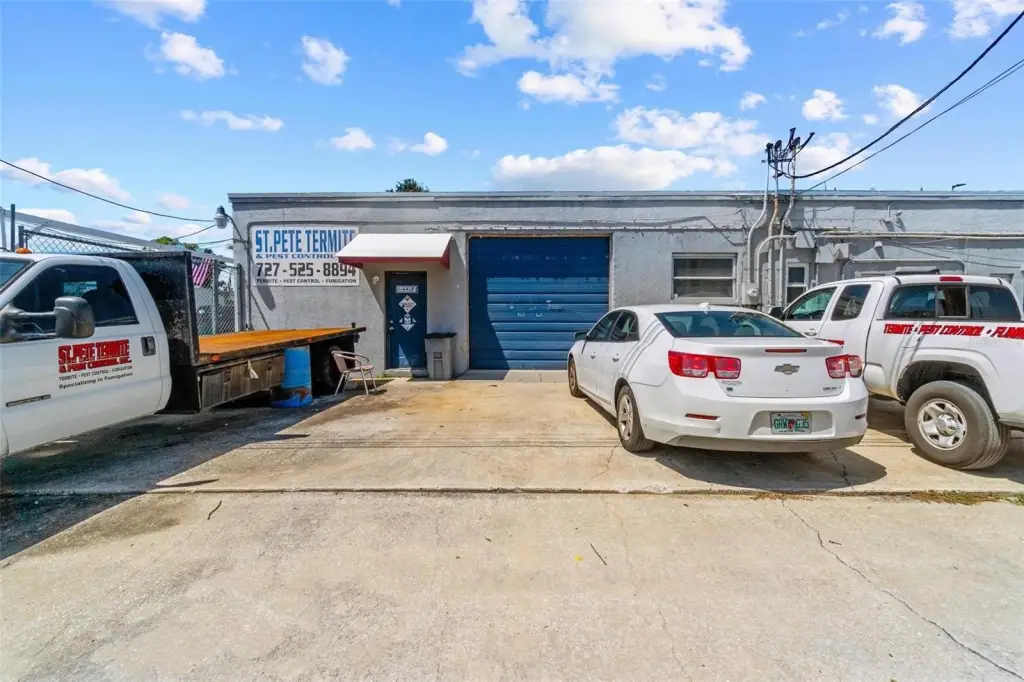
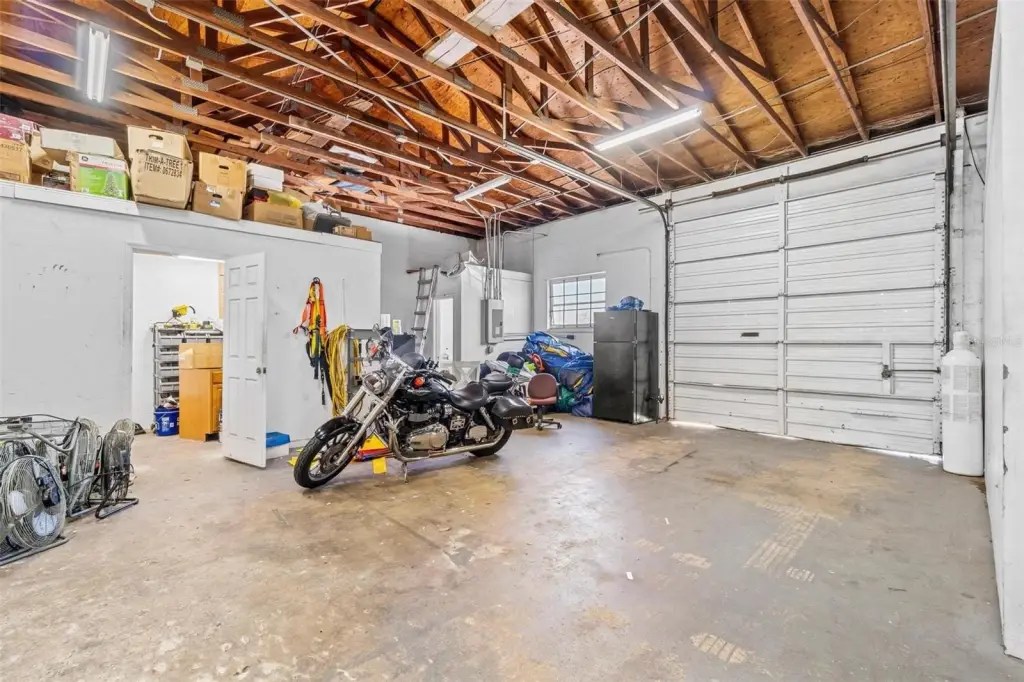
multiple bay doors
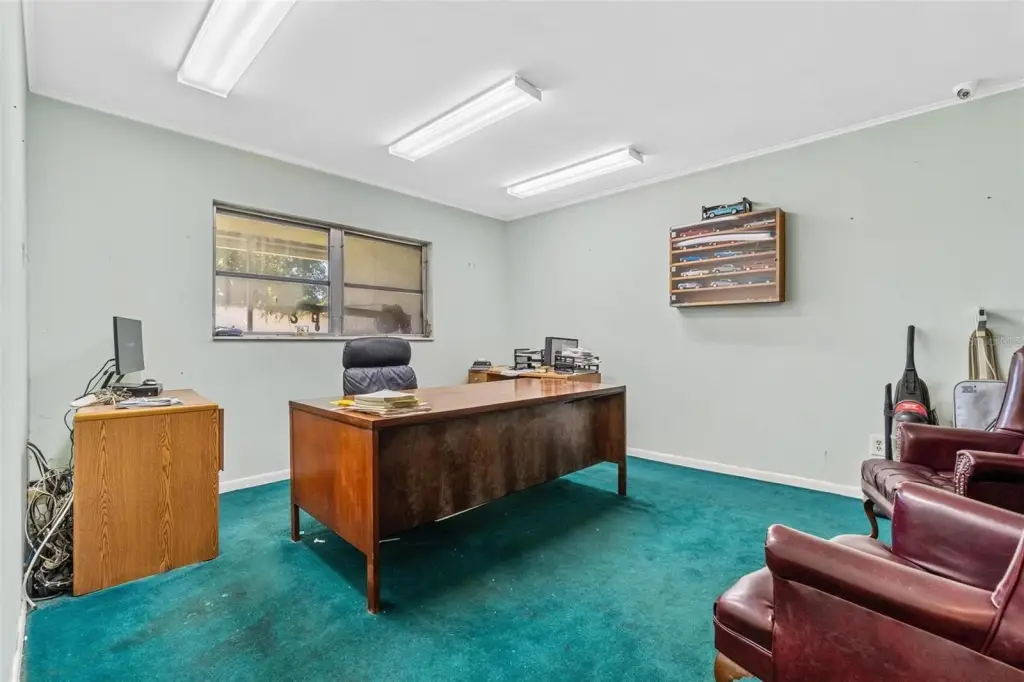
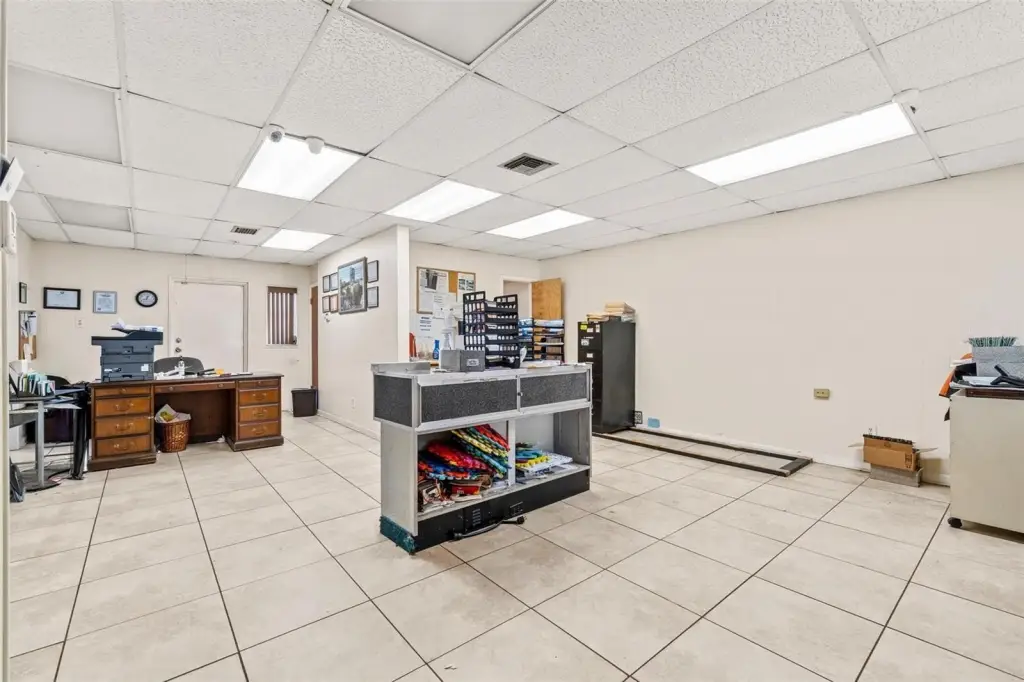
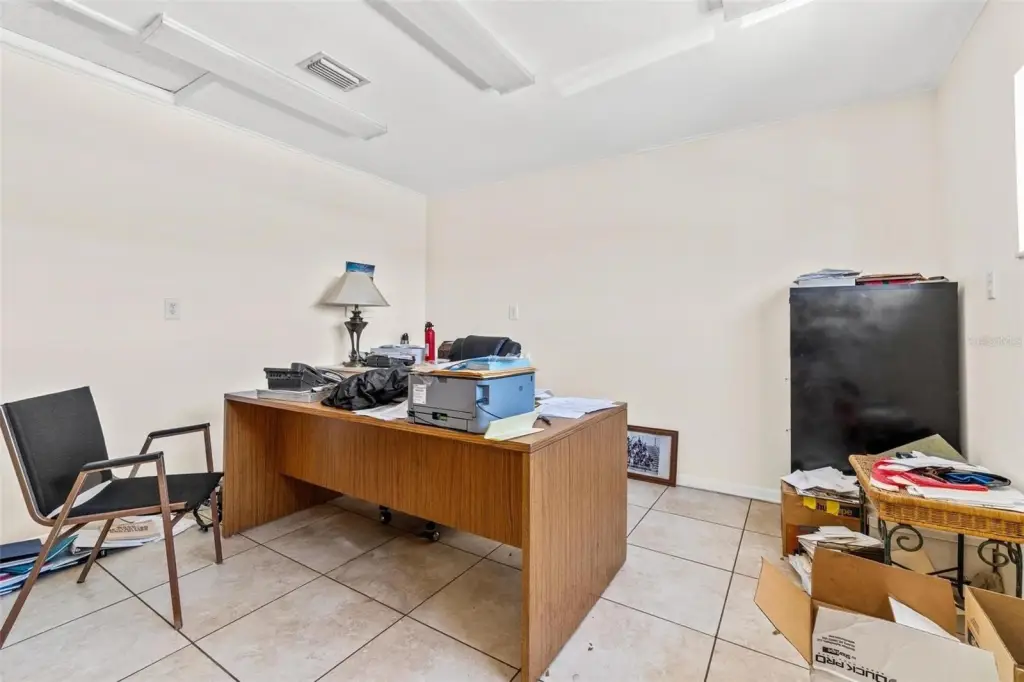
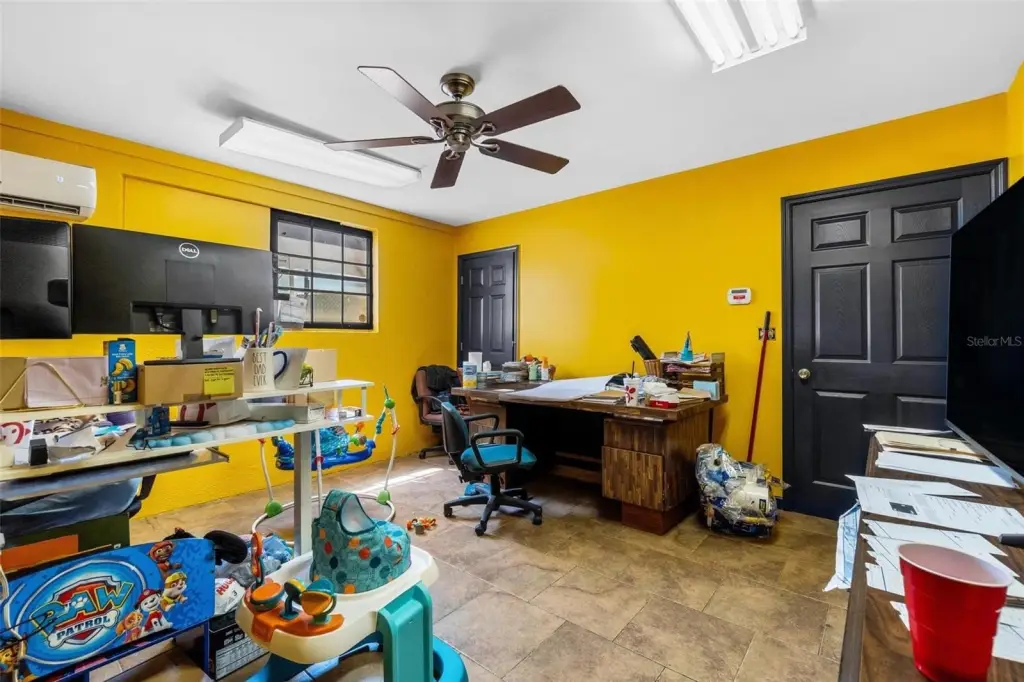
office space
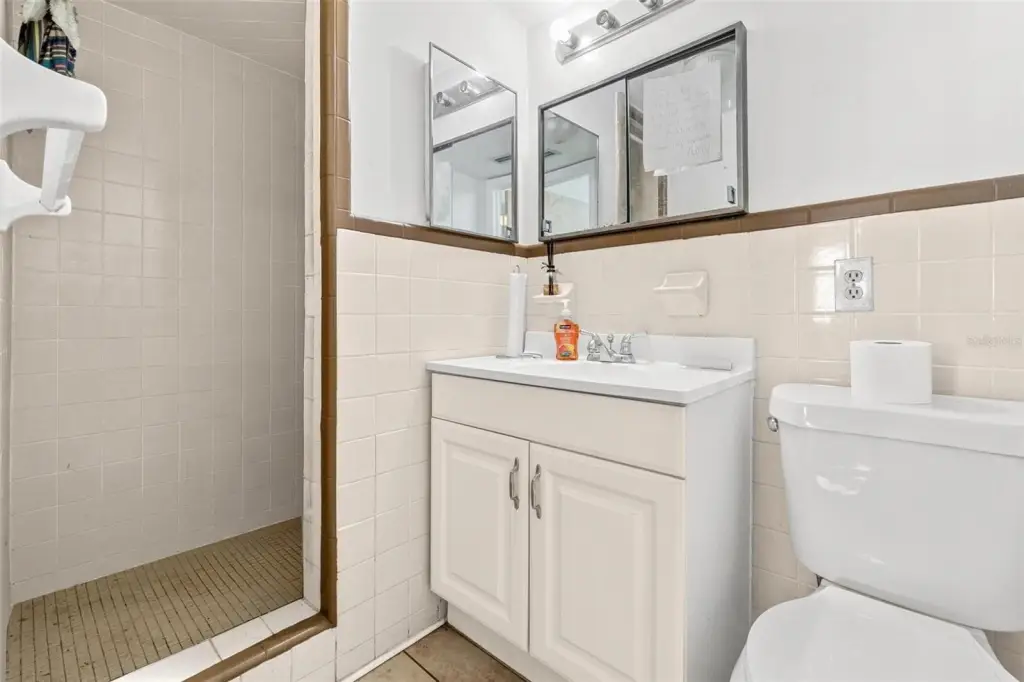
4 bathrooms
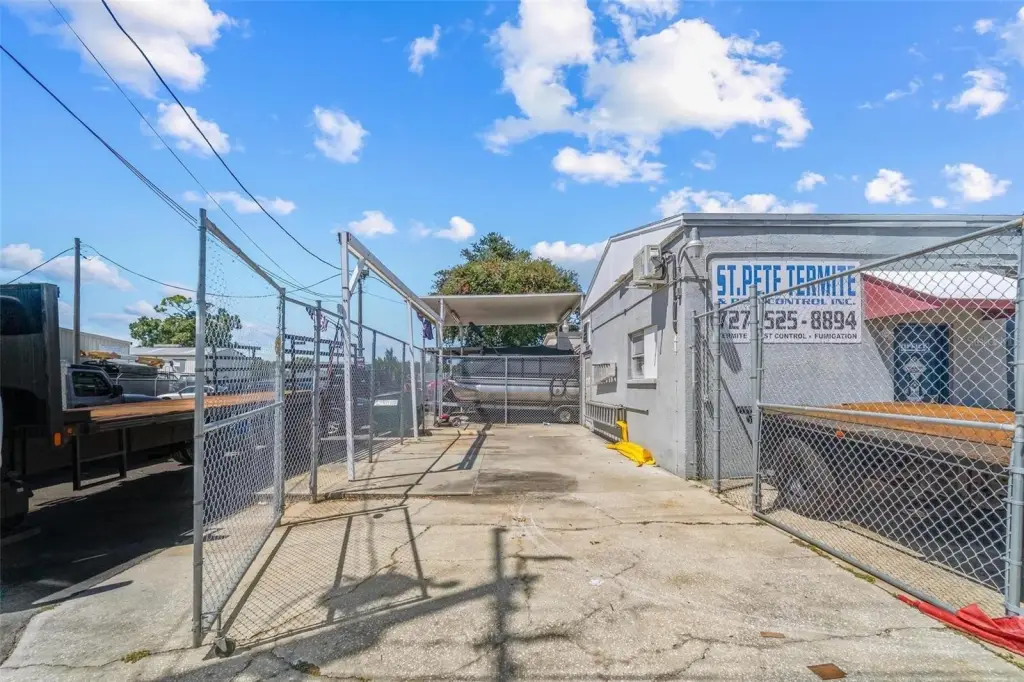
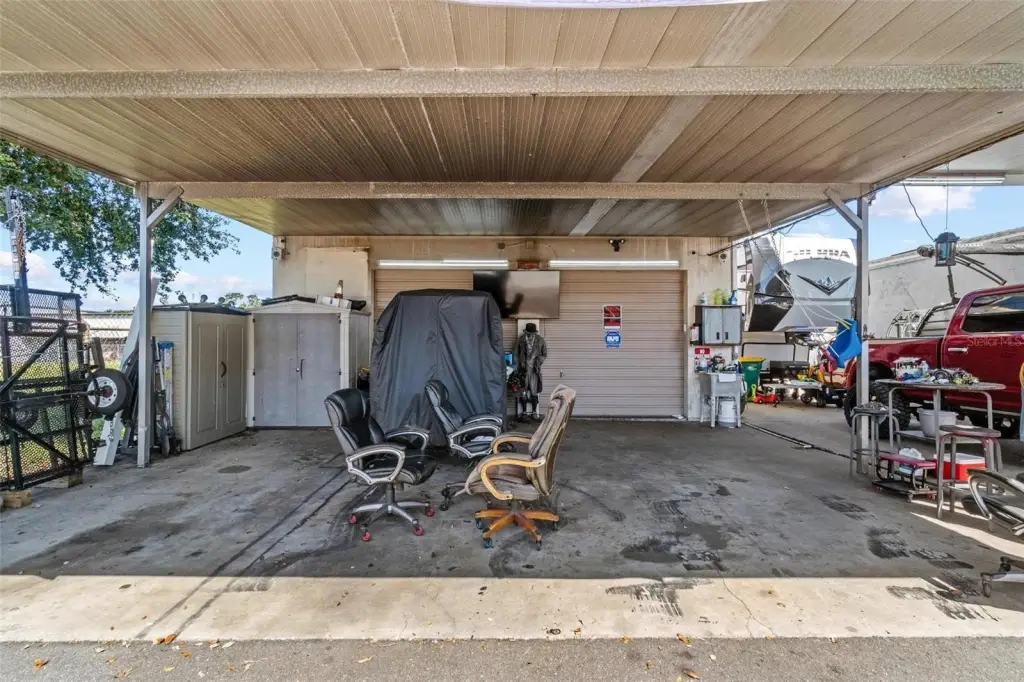
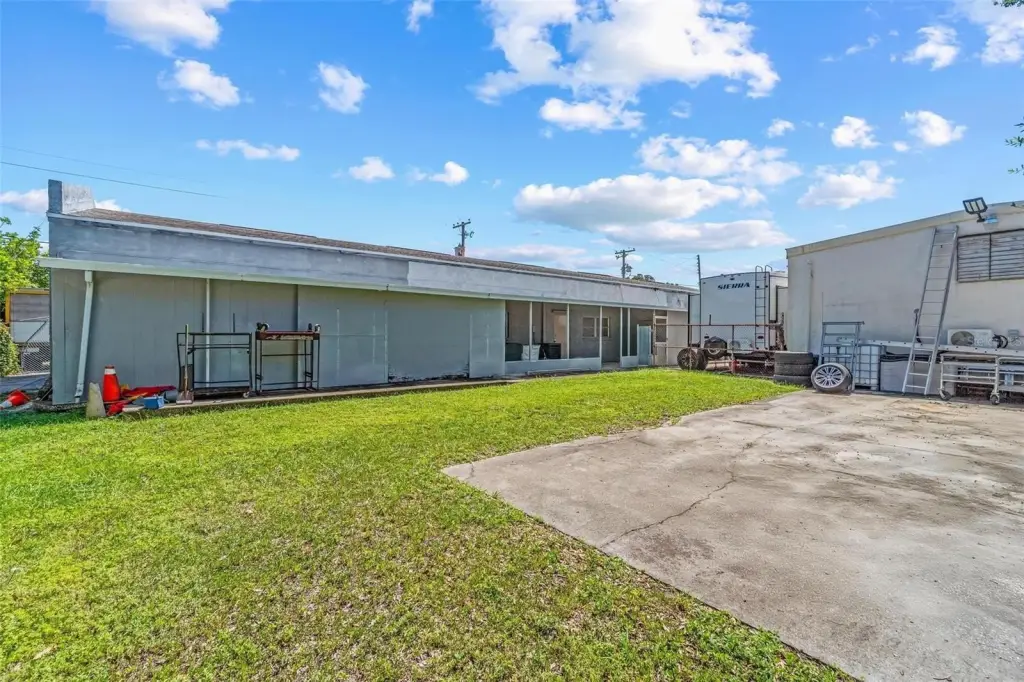
covered carport areas
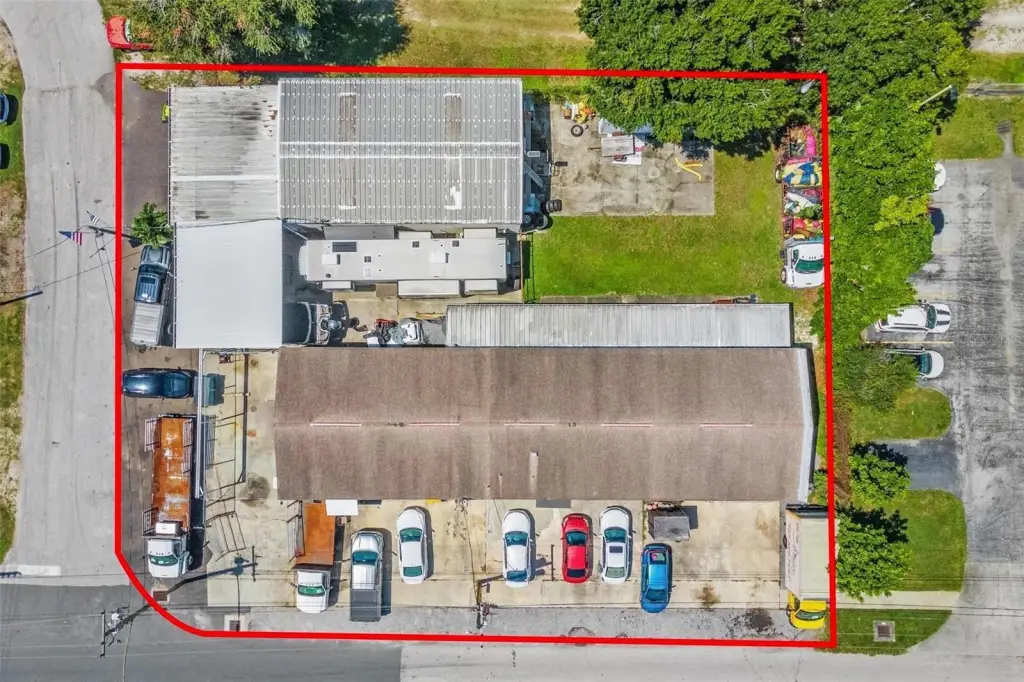
two driveways with rear access
gated/open parking
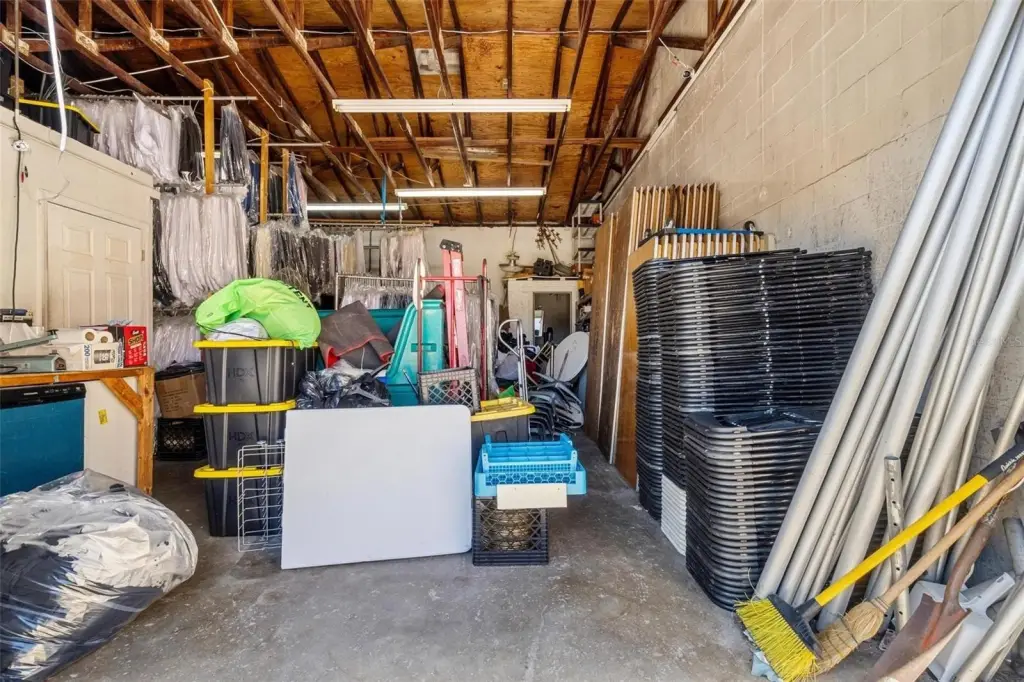
covered exterior storage
strong visibility
Building Details
Year built
1967
Floors in Building
1
Flooring type
Concrete, Carpet, Tile
Building materials
Block, Concrete, Stucco
Roof type
Shingle, Metal
Listing Agency:
COASTAL PROPERTIES GROUP INTERNATIONAL
(727) 493-1555
Listed By:
Anthony Santana · License #SA670228000
(480) 255-4500
Added: Sep 19, 2025
Changed: Sep 28
Last Checked: Oct 14 at 6:06AM
MLS# TB8430271
Copyright © 2026 Stellar MLS. All rights reserved. All information provided by the listing agent/broker is deemed reliable but is not guaranteed and should be independently verified.
Investment Insights
Based on property information with market context.
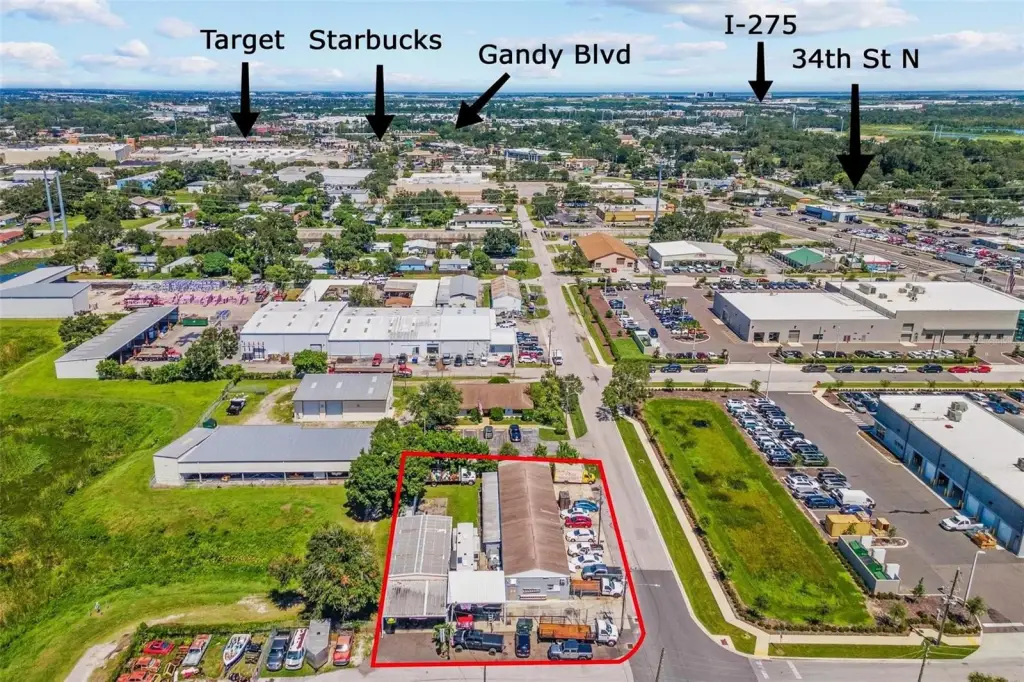
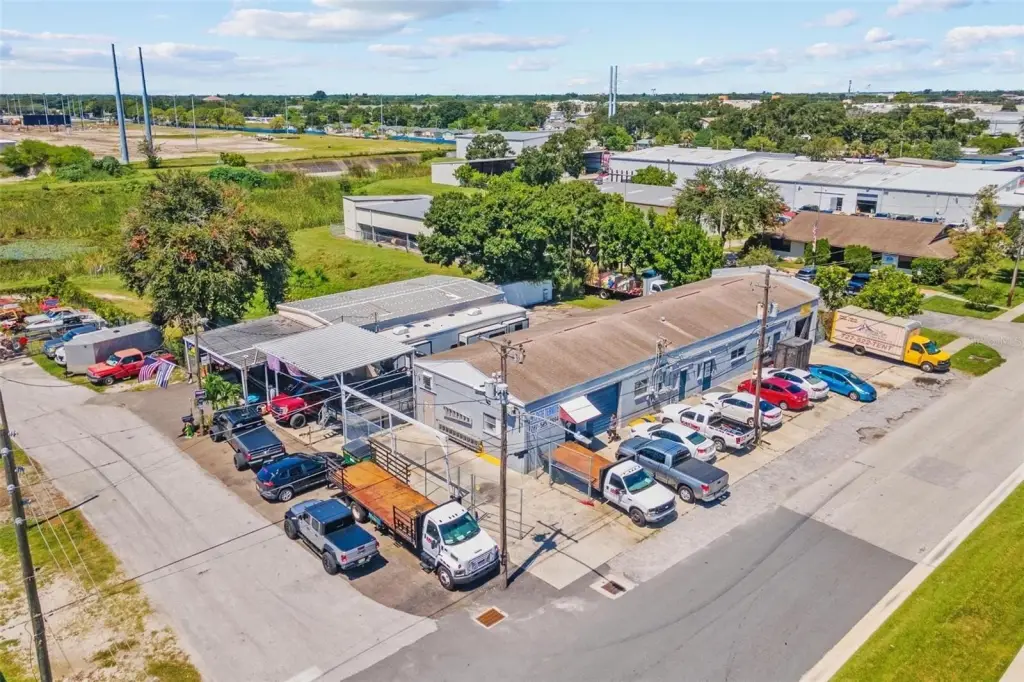
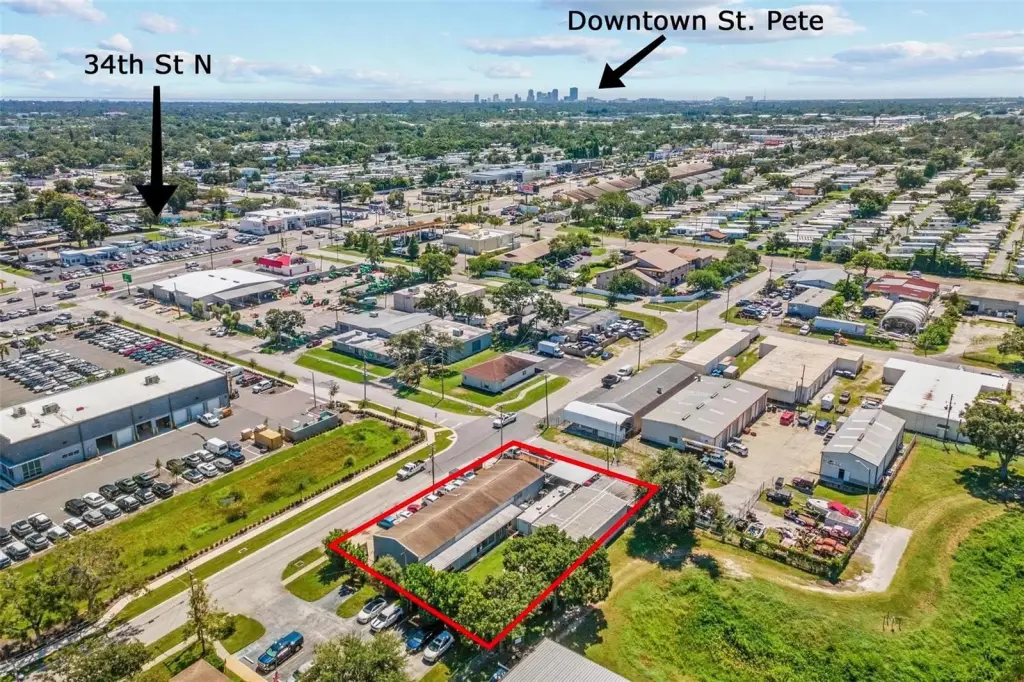
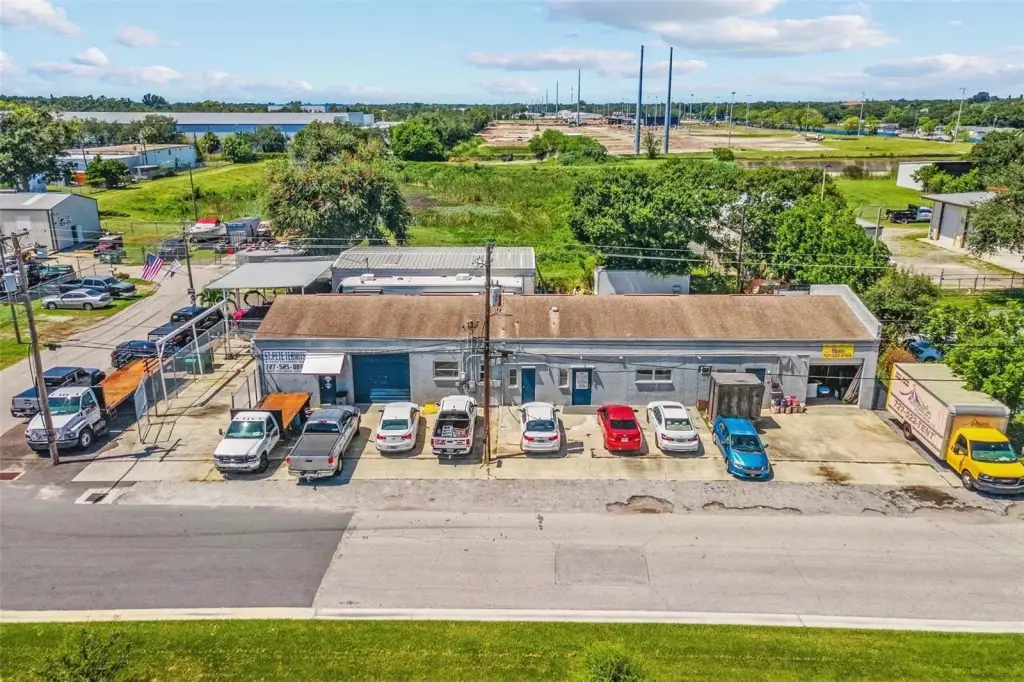
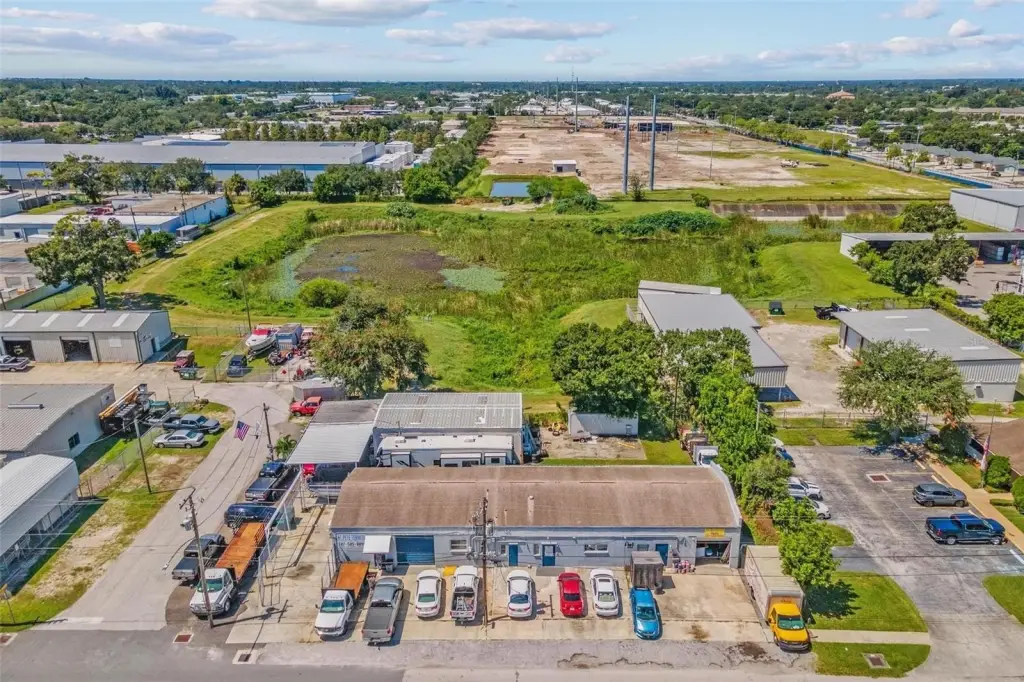
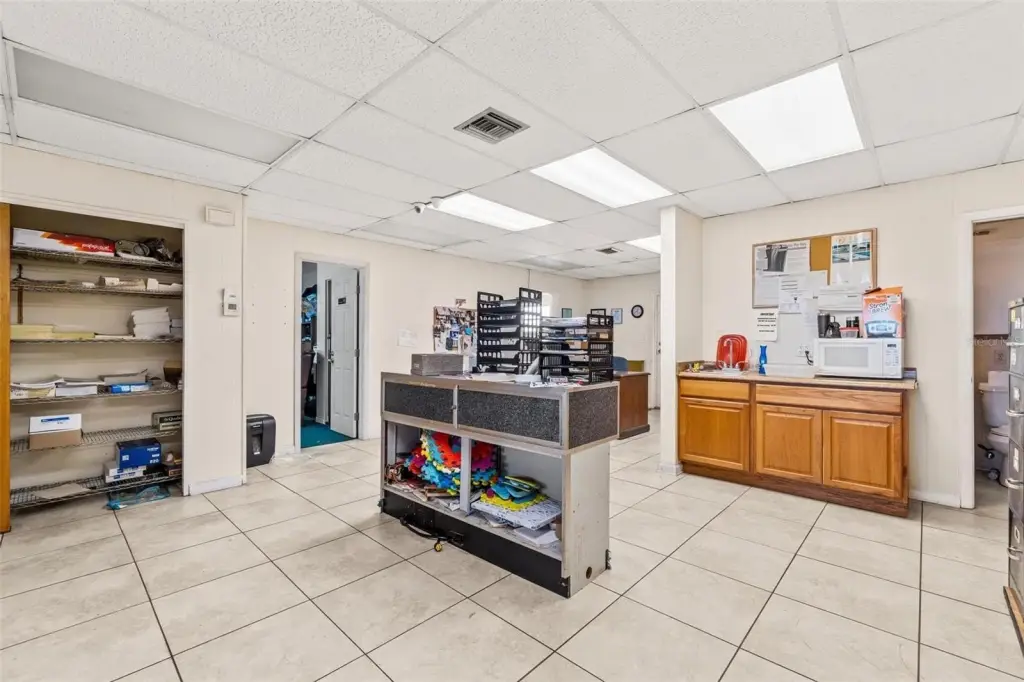
This flex property comprises two buildings on a 0.3-acre corner lot. The primary structure includes two bay doors, office areas positioned between the bays, additional office rooms, multiple entrances, garage and storage areas, and wall-mounted A/C in both office sections. A second building adds two more bay doors and adaptable interior space. The property also provides four bathrooms, a fenced yard, covered carport areas, gated and open parking, and two driveways with rear access.
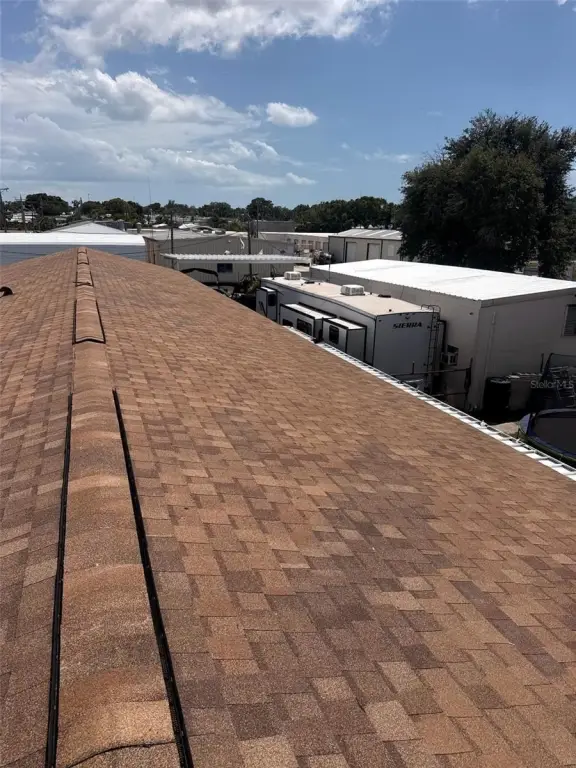
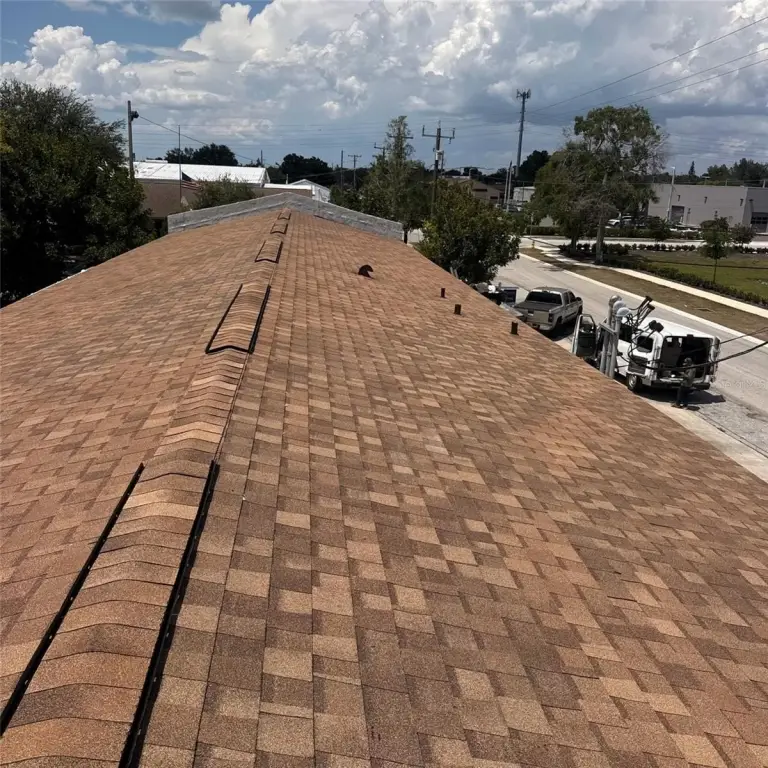
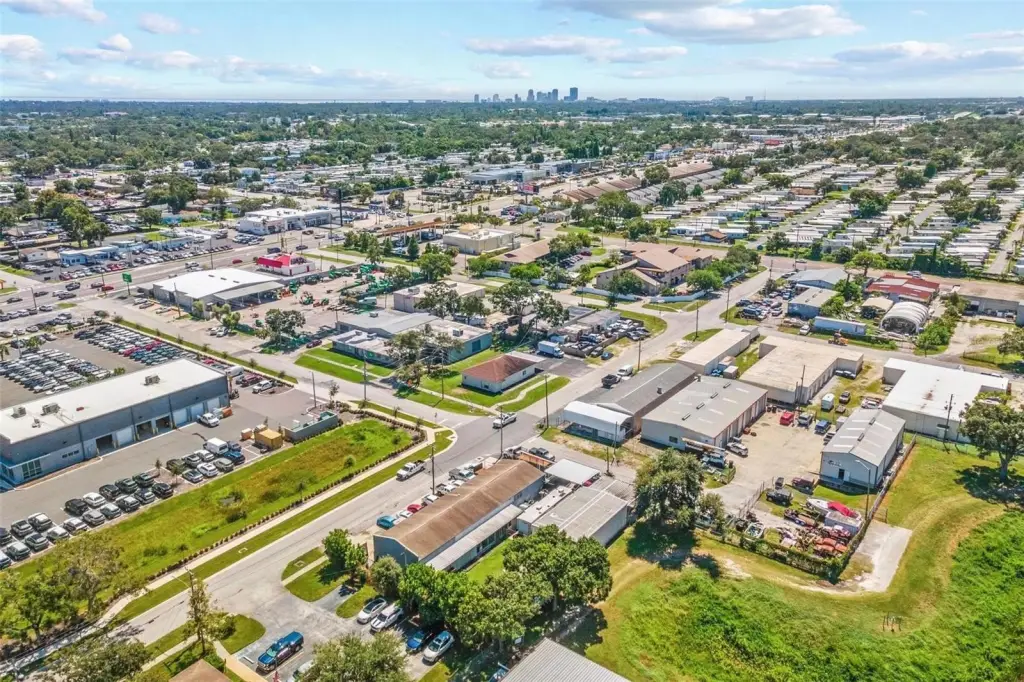
Recent roof work includes replacement of the main shingle roof along with resealing and coating of the metal roofs. The buildings were constructed in 1967 with block, concrete, and stucco components, and feature carpet, concrete, and tile flooring. Public water and public sewer serve the property. The site is near I-275 and FL-694, with access to surrounding retail, dining, and major highways.
Recent roof work includes replacement of the main shingle roof along with resealing and coating of the metal roofs. The buildings were constructed in 1967 with block, concrete, and stucco components, and feature carpet, concrete, and tile flooring. Public water and public sewer serve the property. The site is near I-275 and FL-694, with access to surrounding retail, dining, and major highways.
Key Highlights
- Two‑building flex property on a 0.3‑acre corner lot
- Four bay doors across the two buildings
- Four bathrooms plus multiple office and storage areas
Financial Insights
Estimated NOI and Cap Rate
NOI / Yr
$47,438
Cap Rate
5.48%
Suggested Prices Based on Cap Rates
Cap Rate 5%
$948,760
$948.8K
Cap Rate 7%
$677,686
$677.7K
Cap Rate 9%
$527,089
$527.1K
Market Conditions
NOI Build-Up for 4,832 SF
Gross rent
$72.5K $15.00/SF
− Vacancy
−$4.7K −$0.98/SF
EGI
$67.8K $14.03/SF
− OpEx
−$20.3K −$4.21/SF
NOI
$47.4K $9.82/SF
Area
Pinellas County, FL
Vacancy
6.50%
Lease Rate
$15.00 /SF/Yr
Expense Ratio
30.00%
Simulate Cap Rate and NOI
Suggested Prices Based on Cap Rates
Cap Rate 5%
$948,760
Cap Rate 7%
$677,686
Cap Rate 9%
$527,089
Alternative Uses
Best Use
Retail
$677.7K
$593.0K – $790.6K
NOI $47,438 @ 7.0% cap · market cap 5.48%
Second Best
Flex RnD
$624.5K
$546.5K – $728.6K
NOI $43,716 @ 7.0% cap · market cap 5.05%
Theoretical Best
Office A
$1.26M
$1.10M – $1.47M
NOI $87,979 @ 7.0% cap · market cap 10.17%
Zoning and permitted uses should be independently verified with authorities.
How Realmo checks its estimates
Property Analytics
Unlock full access to Insights
Subscribe to Realmo Intelligence
Open Analytics
Current Use
Lease Details
Yes
Fenced yard
Yes
Highway access
Yes
Paved road access
Location Intelligence
Trade Area within ½ mile
1,189
Businesses Nearby
Under-served
Demand for This Use
Explore this area
Business Placement
Demographics for 33781, FL
27,349
Population
12,370
Households
2.2
Avg Household Size
42
Median Age
22%
College-Educated
82%
High-School Grad
6.6 sq mi
ZIP Area
4,144
Density / Sq Mi
$55,378
Median Household Income
$37,039
Median Earnings
$1,197
Median Rent
$251,200
Median Home Value
Check the figures for this property
Cap Rate, Value Estimation, Potential NOI and more
View Realmo Analytics
Market
Vacancy Rate% for Industrial in South region

Questions? Ask Rey
Realmo’s AI knows this listing — price, zoning, demand, history. Ask anything.


Similar Off Market Nearby
- Catering By Lundy's — 3851 62nd Ave N suite b, Pinellas Park, FL 33781
Frequently Asked Questions
What type of property is this?
Flex space - Corner-lot commercial property with office areas, bay access, fenced outdoor space, and recent roof improvements.
Where is this flex space located?
The property is located at 6401 35TH Street N Pinellas Park, FL.
What is the asking price?
The asking price for this property is $865,000.
What are key features of this property?
This property features: Two‑building flex property on a 0.3‑acre corner lot; Four bay doors across the two buildings; Four bathrooms plus multiple office and storage areas


