Flex Space with Small-Bay
For Sale
$2,300,000
3580 66TH Avenue N, Pinellas Park, FL 33781
Commercial Sale, PINELLAS PARK, FL
Property Size8,516 SF
Lot Size0.47 Acres
Price / SF$270.08
Days on Market158
Property Features for 3580 66TH Avenue N
General Information
Property type
Commercial Sale
Property subtype
Other
Security features
Security
Subdivision
TROPICAL HEIGHTS
Directions
US 19 to 66th Ave North
Standard status
Active
APN
34-30-16-92196-002-0080
Size
8,516 SF
Lot size
0.47 Acres
Taxes and HOA fees
Tax Year
2025
Tax Description
TROPICAL HEIGHTS BLK B, LOTS 8, 9 & 10 & N 1/2 OF VAC ALLEY ADJ ON S
Tax Annual Amount
10798
Legal Description
TROPICAL HEIGHTS BLK B, LOTS 8, 9 & 10 & N 1/2 OF VAC ALLEY ADJ ON S
Utilities
Heating system
Electric (Heating), Baseboard
Water source
Public
Amenities
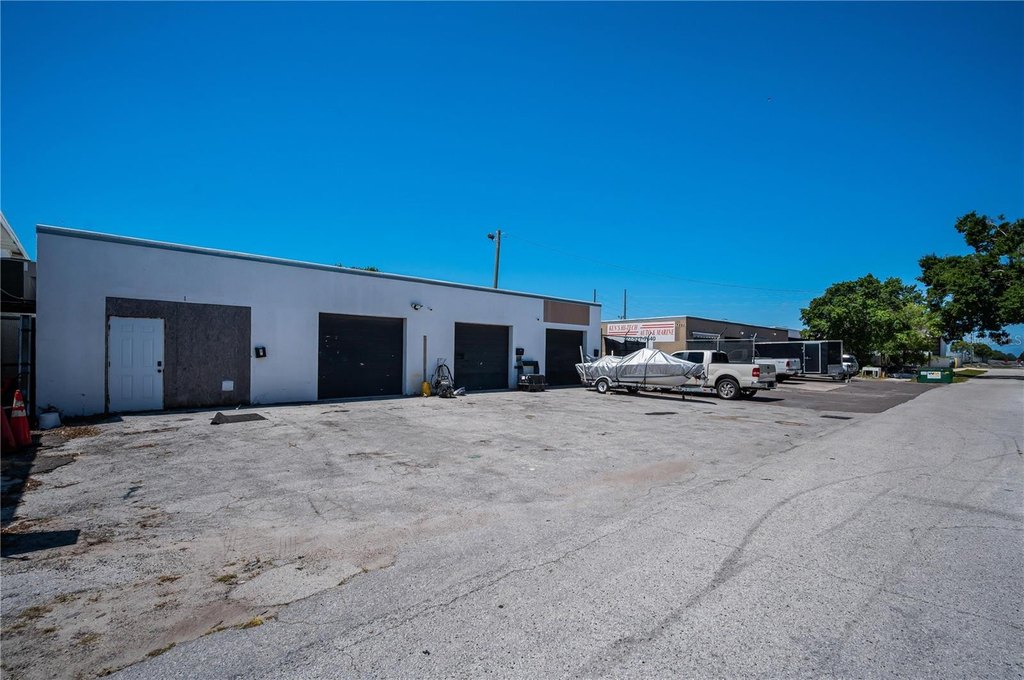
24 grade-level overhead doors (9' x 8')
9.5' ceiling heights
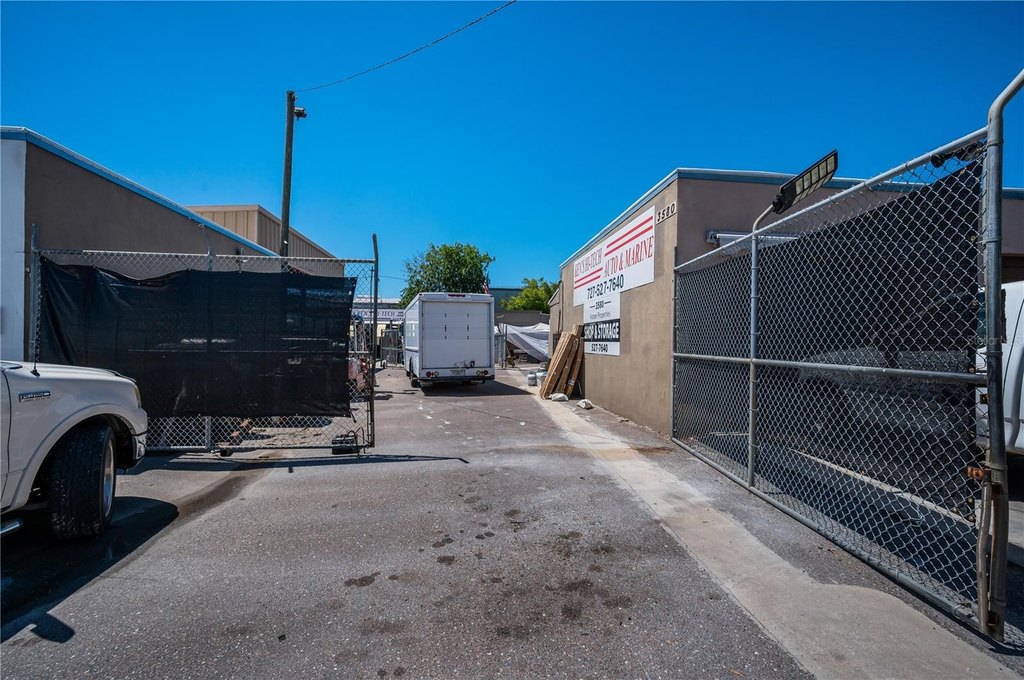
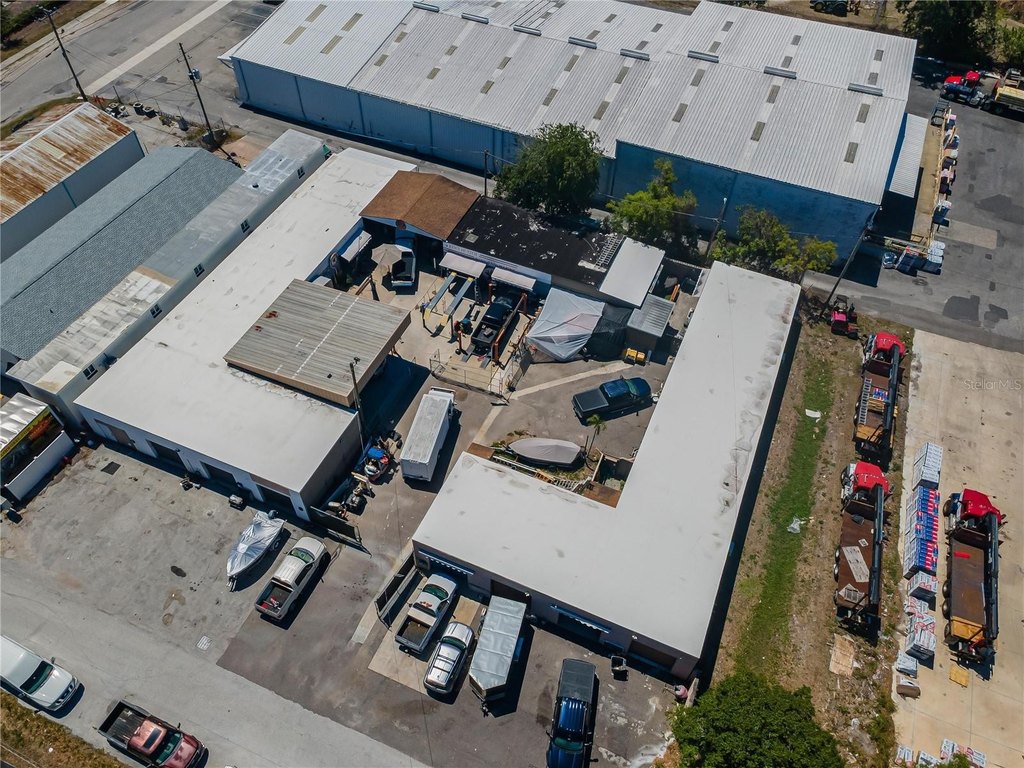
secured outdoor areas
recently installed TPO roof
Building Details
Year built
1967
Building materials
Block, Concrete
Listing Agency:
KELLER WILLIAMS REALTY- PALM H
(727) 772-0772
Listed By:
Janet Faulkner
(978) 828-8944
Added: May 19
Changed: Oct 17
Last Checked: Oct 23 at 9:06AM
MLS# TB8508660
Copyright © 2026 Stellar MLS. All rights reserved. All information provided by the listing agent/broker is deemed reliable but is not guaranteed and should be independently verified.

Ask AI about this property
Review the available facts, identify missing information and prepare questions for the agent.
Investment Insights
Based on property information with market context.
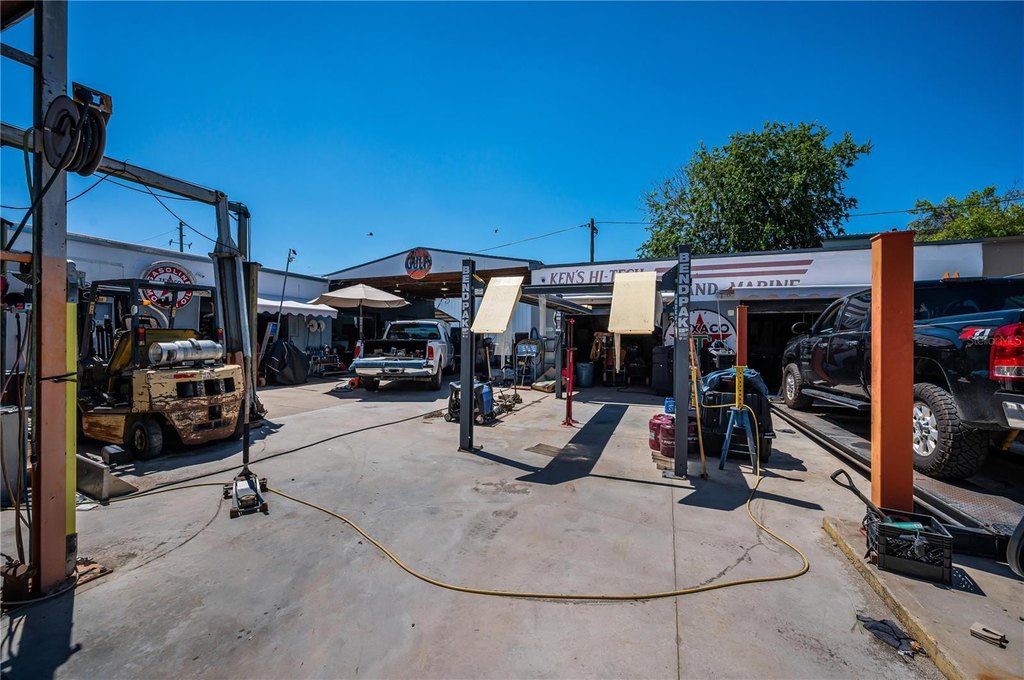
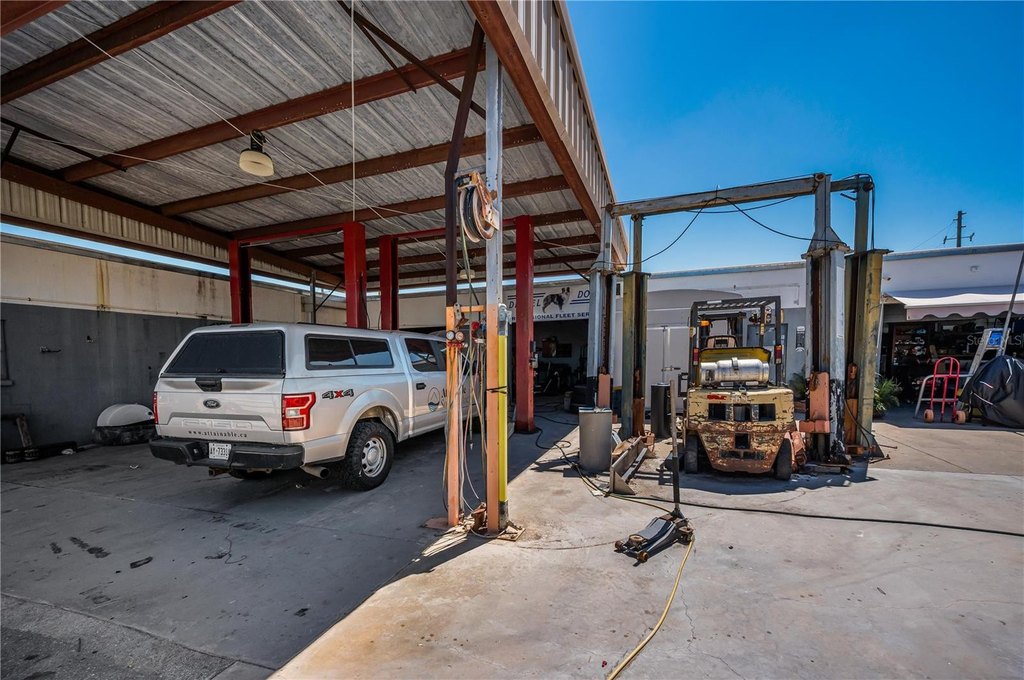
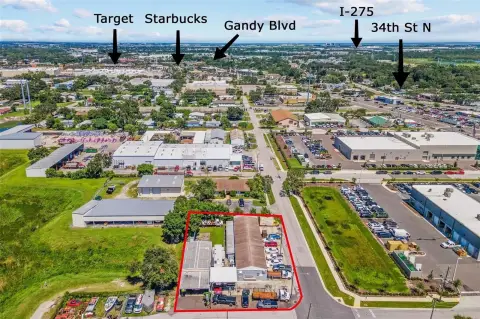
This 8,516+/- SF flex property occupies 0.47+/- acres and is built with block and concrete construction. The layout includes multiple small-bay spaces, 24 grade-level overhead doors measuring 9' x 8', 9.5' ceiling heights, secured outdoor areas, and a recently installed TPO roof. The property is currently arranged as 27 leasable units with month-to-month tenancy and includes automotive lifts and related equipment associated with the current automotive tenant.
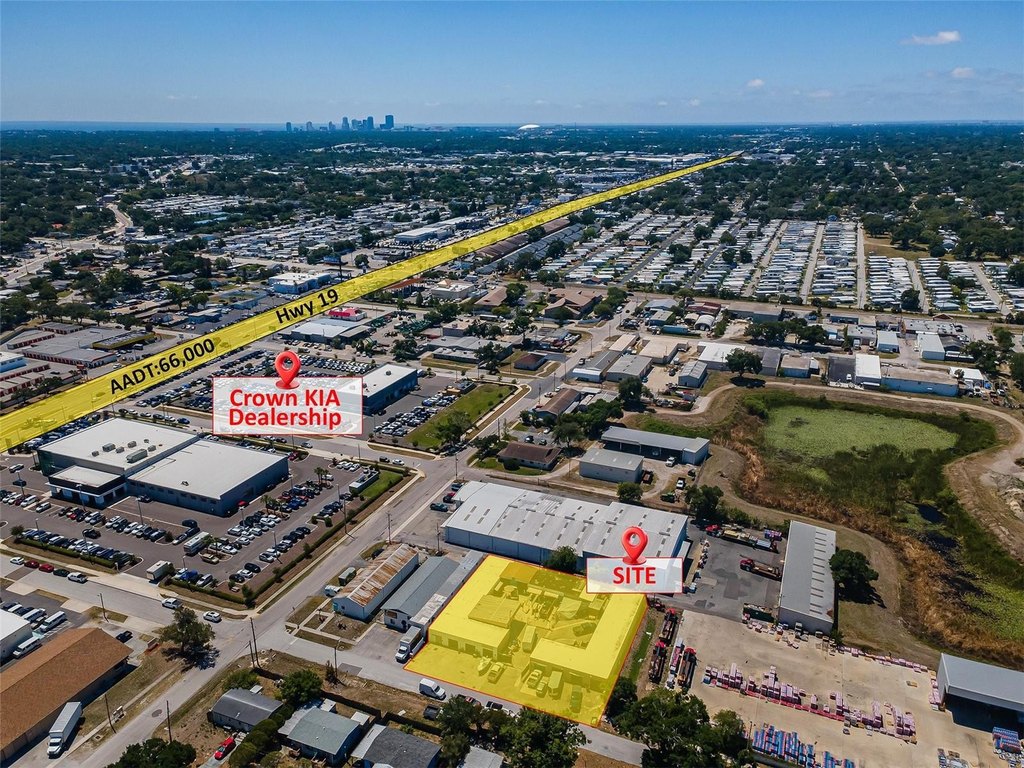
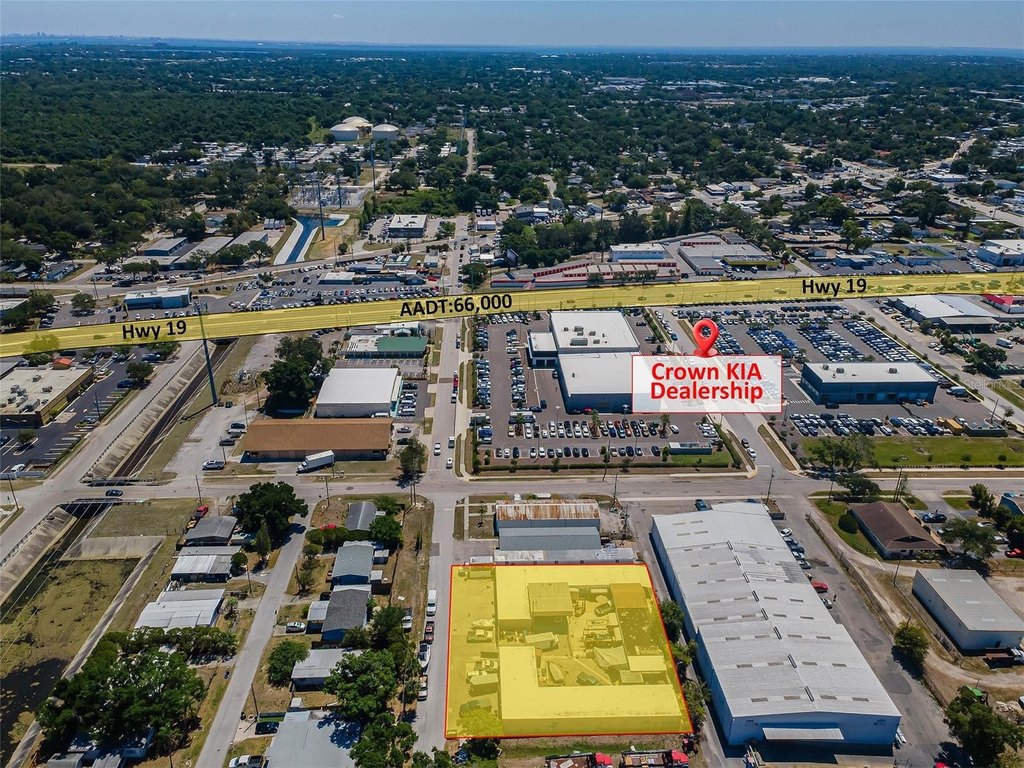
Located just off US Hwy 19 in Pinellas Park, the property has exposure to a corridor carrying over 66,000 vehicles per day. Public water serves the site, and the 1967 building is configured for industrial and automotive-oriented occupancy.
Located just off US Hwy 19 in Pinellas Park, the property has exposure to a corridor carrying over 66,000 vehicles per day. Public water serves the site, and the 1967 building is configured for industrial and automotive-oriented occupancy.
Key Highlights
- 8,516+/- SF flex property on 0.47+/- acres
- 24 grade‑level overhead doors, each measuring 9' x 8'
- Configured as 27 leasable units with month‑to‑month tenancy
Financial Insights
Estimated NOI and Cap Rate
NOI / Yr
$83,606
Cap Rate
3.64%
Suggested Prices Based on Cap Rates
Cap Rate 5%
$1,672,120
$1.7M
Cap Rate 7%
$1,194,371
$1.2M
Cap Rate 9%
$928,956
$929.0K
Market Conditions
NOI Build-Up for 8,516 SF
Gross rent
$127.7K $15.00/SF
− Vacancy
−$8.3K −$0.98/SF
EGI
$119.4K $14.03/SF
− OpEx
−$35.8K −$4.21/SF
NOI
$83.6K $9.82/SF
Area
Pinellas County, FL
Vacancy
6.50%
Lease Rate
$15.00 /SF/Yr
Expense Ratio
30.00%
Simulate Cap Rate and NOI
Suggested Prices Based on Cap Rates
Cap Rate 5%
$1,672,120
Cap Rate 7%
$1,194,371
Cap Rate 9%
$928,956
Alternative Uses
Best Use
Retail
$1.19M
$1.05M – $1.39M
NOI $83,606 @ 7.0% cap · market cap 3.64%
Second Best
Flex RnD
$1.10M
$963.1K – $1.28M
NOI $77,045 @ 7.0% cap · market cap 3.35%
Theoretical Best
Office A
$2.22M
$1.94M – $2.58M
NOI $155,056 @ 7.0% cap · market cap 6.74%
Zoning and permitted uses should be independently verified with authorities.
How Realmo checks its estimates
Property Analytics
Unlock full access to Insights
Subscribe to Realmo Intelligence
Open Analytics
Current Use
Lease Details
9 ft
Clear height
24
Drive-in doors
66,000 VPD
Traffic count
Multi-tenant
Tenancy
Yes
Highway access
Yes
Paved road access
Location Intelligence
Trade Area within ½ mile
1,189
Businesses Nearby
Under-served
Demand for This Use
Explore this area
Business Placement
Demographics for 33781, FL
27,349
Population
12,370
Households
2.2
Avg Household Size
42
Median Age
22%
College-Educated
82%
High-School Grad
6.6 sq mi
ZIP Area
4,144
Density / Sq Mi
$55,378
Median Household Income
$37,039
Median Earnings
$1,197
Median Rent
$251,200
Median Home Value
Check the figures for this property
Cap Rate, Value Estimation, Potential NOI and more
View Realmo Analytics
Market
Vacancy Rate% for Industrial in South region


Similar Off Market Nearby
- Catering By Lundy's — 3851 62nd Ave N suite b, Pinellas Park, FL 33781
Frequently Asked Questions
What type of property is this?
Flex space - Multi-unit industrial configuration with overhead access and secured exterior areas.
Where is this flex space located?
The property is located at 3580 66TH Avenue N Pinellas Park, FL.
What is the asking price?
The asking price for this property is $2,300,000.
What are key features of this property?
This property features: 8,516+/- SF flex property on 0.47+/- acres; 24 grade‑level overhead doors, each measuring 9' x 8'; Configured as 27 leasable units with month‑to‑month tenancy


