Four-Unit Residential Income
For Sale
$1,550,000
638 Salem ST, Glendale, CA 91203
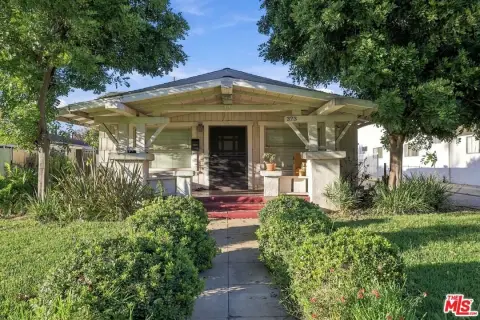
Well-maintained four-unit property with a main 2-bedroom residence, plus three rental units with outdoor space.
Property Size2,314 SF
Price / SF$651.81
Days on Market126
Property Features for 638 Salem ST
General Information
Standard status
Active
Size
2,314 SF
Property subtype
MULTI_FAMILY
Additional Details
Multifamily Units
4
Amenities
central heating and air conditioning
in-unit laundry
covered front porch
detached garage
private and shared outdoor spaces
coin-operated communal washer and dryer
Building Details
Building Size
2,314 SF
Year Built
1949
Tenancy
Multi
Listing Agency:
Lion Group Investments Inc
Listed By:
Christina Karapetyan · License #01431798
(818) 434-4040
Source:
Milsteinestates
Added: Jun 17
Changed: Oct 16
Last Checked: Oct 19 at 2:51PM
Displayed information is deemed reliable but is not guaranteed and should be independently verified. All listing content including descriptions, pricing, images are the copyrighted material of Lion Group Investments Inc

Ask AI about this property
Review the available facts, identify missing information and prepare questions for the agent.
Investment Insights
Based on property information with market context.
This well-maintained four-unit residential income property includes a front 2-bedroom, 1-bath home with central heating and air conditioning, in-unit laundry, a covered front porch, and a detached garage. Behind the main house are three additional rental units designed with detached walls to help enhance privacy and minimize noise, with access to private and shared outdoor areas including small backyard spaces.
Unit A is a studio with approximately 302 square feet, with easy street parking available. Unit B is a two-bedroom, one-bath unit with approximately 624 square feet, outdoor space for seating, and two tandem parking spots on the driveway. Unit C is a one-bedroom, one-bath unit with approximately 458 square feet and a private patio for seating, along with easy street parking available. The back units share access to coin-operated communal laundry facilities.
Improvements noted include a new washing machine and new dishwasher in the main house (2017), along with additional upgrades listed for Unit A (including a new water heater, new refrigerator, and new stove/oven). The property currently generates approximately $9,180 per month in rental income. The possibility of future ADU development is mentioned, subject to buyer verification.
Unit A is a studio with approximately 302 square feet, with easy street parking available. Unit B is a two-bedroom, one-bath unit with approximately 624 square feet, outdoor space for seating, and two tandem parking spots on the driveway. Unit C is a one-bedroom, one-bath unit with approximately 458 square feet and a private patio for seating, along with easy street parking available. The back units share access to coin-operated communal laundry facilities.
Improvements noted include a new washing machine and new dishwasher in the main house (2017), along with additional upgrades listed for Unit A (including a new water heater, new refrigerator, and new stove/oven). The property currently generates approximately $9,180 per month in rental income. The possibility of future ADU development is mentioned, subject to buyer verification.
Key Highlights
- Four‑unit income property with approximately $9,180/month in rental income (as stated)
- Front residence: 2 bed, 1 bath, approximately 994 SF with central heating and A/C, in‑unit laundry, covered front porch, and detached garage
- Unit A: 302 SF studio with easy street parking; rear communal laundry access included
Financial Insights
Estimated NOI and Cap Rate
NOI / Yr
$51,543
Cap Rate
3.33%
Suggested Prices Based on Cap Rates
Cap Rate 5%
$1,030,860
$1.0M
Cap Rate 7%
$736,329
$736.3K
Cap Rate 9%
$572,700
$572.7K
Market Conditions
NOI Build-Up for 2,378 SF
Gross rent
$78.5K $33.00/SF
− Vacancy
−$4.8K −$2.04/SF
EGI
$73.6K $30.96/SF
− OpEx
−$22.1K −$9.29/SF
NOI
$51.5K $21.67/SF
Area
Glendale, CA
Vacancy
6.17%
Lease Rate
$33.00 /SF/Yr
Expense Ratio
30.00%
Simulate Cap Rate and NOI
Suggested Prices Based on Cap Rates
Cap Rate 5%
$1,030,860
Cap Rate 7%
$736,329
Cap Rate 9%
$572,700
Alternative Uses
Best Use
Multifamily LT 5
$736.3K
$644.3K – $859.1K
NOI $51,543 @ 7.0% cap · market cap 3.33%
Second Best
Apartment 5plus
$639.4K
$559.5K – $746.0K
NOI $44,758 @ 7.0% cap · market cap 2.89%
Theoretical Best
Specialty Retail
$1.43M
$1.25M – $1.67M
NOI $100,113 @ 7.0% cap · market cap 6.46%
Zoning and permitted uses should be independently verified with authorities.
How Realmo checks its estimates
Property Analytics
Unlock full access to Insights
Subscribe to Realmo Intelligence
Open Analytics
Lease Details
4
Residential units
Multi-tenant
Tenancy
Location Intelligence
Trade Area within ½ mile
3,768
Businesses Nearby
Explore this area
Business Placement
Demographics for 91203, CA
16,930
Population
7,503
Households
2.3
Avg Household Size
37
Median Age
46%
College-Educated
90%
High-School Grad
0.9 sq mi
ZIP Area
18,811
Density / Sq Mi
$77,925
Median Household Income
$48,953
Median Earnings
$2,348
Median Rent
$661,300
Median Home Value
Check the figures for this property
Cap Rate, Value Estimation, Potential NOI and more
View Realmo Analytics
Market
Vacancy Rate% for Multifamily in West region




Frequently Asked Questions
What type of property is this?
Quadplex - Well-maintained four-unit property with a main 2-bedroom residence, plus three rental units with outdoor space.
Where is this quadplex located?
The property is located at 638 Salem ST Glendale, CA.
What is the asking price?
The asking price for this property is $1,550,000.
What are key features of this property?
This property features: Four‑unit income property with approximately $9,180/month in rental income (as stated); Front residence: 2 bed, 1 bath, approximately 994 SF with central heating and A/C, in‑unit laundry, covered front porch, and detached garage; Unit A: 302 SF studio with easy street parking; rear communal laundry access included


