Two-Story Office Building Near
For Sale
$899,000
626 16th St, Gulfport, MS 39507
Multi-office layout includes conference rooms, break areas, and two additional suites.
Property Size7,616 SF
Price / SF$118.04
Days on Market368
Property Features for 626 16th St
General Information
Standard status
Active
Size
7,616 SF
Property subtype
Office
Zoning
T4-P
Additional Details
Highway Access
Yes
Building Details
Buildings
1
Stories
2
Building Size
7,616 SF
Tenancy
Multi
Owner Occupied
Yes
Listing Agency:
Southeast Commercial of MS, LLC
Listed By:
Monte Luffey · License #B19701
(228) 276-2700
Source:
Lacdb.resimplifi
Added: Oct 13, 2025
Changed: Oct 13
Last Checked: Oct 14 at 7:36PM
Displayed information is deemed reliable but is not guaranteed and should be independently verified. All listing content including descriptions, pricing, images are the copyrighted material of Southeast Commercial of MS, LLC
Investment Insights
Based on property information with market context.
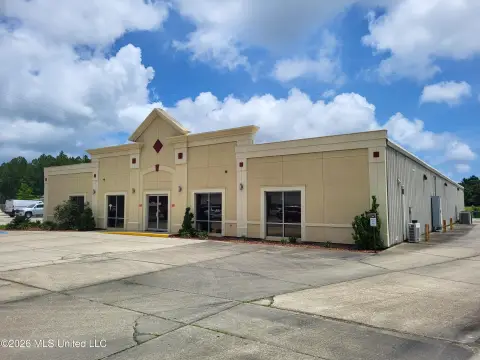
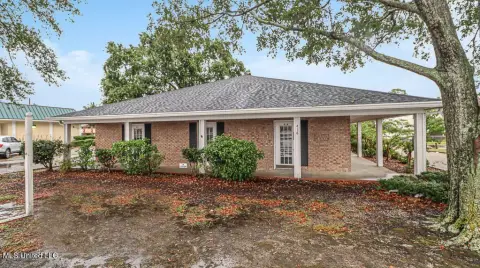
This two-story office property contains 7,616 SF across a primary office building and two separate rear suites. The front portion provides 5,116 SF with multiple offices, two large conference rooms, and two break rooms. Each rear suite measures 1,250 SF, creating a total of two smaller office spaces in addition to the front building. One rear suite is occupied by an attorney under a month-to-month lease, while the other is vacant.
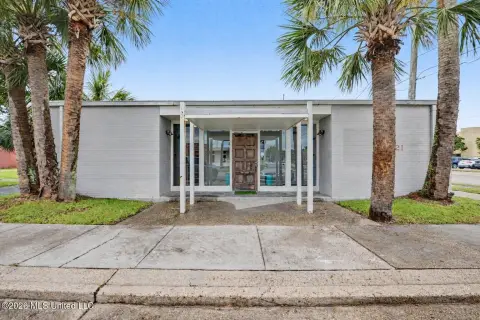
The property is situated one block from the beach and one block from Hwy 90 in Gulfport. Beach views are identified as a property feature. The existing configuration supports continued office use, and the source information also identifies potential conversion to executive office suites, VRBO, or apartments.
The property is situated one block from the beach and one block from Hwy 90 in Gulfport. Beach views are identified as a property feature. The existing configuration supports continued office use, and the source information also identifies potential conversion to executive office suites, VRBO, or apartments.
Key Highlights
- 7,616 SF two‑story office property in Gulfport
- Front building includes 5,116 SF of office space
- Two rear office suites measuring 1,250 SF each
Financial Insights
Estimated NOI and Cap Rate
NOI / Yr
$60,703
Cap Rate
6.75%
Suggested Prices Based on Cap Rates
Cap Rate 5%
$1,214,060
$1.2M
Cap Rate 7%
$867,186
$867.2K
Cap Rate 9%
$674,478
$674.5K
Market Conditions
NOI Build-Up for 7,616 SF
Gross rent
$98.7K $12.96/SF
− Vacancy
−$17.8K −$2.33/SF
EGI
$80.9K $10.63/SF
− OpEx
−$20.2K −$2.66/SF
NOI
$60.7K $7.97/SF
Area
Harrison County, MS
Vacancy
18.00%
Lease Rate
$12.96 /SF/Yr
Expense Ratio
25.00%
Simulate Cap Rate and NOI
Suggested Prices Based on Cap Rates
Cap Rate 5%
$1,214,060
Cap Rate 7%
$867,186
Cap Rate 9%
$674,478
Alternative Uses
Best Use
Office B
$867.2K
$758.8K – $1.01M
NOI $60,703 @ 7.0% cap · market cap 6.75%
Second Best
—
—
no second resolved use
Theoretical Best
Healthcare Medical
$1.23M
$1.07M – $1.43M
NOI $85,886 @ 7.0% cap · market cap 9.55%
Zoning and permitted uses should be independently verified with authorities.
How Realmo checks its estimates
Property Analytics
Current Use
Lease Details
Multi-tenant
Tenancy
Yes
Highway access
Location Intelligence
Trade Area within ½ mile
398
Businesses Nearby
Explore this area
Business Placement
Demographics for 39507, MS
17,724
Population
9,032
Households
2
Avg Household Size
42
Median Age
29%
College-Educated
91%
High-School Grad
8.2 sq mi
ZIP Area
2,161
Density / Sq Mi
$49,459
Median Household Income
$37,660
Median Earnings
$1,121
Median Rent
$220,600
Median Home Value
Market
Vacancy Rate% for Office in South region

Questions? Ask Rey
Realmo’s AI knows this listing — price, zoning, demand, history. Ask anything.






Frequently Asked Questions
What type of property is this?
Office building - Multi-office layout includes conference rooms, break areas, and two additional suites.
Where is this office building located?
The property is located at 626 16th St Gulfport, MS.
What is the asking price?
The asking price for this property is $899,000.
What are key features of this property?
This property features: 7,616 SF two‑story office property in Gulfport; Front building includes 5,116 SF of office space; Two rear office suites measuring 1,250 SF each


