Two-Tenant NNN Retail
For Sale
Contact for pricing
610 W MAIN ST, Ravenna, OH 44266
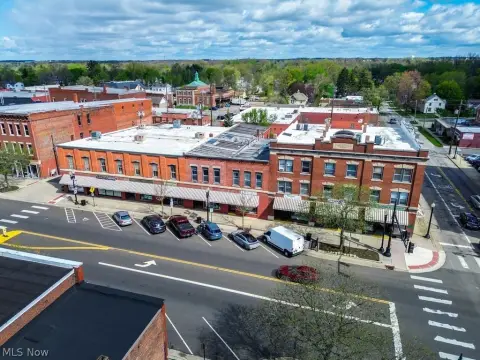
Established occupants, separate pylon signs, and a large parking field serve this two-tenant retail building.
Property Size20,000 SF
Price / SF$90.20
Days on Market53
Property Features for 610 W MAIN ST
General Information
Standard status
Active
Size
20,000 SF
Property subtype
Retail
Lease Type
NNN
Investment Type
Stabilized
Net Operating Income
$144,315
Additional Details
Pylon Signage
Yes
Building Details
Year Built
1958
Buildings
1
Stories
1
Units
2
Tenancy
Multi
Listing Agency:
Goodman Real Estate Services Group LLC
Listed By:
Kyle Hartung · License #SAL.2003016343
(216) 381-8200
Source:
Crexi
Added: Aug 27
Changed: Oct 8
Last Checked: Oct 16 at 9:22AM
Displayed information is deemed reliable but is not guaranteed and should be independently verified. All listing content including descriptions, pricing, images are the copyrighted material of Goodman Real Estate Services Group LLC

Ask AI about this property
Review the available facts, identify missing information and prepare questions for the agent.
Investment Insights
Based on property information with market context.
This 20,000-square-foot retail building contains two leased storefronts occupied by Family Dollar and Litehouse Pools & Spas. Family Dollar has operated at the property since 1986, expanded into its current store configuration in 1997, and recently added five years to its lease with a corporate guaranty. Litehouse Pools & Spas has occupied the building for 23 years.
The leases are structured as NNN arrangements, with both tenants reimbursing common area maintenance, property taxes, and insurance. Site improvements include a large parking field and dedicated pylon signage for each occupant. Constructed in 1958, the property fronts Ohio State Route 59 just outside Ravenna’s central business district. Kent State University is located west along SR 59 and has enrollment exceeding 35,000 students.
The leases are structured as NNN arrangements, with both tenants reimbursing common area maintenance, property taxes, and insurance. Site improvements include a large parking field and dedicated pylon signage for each occupant. Constructed in 1958, the property fronts Ohio State Route 59 just outside Ravenna’s central business district. Kent State University is located west along SR 59 and has enrollment exceeding 35,000 students.
Key Highlights
- 20,000‑square‑foot, two‑tenant retail building
- Family Dollar occupancy dates to 1986, with a 1997 expansion to its current store size
- Litehouse Pools & Spas has occupied the property for 23 years
Financial Insights
Estimated NOI and Cap Rate
NOI / Yr
$78,863
Cap Rate
4.37%
Suggested Prices Based on Cap Rates
Cap Rate 5%
$1,577,260
$1.6M
Cap Rate 7%
$1,126,614
$1.1M
Cap Rate 9%
$876,256
$876.3K
Market Conditions
NOI Build-Up for 20,000 SF
Gross rent
$117.6K $5.88/SF
− Vacancy
−$4.9K −$0.25/SF
EGI
$112.7K $5.63/SF
− OpEx
−$33.8K −$1.69/SF
NOI
$78.9K $3.94/SF
Area
Portage County, OH
Vacancy
4.20%
Lease Rate
$5.88 /SF/Yr
Expense Ratio
30.00%
Simulate Cap Rate and NOI
Suggested Prices Based on Cap Rates
Cap Rate 5%
$1,577,260
Cap Rate 7%
$1,126,614
Cap Rate 9%
$876,256
Alternative Uses
Best Use
Retail
$1.13M
$985.8K – $1.31M
NOI $78,863 @ 7.0% cap · market cap 4.37%
Second Best
—
—
no second resolved use
Theoretical Best
Office A
$4.03M
$3.52M – $4.70M
NOI $281,996 @ 7.0% cap · market cap 15.63%
Zoning and permitted uses should be independently verified with authorities.
How Realmo checks its estimates
Property Analytics
Unlock full access to Insights
Subscribe to Realmo Intelligence
Open Analytics
Current Use
Location Intelligence
Trade Area within ½ mile
756
Businesses Nearby
51k
Monthly Visits Nearby
Explore this area
Business Placement
Foot Traffic Nearby
Dining 58%
Shops & Services 39%
Home Improvements & Furnishings 1%
Electronics 1%
McDonald's
Dining
22,770 visits/mo
0.1 miles
Huntington Bank
Shops & Services
10,294 visits/mo
0.3 miles
Arby's
Dining
6,623 visits/mo
0.1 miles
Family Dollar
Shops & Services
4,385 visits/mo
0.1 miles
KeyBank
Shops & Services
2,832 visits/mo
0.4 miles
Demographics for 44266, OH
32,606
Population
15,036
Households
2.2
Avg Household Size
43
Median Age
21%
College-Educated
92%
High-School Grad
91.9 sq mi
ZIP Area
355
Density / Sq Mi
$61,211
Median Household Income
$40,068
Median Earnings
$904
Median Rent
$159,900
Median Home Value
Check the figures for this property
Cap Rate, Value Estimation, Potential NOI and more
View Realmo Analytics
Market
Vacancy Rate% for Retail in Midwest region




Frequently Asked Questions
What type of property is this?
NNN property - Established occupants, separate pylon signs, and a large parking field serve this two-tenant retail building.
Where is this nnn property located?
The property is located at 610 W MAIN ST Ravenna, OH.
What is the asking price?
The asking price for this property is $1,804,000.
What are key features of this property?
This property features: 20,000‑square‑foot, two‑tenant retail building; Family Dollar occupancy dates to 1986, with a 1997 expansion to its current store size; Litehouse Pools & Spas has occupied the property for 23 years


