High-Visibility Commercial Property in
For Sale
$1,195,000
606 N PINELLAS AVENUE, Tarpon Springs, FL 34689
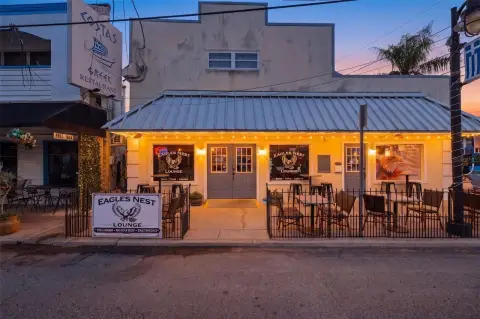
Income-producing commercial property with restaurant tenant in prime location.
Property Size5,145 SF
Lot Size0.43 Acres
Price / SF$232.26
Days on Market474
Property Features for 606 N PINELLAS AVENUE
General Information
Standard status
Active
Size
5,145 SF
Lot size
0.43 Acres
Property subtype
Commercial
Taxes and HOA fees
Annual Taxes
$9,025
Amenities
Central air
Pool
Public Pool
Central Air Cooling
Building Details
Year Built
1942
Listing Agency:
HIGH POINT REALTY INC
(727) 466-6697
Listed By:
ANGELA CROOK · License #3284596
(727) 709-0748
Source:
Corcoran
Added: Jul 3, 2025
Changed: Sep 4
Last Checked: Aug 24 at 6:52AM
Displayed information is deemed reliable but is not guaranteed and should be independently verified. All listing content including descriptions, pricing, images are the copyrighted material of HIGH POINT REALTY INC

Ask AI about this property
Review the available facts, identify missing information and prepare questions for the agent.
Investment Insights
Based on property information with market context.
This commercial property is located in Tarpon Springs and offers substantial square footage on a high-traffic corner, providing excellent visibility. The property is currently tenant-occupied by The Hidden Anchor, a restaurant with a full bar and outdoor Tiki Bar, generating rental income. Ample parking is available to accommodate a large number of customers. The location is surrounded by retail, residential, and tourist attractions. This property presents a strong long-term investment potential in a high-demand area. The business is currently for sale separately.
Key Highlights
- High‑visibility corner location on high‑traffic roads.
- Currently tenant‑occupied by a well‑established restaurant (The Hidden Anchor) with steady rental income.
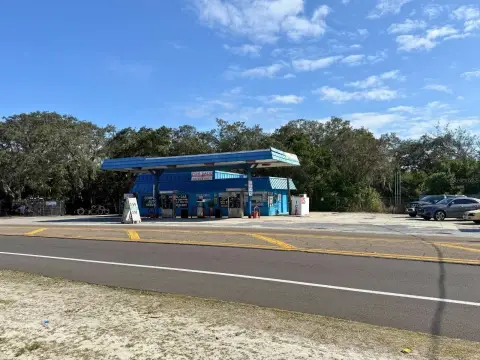
- Ample parking, including an additional parking lot across the street.
Financial Insights
Estimated NOI and Cap Rate
NOI / Yr
$57,187
Cap Rate
4.79%
Suggested Prices Based on Cap Rates
Cap Rate 5%
$1,143,740
$1.1M
Cap Rate 7%
$816,957
$817.0K
Cap Rate 9%
$635,411
$635.4K
Market Conditions
NOI Build-Up for 5,145 SF
Gross rent
$80.3K $15.60/SF
− Vacancy
−$4.0K −$0.78/SF
EGI
$76.2K $14.82/SF
− OpEx
−$19.1K −$3.70/SF
NOI
$57.2K $11.11/SF
Area
Pinellas County, FL
Vacancy
5.00%
Lease Rate
$15.60 /SF/Yr
Expense Ratio
25.00%
Simulate Cap Rate and NOI
Suggested Prices Based on Cap Rates
Cap Rate 5%
$1,143,740
Cap Rate 7%
$816,957
Cap Rate 9%
$635,411
Alternative Uses
Best Use
Specialty Retail
$817.0K
$714.8K – $953.1K
NOI $57,187 @ 7.0% cap · market cap 4.79%
Second Best
Retail
$721.6K
$631.4K – $841.9K
NOI $50,511 @ 7.0% cap · market cap 4.23%
Theoretical Best
Office A
$1.34M
$1.17M – $1.56M
NOI $93,678 @ 7.0% cap · market cap 7.84%
Zoning and permitted uses should be independently verified with authorities.
How Realmo checks its estimates
Property Analytics
Unlock full access to Insights
Subscribe to Realmo Intelligence
Open Analytics
Current Use
Location Intelligence
Trade Area within ½ mile
1,404
Businesses Nearby
Under-served
Demand for This Use
Explore this area
Business Placement
Demographics for 34689, FL
27,436
Population
14,193
Households
1.9
Avg Household Size
53
Median Age
32%
College-Educated
93%
High-School Grad
10.6 sq mi
ZIP Area
2,588
Density / Sq Mi
$66,523
Median Household Income
$45,294
Median Earnings
$1,207
Median Rent
$311,500
Median Home Value
Check the figures for this property
Cap Rate, Value Estimation, Potential NOI and more
View Realmo Analytics
Market
Vacancy Rate% for Retail in South region




Frequently Asked Questions
What type of property is this?
Restaurant - Income-producing commercial property with restaurant tenant in prime location.
Where is this restaurant located?
The property is located at 606 N PINELLAS AVENUE Tarpon Springs, FL.
What is the asking price?
The asking price for this property is $1,195,000.
What are key features of this property?
This property features: High‑visibility corner location on high‑traffic roads.; Currently tenant‑occupied by a well‑established restaurant (The Hidden Anchor) with steady rental income.; Ample parking, including an additional parking lot across the street.


