Updated Duplex with Extra
For Sale
Contact for pricing
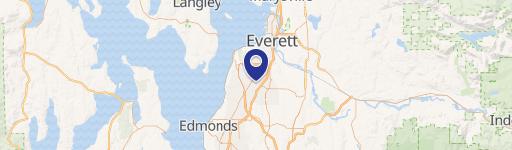
6015 Dexter Avenue, Everett, WA 98203
A fully occupied Everett duplex with remodeled units and major 2022–2025 exterior and plumbing upgrades.
Property Size2,812 SF
Price / SF$326.99
Days on Market122
Property Features for 6015 Dexter Avenue
General Information
Standard status
Active
Size
2,812 SF
Class
B
Property subtype
Multifamily
Occupancy
100%
Net Operating Income
$49,118
Additional Details
Business Included
Yes
Multifamily Units
2
Building Details
Year Built
1990
Year Renovated
2025
Buildings
1
Units
2
Tenancy
Multi
Listing Agency:
HomeSmart Real Estate Associates
Listed By:
Jason Stricevich · License #119920
(206) 523-7653
Source:
Crexi
Added: Jun 12
Changed: Oct 6
Last Checked: Oct 11 at 5:45AM
Displayed information is deemed reliable but is not guaranteed and should be independently verified. All listing content including descriptions, pricing, images are the copyrighted material of HomeSmart Real Estate Associates
Investment Insights
Based on property information with market context.
This updated Everett duplex is fully occupied and has benefited from substantial improvements. Major upgrades include a new roof, gutters, and exterior paint completed in 2022, along with a full PEX re-pipe in 2024. The driveway was widened to provide extra parking. Unit A features 3 bedrooms and 2 bathrooms and includes a 2-car garage; it was remodeled in 2022 with new appliances, flooring, cabinets, and updated surfaces. Unit B offers 3 bedrooms and 1 bathroom and was remodeled in 2025 with similar finishes.
Located at 6015 Dexter Avenue, the property sits close to everyday needs and community amenities, including Madison Elementary (about three blocks away). It is also approximately one mile to shopping and groceries, and about two miles to Forest Park.
For buyers seeking a turn-key, owner-occupied or investor-friendly duplex setup, the combination of fully remodeled interiors and recent building systems work supports straightforward day-to-day ownership. With stable tenants and a strong rental history referenced in the offering, the property presents as an income-producing multifamily asset designed to require less immediate maintenance.
Located at 6015 Dexter Avenue, the property sits close to everyday needs and community amenities, including Madison Elementary (about three blocks away). It is also approximately one mile to shopping and groceries, and about two miles to Forest Park.
For buyers seeking a turn-key, owner-occupied or investor-friendly duplex setup, the combination of fully remodeled interiors and recent building systems work supports straightforward day-to-day ownership. With stable tenants and a strong rental history referenced in the offering, the property presents as an income-producing multifamily asset designed to require less immediate maintenance.
Key Highlights
- Fully occupied Everett duplex built in 1990, with strong rental history and stable tenants
- Major exterior upgrades: new roof, gutters, and exterior paint completed in 2022
- Full PEX re‑pipe completed in 2024
Financial Insights
Estimated NOI and Cap Rate
NOI / Yr
$46,543
Cap Rate
5.06%
Suggested Prices Based on Cap Rates
Cap Rate 5%
$930,860
$930.9K
Cap Rate 7%
$664,900
$664.9K
Cap Rate 9%
$517,144
$517.1K
Market Conditions
NOI Build-Up for 2,812 SF
Gross rent
$70.9K $25.20/SF
− Vacancy
−$4.4K −$1.55/SF
EGI
$66.5K $23.65/SF
− OpEx
−$19.9K −$7.09/SF
NOI
$46.5K $16.55/SF
Area
Everett, WA
Vacancy
6.17%
Lease Rate
$25.20 /SF/Yr
Expense Ratio
30.00%
Simulate Cap Rate and NOI
Suggested Prices Based on Cap Rates
Cap Rate 5%
$930,860
Cap Rate 7%
$664,900
Cap Rate 9%
$517,144
Alternative Uses
Best Use
Multifamily LT 5
$664.9K
$581.8K – $775.7K
NOI $46,543 @ 7.0% cap · market cap 5.06%
Second Best
Apartment 5plus
$595.0K
$520.6K – $694.1K
NOI $41,647 @ 7.0% cap · market cap 4.53%
Theoretical Best
Office A
$930.8K
$814.5K – $1.09M
NOI $65,156 @ 7.0% cap · market cap 7.09%
Zoning and permitted uses should be independently verified with authorities.
Property Analytics
Unlock full access to Insights
Subscribe to Realmo Intelligence
Open Analytics
Current Use
Lease Details
2
Residential units
Turnkey business
Opportunity
Location Intelligence
Trade Area within ½ mile
728
Businesses Nearby
Explore this area
Business Placement
Demographics for 98203, WA
37,491
Population
14,848
Households
2.5
Avg Household Size
39
Median Age
34%
College-Educated
91%
High-School Grad
11.8 sq mi
ZIP Area
3,177
Density / Sq Mi
$101,505
Median Household Income
$55,176
Median Earnings
$1,761
Median Rent
$575,300
Median Home Value
Check the figures for this property
Cap Rate, Value Estimation, Potential NOI and more
View Realmo Analytics
Market
Vacancy Rate% for Multifamily in West region

Questions? Ask Rey
Realmo’s AI knows this listing — price, zoning, demand, history. Ask anything.




Frequently Asked Questions
What type of property is this?
Duplex - A fully occupied Everett duplex with remodeled units and major 2022–2025 exterior and plumbing upgrades.
Where is this duplex located?
The property is located at 6015 Dexter Avenue Everett, WA.
What is the asking price?
The asking price for this property is $919,500.
What are key features of this property?
This property features: Fully occupied Everett duplex built in 1990, with strong rental history and stable tenants; Major exterior upgrades: new roof, gutters, and exterior paint completed in 2022; Full PEX re‑pipe completed in 2024


