5-Unit Apartment
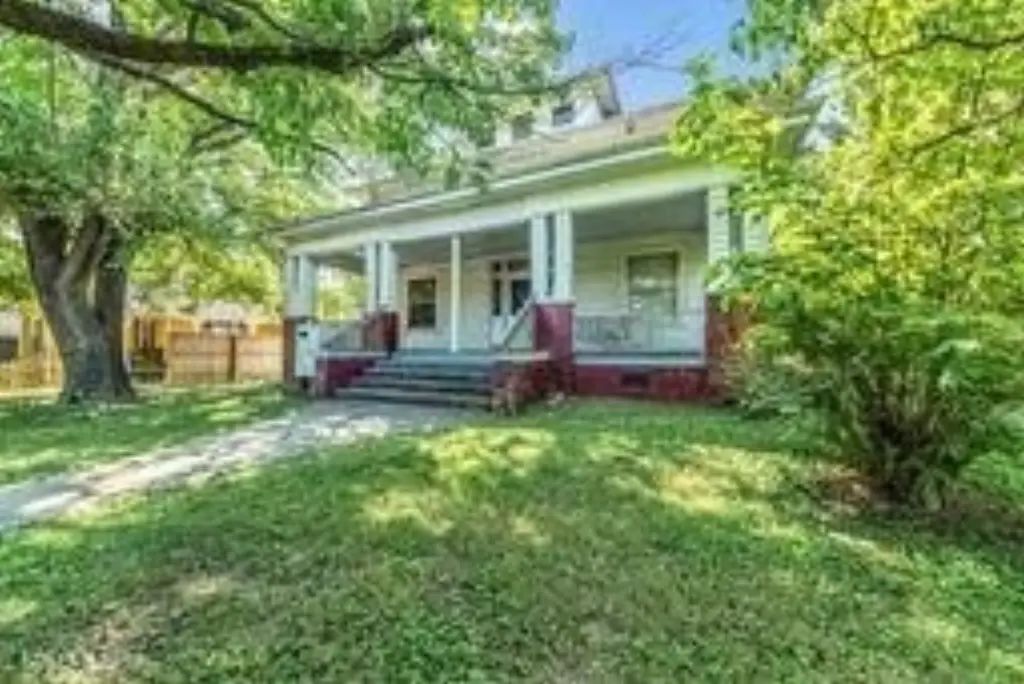
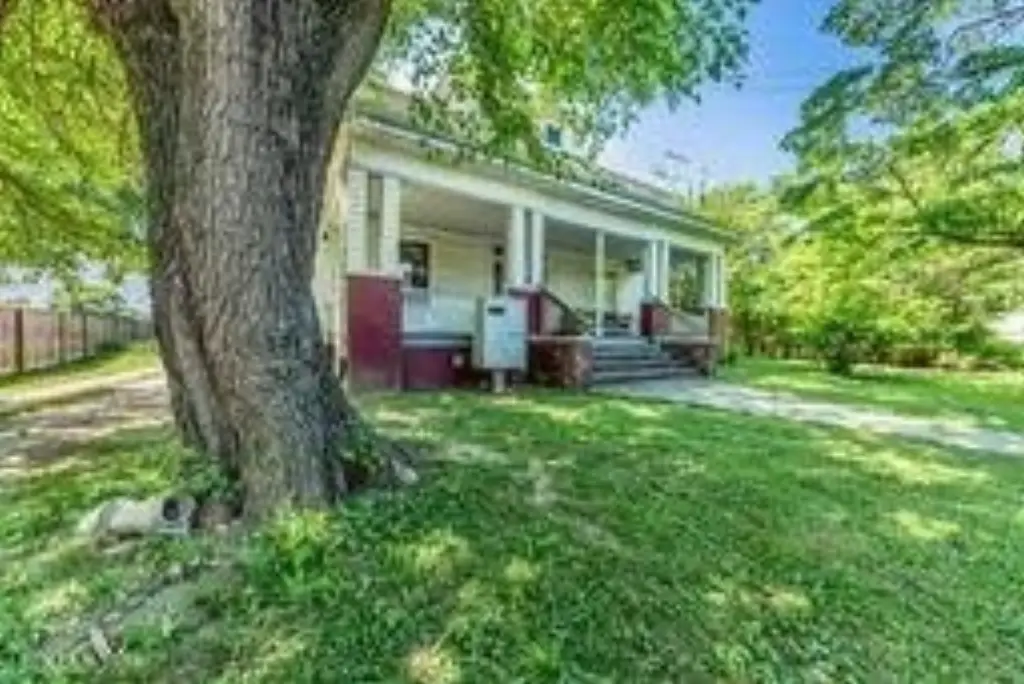
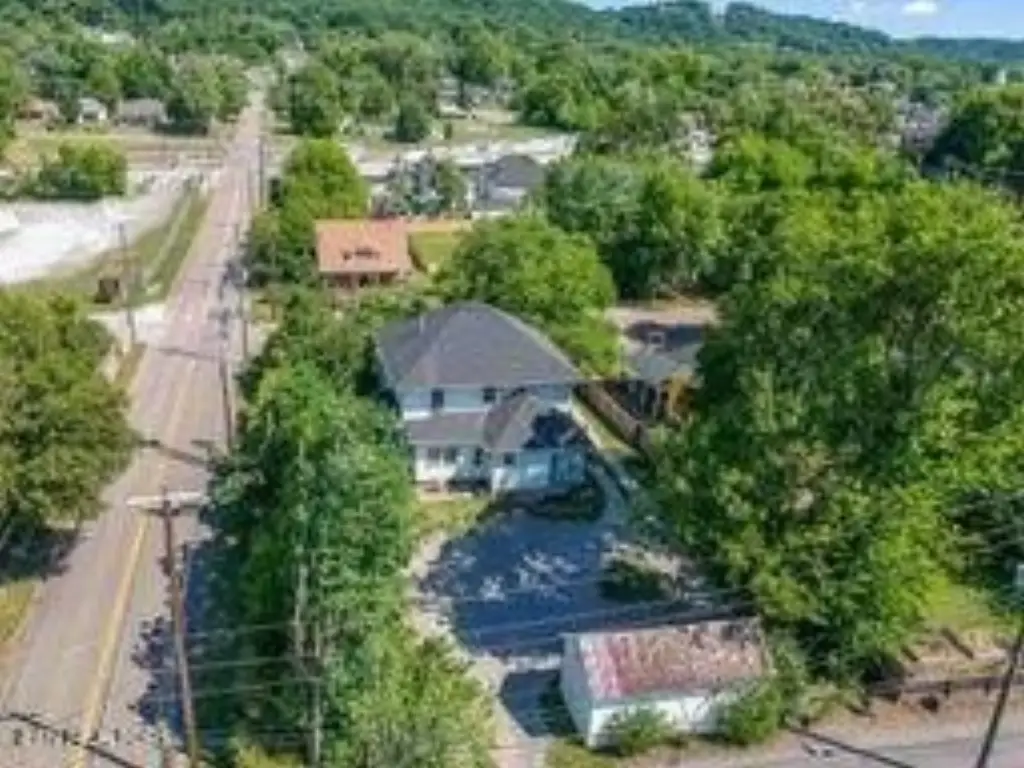
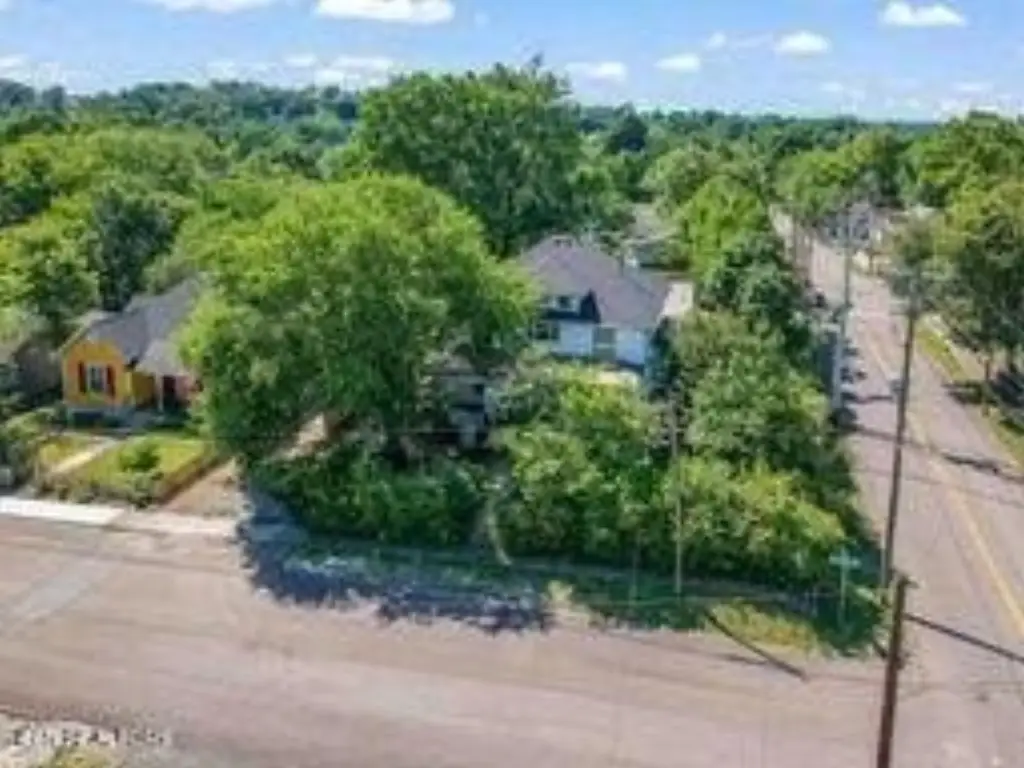
For Sale
$504,000
Pending
600 Radford Place, Knoxville, TN 37917
Multi-Family, Knoxville, TN
Property Size3,618 SF
Lot Size0.29 Acres
Days on Market150
Property Features for 600 Radford Place
General Information
Property type
Residential Multi Family
Property subtype
Other
Bedrooms
5
Full bathrooms
5
Rooms
Bedroom 4, Bathroom 3, Bathroom 4, Bedroom 3, Bedroom 2, Bedroom 5, Bathroom 5, Bathroom 1, Bathroom 2, Bedroom 1
Parking features
Off Street
Appliances
Range, Refrigerator
Subdivision
Scotts Park Add
Elementary school
Christenberry
Middle school
Whittle Springs
High school
Fulton
Directions
I-275N to Heiskell Ave. Take exit 2 Central St/Heiskell Ave. Right on Heiskell Ave. Go under tunnel to merge right to red light. Go to Atlantic Ave straight. To right on Pershing. Left on Radford Place. House on right at the corner.
Standard status
Pending
APN
081CL012
Size
3,618 SF
Lot size
0.29 Acres
Taxes and HOA fees
Tax Annual Amount
4441
Utilities
Heating system
Electric (Heating), Space Heater, Natural Gas
Cooling system
Window Unit(s)
Amenities
off-street parking
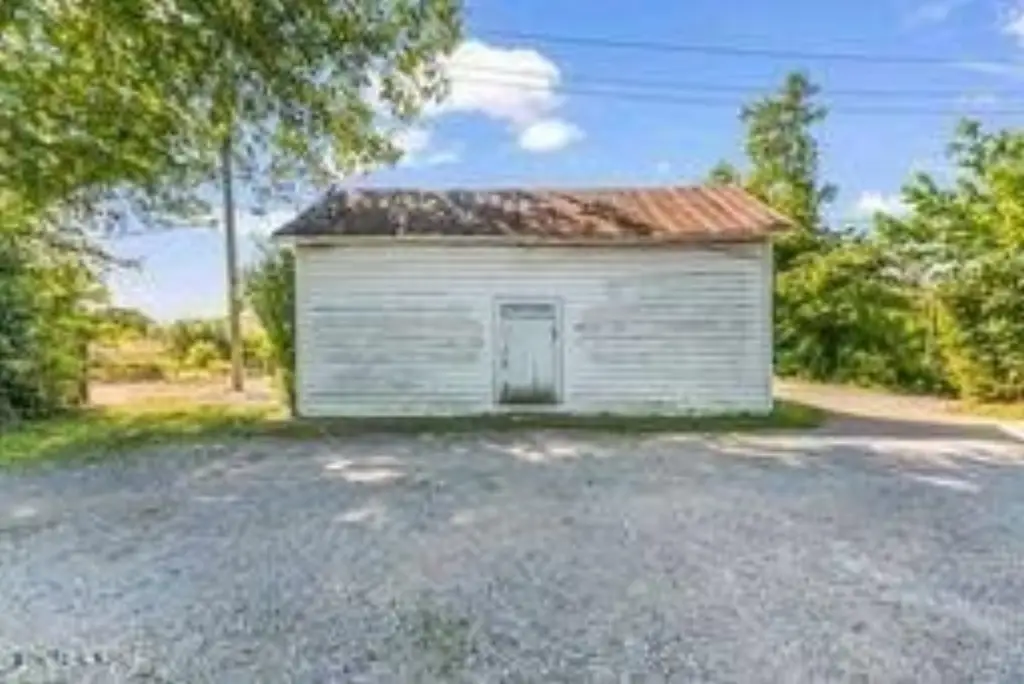
storage building
Building Details
Year built
1910
Number of units
5
Flooring type
Hardwood
Building materials
Frame
Roof type
Shingle, Asphalt
Listing Agency:
The Real Estate Firm, Inc.
(865) 770-4030
Listed By:
Fredda Augusta Temples
(865) 659-4024
Added: May 21
Changed: Oct 8
Last Checked: Oct 17 at 10:06AM
MLS# 1341904
Copyright © 2026 East Tennessee Realtors®. All rights reserved. All information provided by the listing agent/broker is deemed reliable but is not guaranteed and should be independently verified.

Ask AI about this property
Review the available facts, identify missing information and prepare questions for the agent.
Investment Insights
Based on property information with market context.
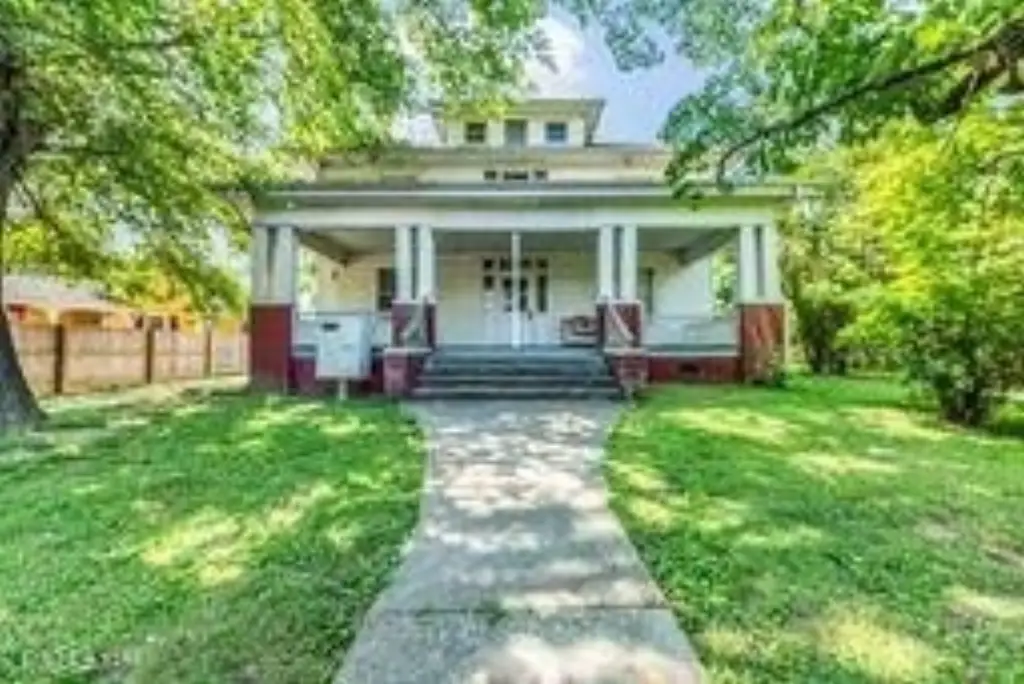
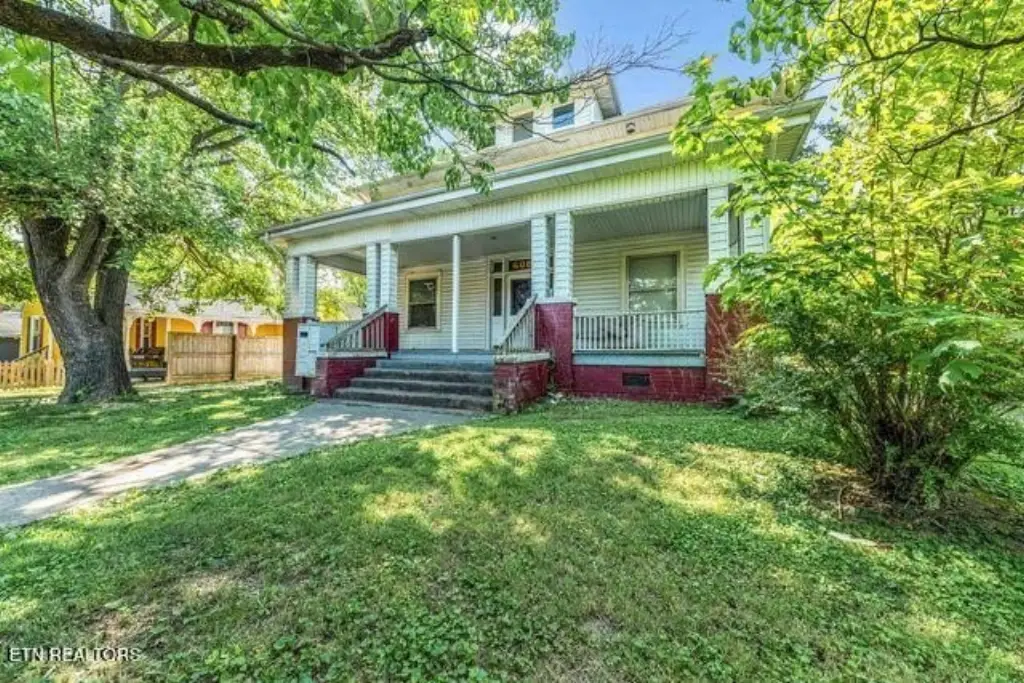
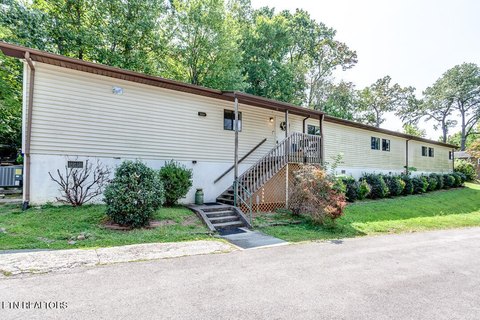
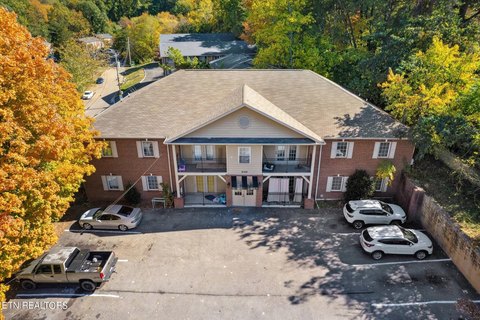
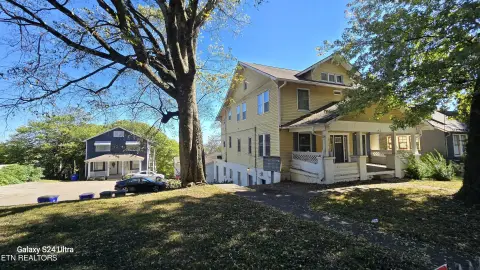
This 3,618-square-foot apartment property contains five rental units on a 0.29-acre corner lot. The building dates to 1910 and includes spacious main-level residences with high ceilings and hardwood floors. Frame construction, low-maintenance siding, a newer shingle and asphalt roof, window-unit cooling, and off-street parking serve the property. A large rear storage building is also available for owner use.
Electrical and plumbing improvements were completed in 2025, and each unit has a new water heater. Separate water meters were installed by KUB, with new water lines serving the units during 2025-2026. Four units are occupied under month-to-month leases; Unit 5 is vacant and requires repairs related to water intrusion that has been remedied.
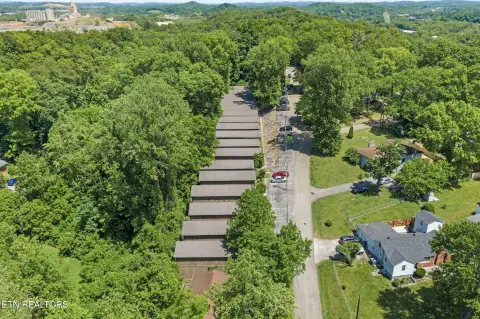
The property is in Lincoln Park near Downtown Knoxville and the University of Tennessee. Restaurants, schools, churches, and shopping are within walking distance.
Electrical and plumbing improvements were completed in 2025, and each unit has a new water heater. Separate water meters were installed by KUB, with new water lines serving the units during 2025-2026. Four units are occupied under month-to-month leases; Unit 5 is vacant and requires repairs related to water intrusion that has been remedied.
The property is in Lincoln Park near Downtown Knoxville and the University of Tennessee. Restaurants, schools, churches, and shopping are within walking distance.
Key Highlights
- Five‑unit apartment property with 3,618 square feet on 0.29 acres
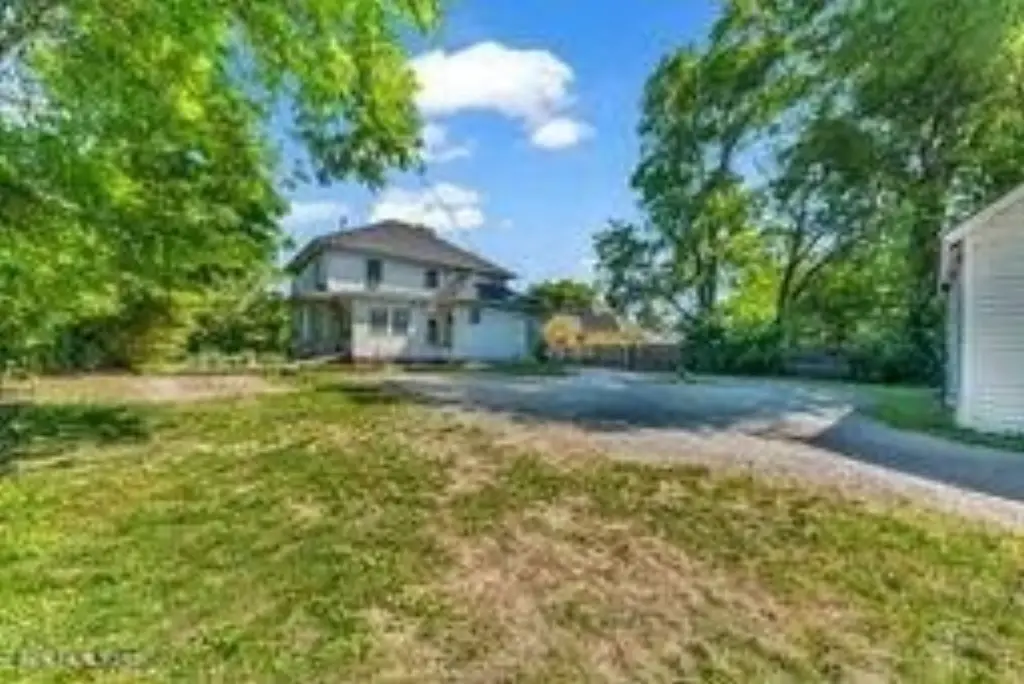
- Corner‑lot setting with off‑street parking and a large rear storage building
- Electrical and plumbing updates completed in 2025
Financial Insights
Estimated NOI and Cap Rate
NOI / Yr
$32,469
Cap Rate
6.44%
Suggested Prices Based on Cap Rates
Cap Rate 5%
$649,380
$649.4K
Cap Rate 7%
$463,843
$463.8K
Cap Rate 9%
$360,767
$360.8K
Market Conditions
NOI Build-Up for 3,618 SF
Gross rent
$63.8K $17.64/SF
− Vacancy
−$4.8K −$1.32/SF
EGI
$59.0K $16.32/SF
− OpEx
−$26.6K −$7.34/SF
NOI
$32.5K $8.97/SF
Area
Knoxville, TN
Vacancy
7.50%
Lease Rate
$17.64 /SF/Yr
Expense Ratio
45.00%
Simulate Cap Rate and NOI
Suggested Prices Based on Cap Rates
Cap Rate 5%
$649,380
Cap Rate 7%
$463,843
Cap Rate 9%
$360,767
Alternative Uses
Best Use
Apartment 5plus
$463.8K
$405.9K – $541.2K
NOI $32,469 @ 7.0% cap · market cap 6.44%
Second Best
—
—
no second resolved use
Theoretical Best
Office A
$896.1K
$784.1K – $1.05M
NOI $62,727 @ 7.0% cap · market cap 12.45%
Zoning and permitted uses should be independently verified with authorities.
How Realmo checks its estimates
Property Analytics
Unlock full access to Insights
Subscribe to Realmo Intelligence
Open Analytics
Current Use
Lease Details
5
Residential units
Yes
Utilities to site
Location Intelligence
Trade Area within ½ mile
872
Businesses Nearby
Explore this area
Business Placement
Demographics for 37917, TN
25,013
Population
14,216
Households
1.8
Avg Household Size
39
Median Age
31%
College-Educated
87%
High-School Grad
9.5 sq mi
ZIP Area
2,633
Density / Sq Mi
$51,232
Median Household Income
$37,853
Median Earnings
$1,063
Median Rent
$189,100
Median Home Value
Check the figures for this property
Cap Rate, Value Estimation, Potential NOI and more
View Realmo Analytics
Market
Vacancy Rate% for Multifamily in South region



Frequently Asked Questions
What type of property is this?
Apartment building - Corner-lot rental property with off-street parking, updated utility systems, and hardwood flooring in the main-level units.
Where is this apartment building located?
The property is located at 600 Radford Place Knoxville, TN.
What is the asking price?
The asking price for this property is $504,000.
What are key features of this property?
This property features: Five‑unit apartment property with 3,618 square feet on 0.29 acres; Corner‑lot setting with off‑street parking and a large rear storage building; Electrical and plumbing updates completed in 2025