Mixed-Use Property with Separate
For Sale
$699,000
5949 N ALBINA Ave, Portland, OR 97217
CommercialSale, Portland, OR
Property Size1,632 SF
Lot Size0.12 Acres
Price / SF$428.31
Days on Market60
Property Features for 5949 N ALBINA Ave
General Information
Property type
Commercial Sale
Property subtype
Other
Zoning
RM2
Directions
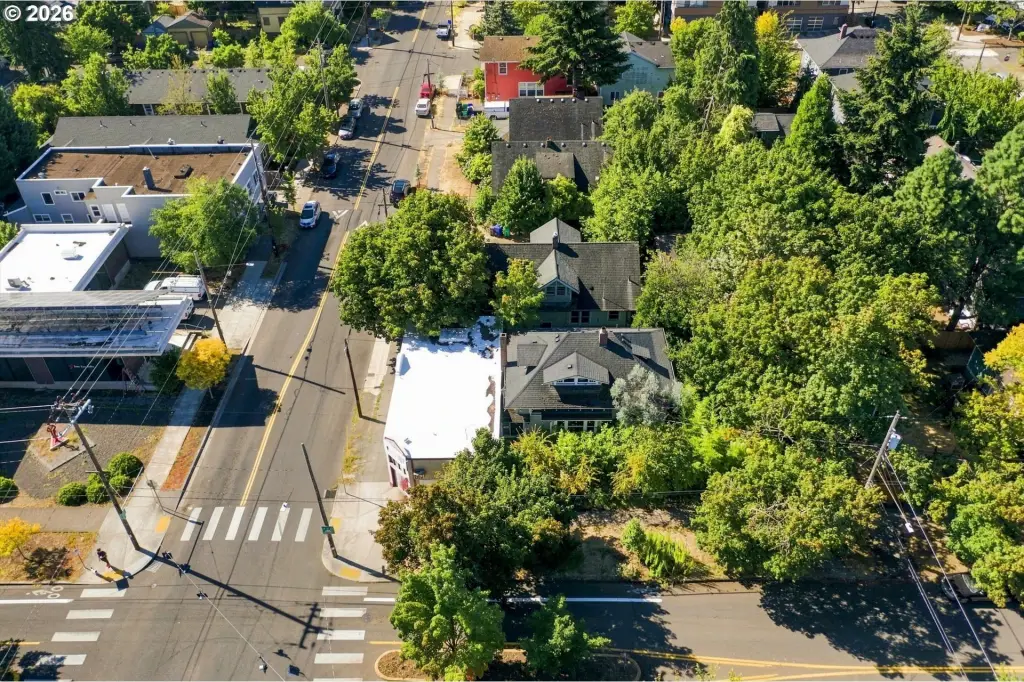
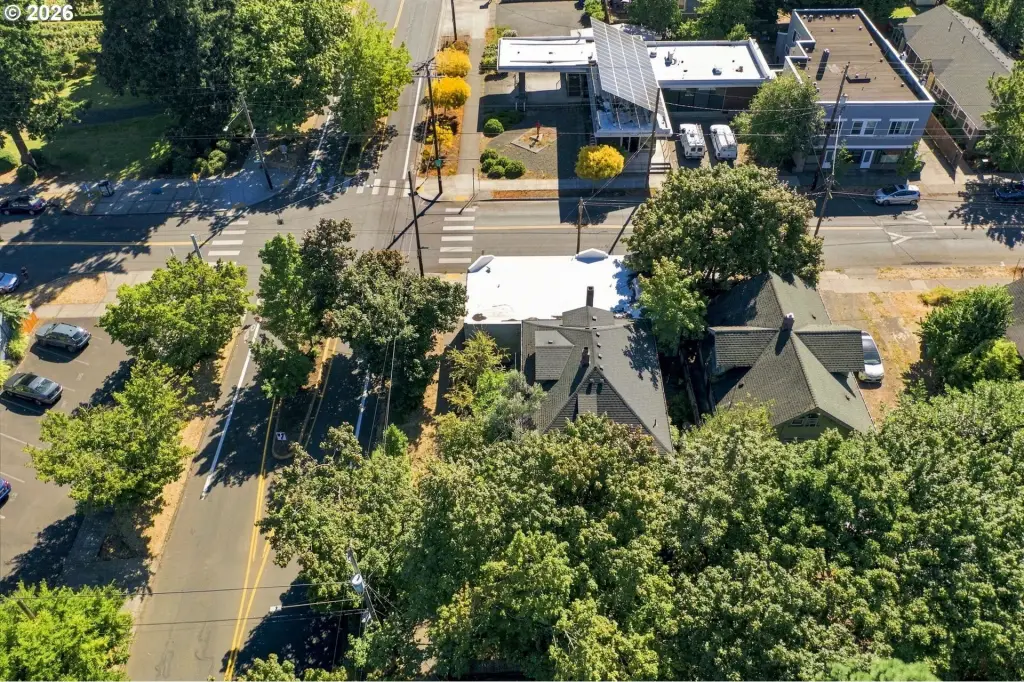
At the corner of Albina and Ainsworth
Subdivision
_141
Standard status
Active
APN
R301459
Size
1,632 SF
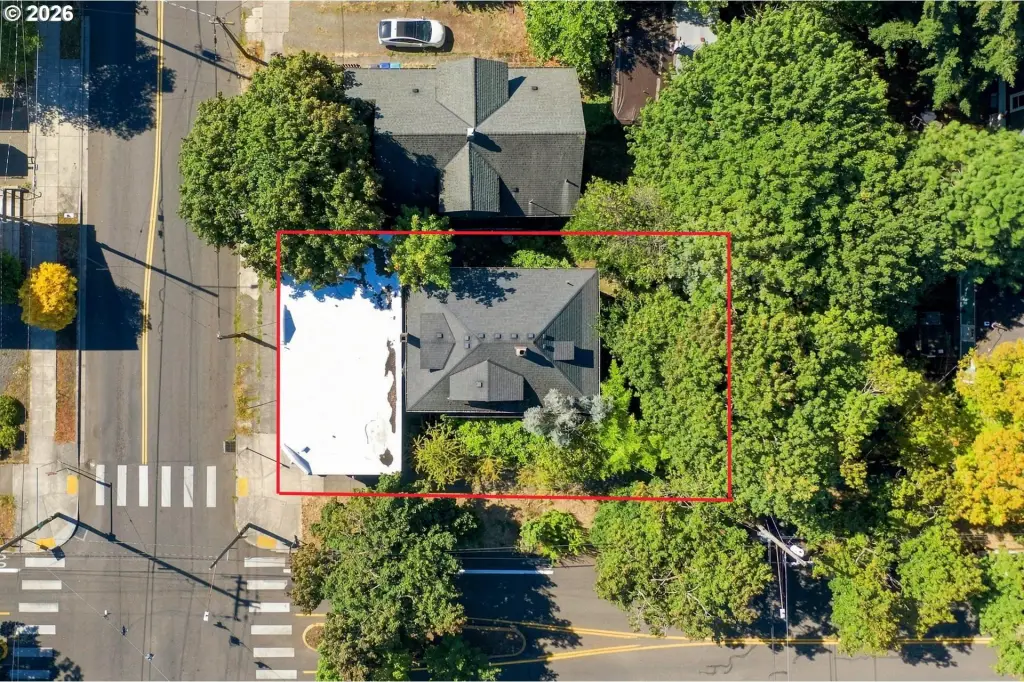
Lot size
0.12 Acres
Taxes and HOA fees
Tax Description
WEST PIEDMONT, BLOCK 14, LOT 6
Tax Annual Amount
1504
Legal Description
WEST PIEDMONT, BLOCK 14, LOT 6
Building Details
Year built
1908
Floors in Building
1
Building materials
Concrete, WoodFrame, WoodSiding
Roof type
Flat, Composition
Listing Agency:
RE/MAX Equity Group · RE/MAX International
(503) 287-8989
Listed By:
Kevin Smallbeck · License #981000145
(503) 351-4989
Added: Aug 12
Changed: Oct 9
Last Checked: Oct 10 at 10:06AM
MLS# 503257729
Copyright © 2026 Regional Multiple Listing Services. All rights reserved. All information provided by the listing agent/broker is deemed reliable but is not guaranteed and should be independently verified.
Investment Insights
Based on property information with market context.
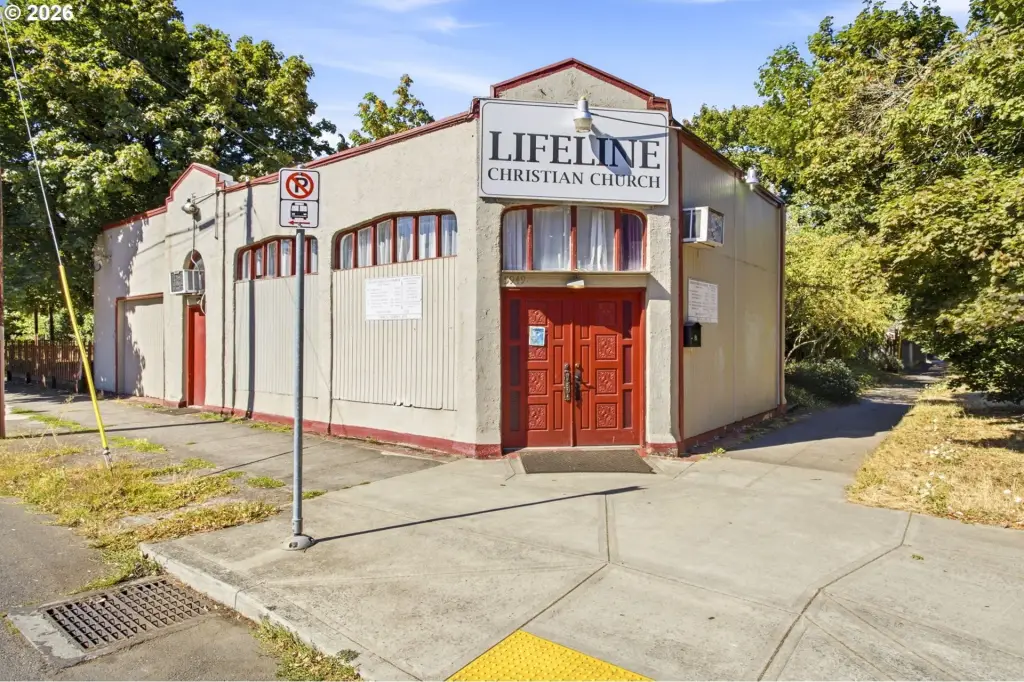
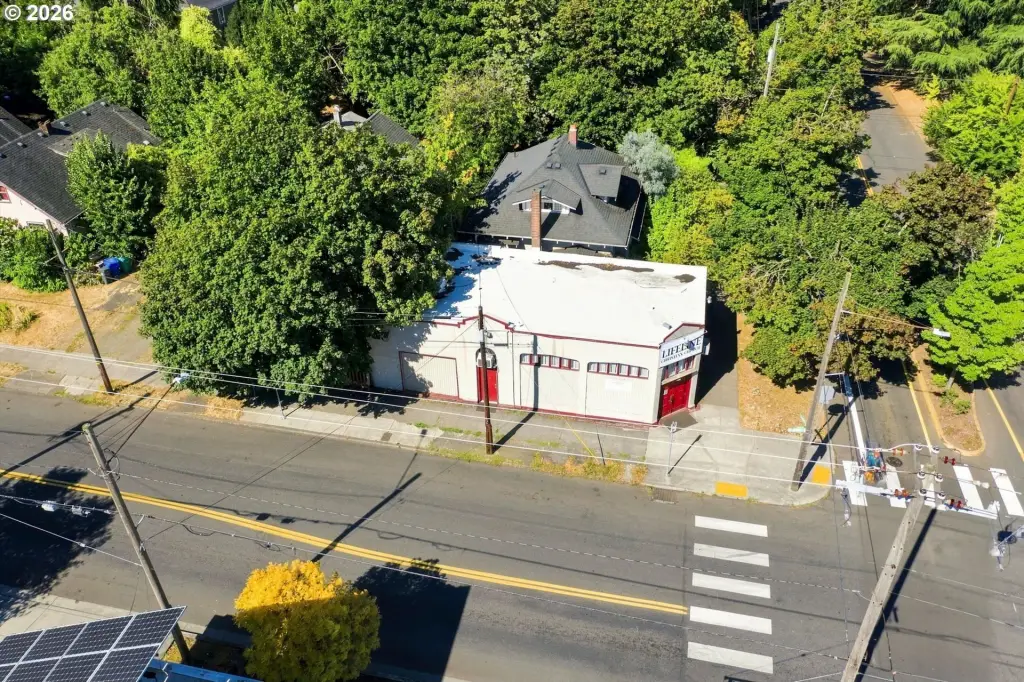
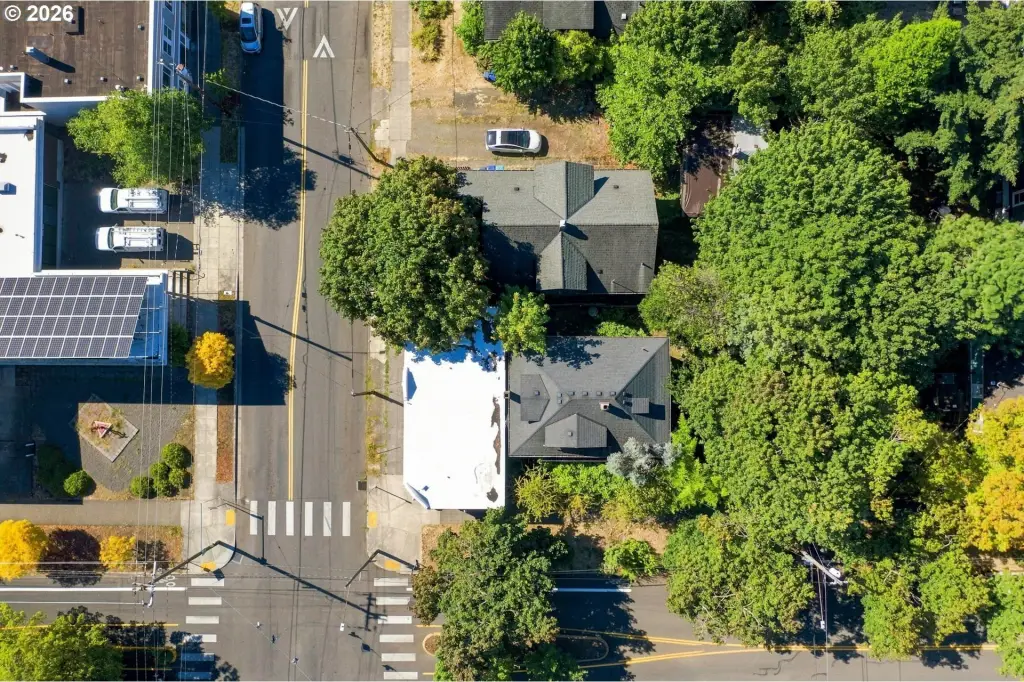
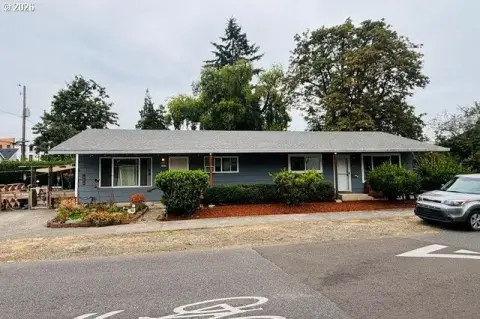
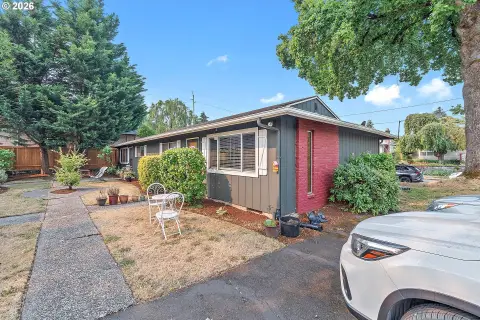
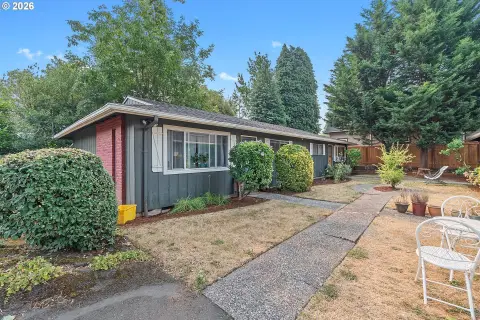
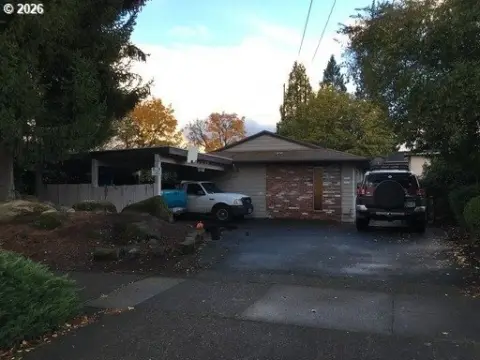
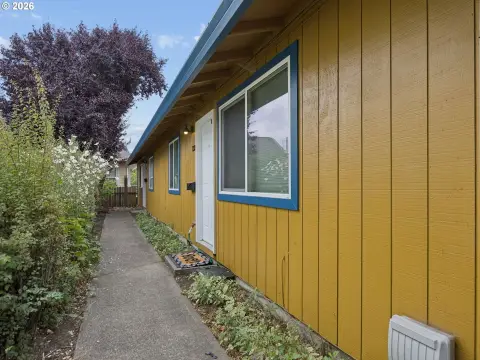
This 1,632-square-foot mixed-use property combines a commercial building with an attached single-family residence. The two components have divided areas within a shared basement and operate with separate utilities. Built in 1908, the property includes concrete, wood-frame, and wood-siding construction along with flat and composition roofing. Both existing tenants occupy their respective spaces on a month-to-month basis.
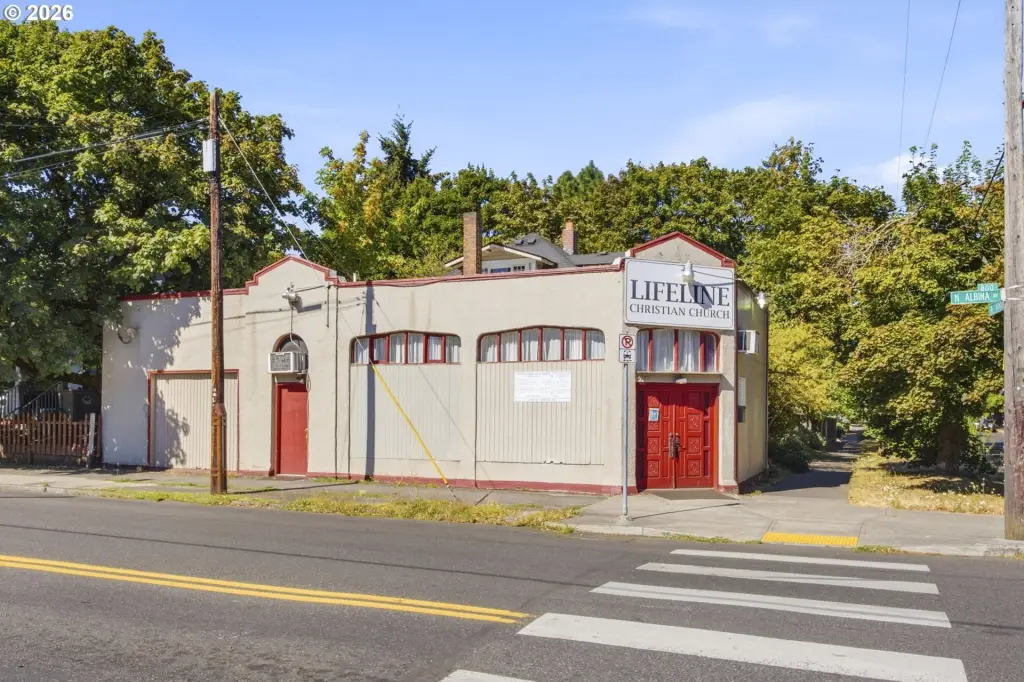
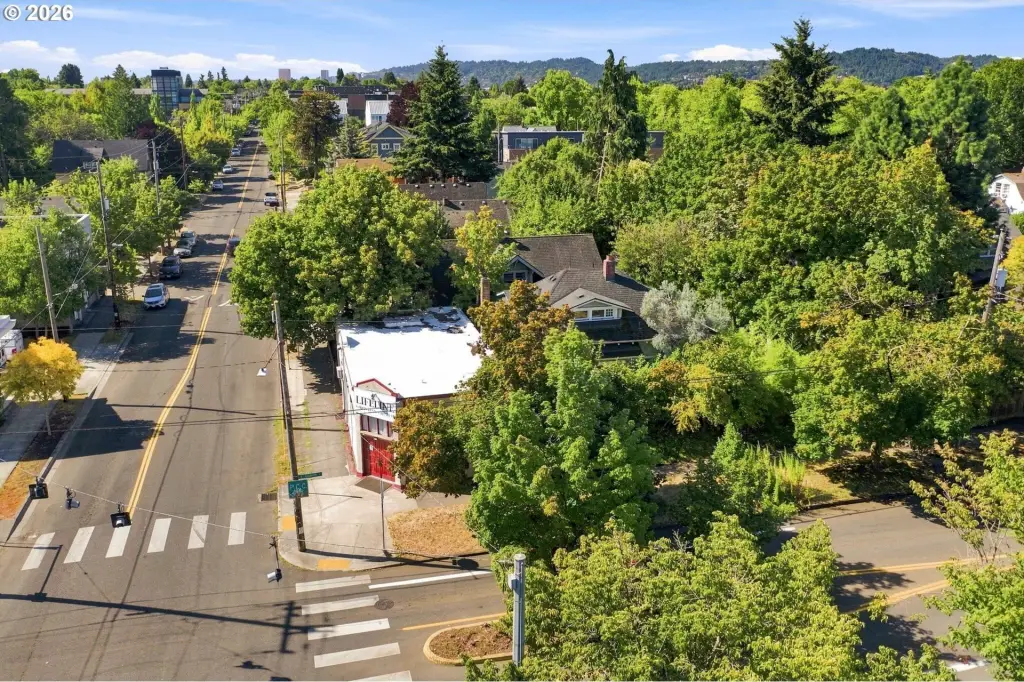
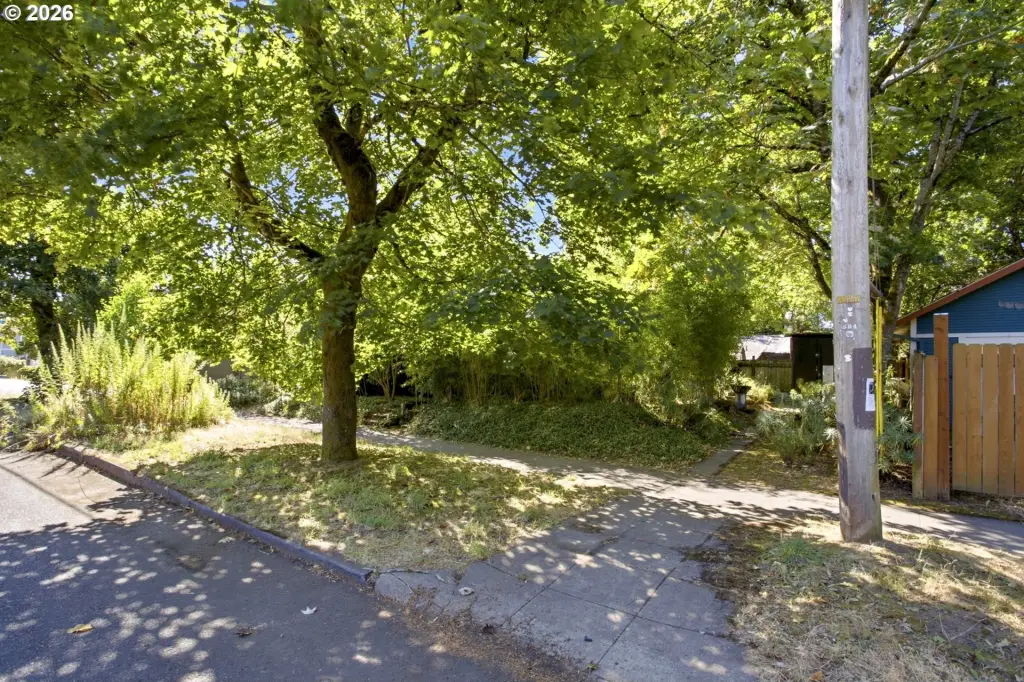
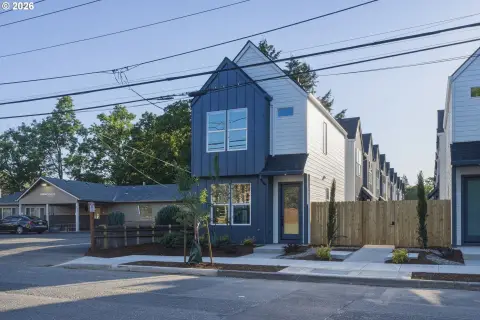
The 0.12-acre site occupies the corner of N Albina Avenue and N Ainsworth Street in Portland, directly opposite Peninsula Park. The property is a few blocks from I-5 and has access to nearby transit. RM2 zoning applies; permitted uses, development options, dimensional standards, and required approvals should be confirmed with the City of Portland.
The 0.12-acre site occupies the corner of N Albina Avenue and N Ainsworth Street in Portland, directly opposite Peninsula Park. The property is a few blocks from I-5 and has access to nearby transit. RM2 zoning applies; permitted uses, development options, dimensional standards, and required approvals should be confirmed with the City of Portland.
Key Highlights
- 1,632 SF mixed‑use property with attached commercial building and single‑family residence
- 0.12‑acre corner site at N Albina Avenue and N Ainsworth Street
- Separate utilities serve the commercial and residential components
Financial Insights
Estimated NOI and Cap Rate
NOI / Yr
$22,032
Cap Rate
3.15%
Suggested Prices Based on Cap Rates
Cap Rate 5%
$440,640
$440.6K
Cap Rate 7%
$314,743
$314.7K
Cap Rate 9%
$244,800
$244.8K
Market Conditions
NOI Build-Up for 1,632 SF
Gross rent
$39.2K $24.00/SF
− Vacancy
−$3.9K −$2.40/SF
EGI
$35.3K $21.60/SF
− OpEx
−$13.2K −$8.10/SF
NOI
$22.0K $13.50/SF
Area
Portland, OR
Vacancy
10.00%
Lease Rate
$24.00 /SF/Yr
Expense Ratio
37.50%
Simulate Cap Rate and NOI
Suggested Prices Based on Cap Rates
Cap Rate 5%
$440,640
Cap Rate 7%
$314,743
Cap Rate 9%
$244,800
Alternative Uses
Best Use
Mixed Use
$314.7K
$275.4K – $367.2K
NOI $22,032 @ 7.0% cap · market cap 3.15%
Second Best
Apartment 5plus
$299.4K
$261.9K – $349.3K
NOI $20,955 @ 7.0% cap · market cap 3.00%
Theoretical Best
Office A
$458.3K
$401.0K – $534.7K
NOI $32,081 @ 7.0% cap · market cap 4.59%
Zoning and permitted uses should be independently verified with authorities.
Property Analytics
Unlock full access to Insights
Subscribe to Realmo Intelligence
Open Analytics
Current Use
Lease Details
1
Residential units
Multi-tenant
Tenancy
Yes
Highway access
Yes
Paved road access
Yes
Utilities to site
Location Intelligence
Trade Area within ½ mile
960
Businesses Nearby
Explore this area
Business Placement
Demographics for 97217, OR
36,086
Population
17,038
Households
2.1
Avg Household Size
38
Median Age
59%
College-Educated
96%
High-School Grad
11.1 sq mi
ZIP Area
3,251
Density / Sq Mi
$100,387
Median Household Income
$56,790
Median Earnings
$1,789
Median Rent
$569,500
Median Home Value
Check the figures for this property
Cap Rate, Value Estimation, Potential NOI and more
View Realmo Analytics

Questions? Ask Rey
Realmo’s AI knows this listing — price, zoning, demand, history. Ask anything.



Frequently Asked Questions
What type of property is this?
Mixed-use property - Attached commercial and residential spaces offer separate utilities, divided basement areas, and month-to-month occupancy.
Where is this mixed-use property located?
The property is located at 5949 N ALBINA Ave Portland, OR.
What is the asking price?
The asking price for this property is $699,000.
What are key features of this property?
This property features: 1,632 SF mixed‑use property with attached commercial building and single‑family residence; 0.12‑acre corner site at N Albina Avenue and N Ainsworth Street; Separate utilities serve the commercial and residential components


