Renovated Mixed-Use
For Sale
$419,900
5549 N 5TH Street, Philadelphia, PA 19120
Multi-Family, PHILADELPHIA, PA
Property Size1,950 SF
Lot Size0.03 Acres
Price / SF$215.33
Days on Market47
Property Features for 5549 N 5TH Street
General Information
Property type
Residential Multi Family
Property subtype
Other
Rooms
Basement, Dining Room
Parking
1
Parking features
On Street, Driveway
Interior features
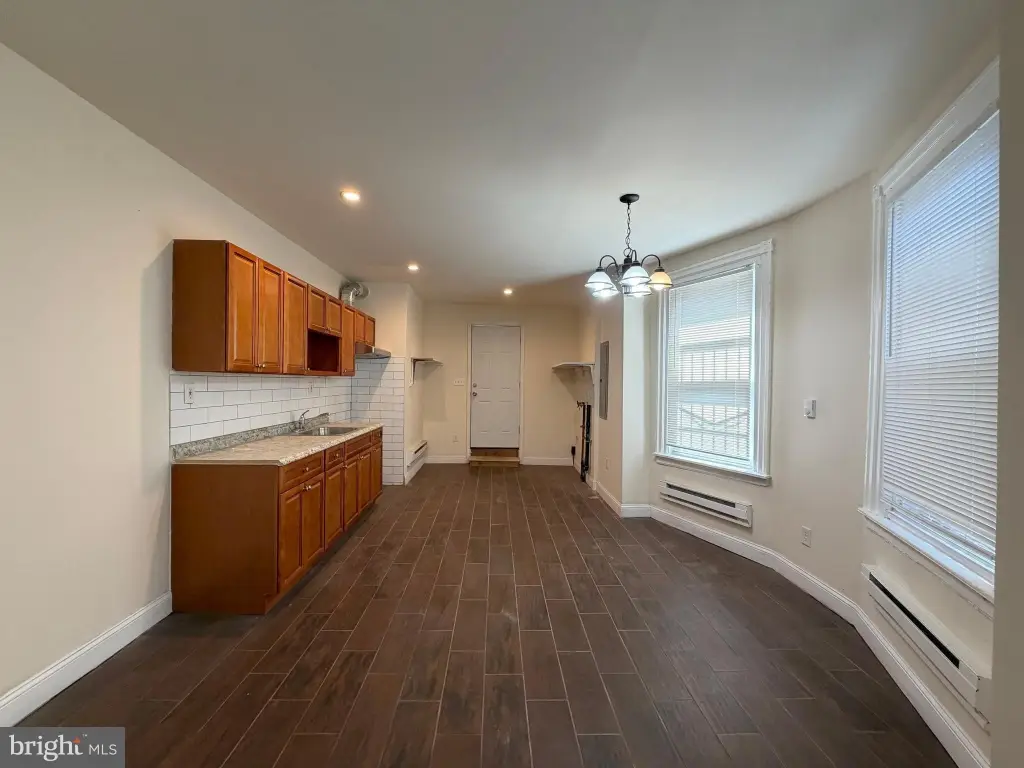
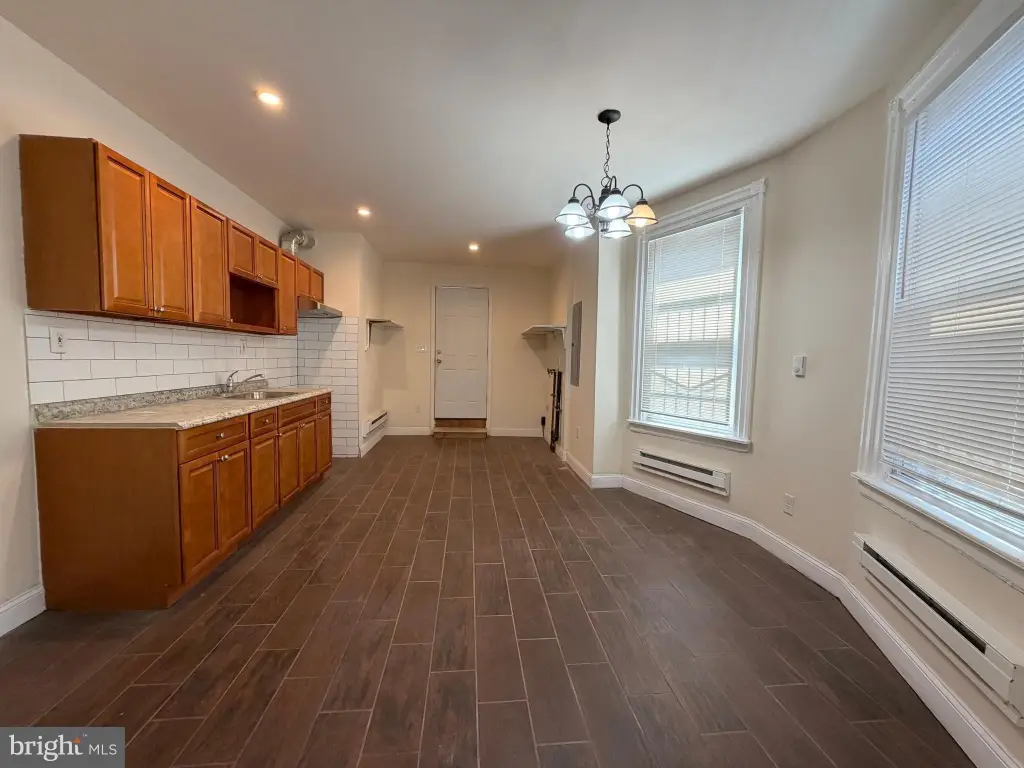
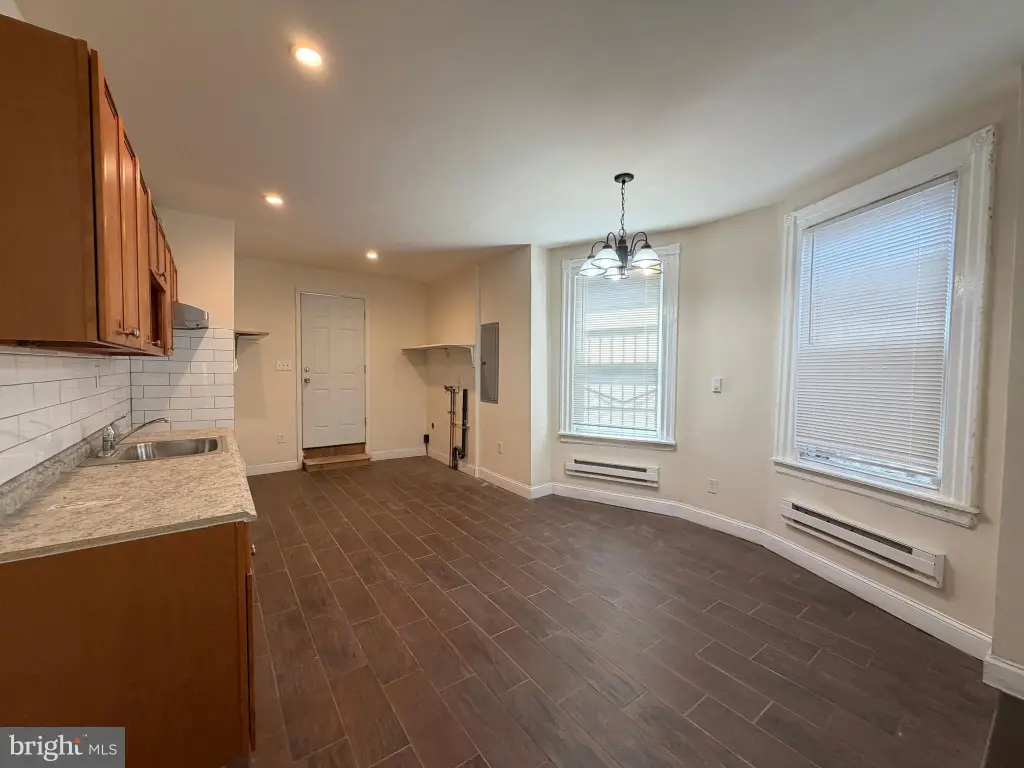
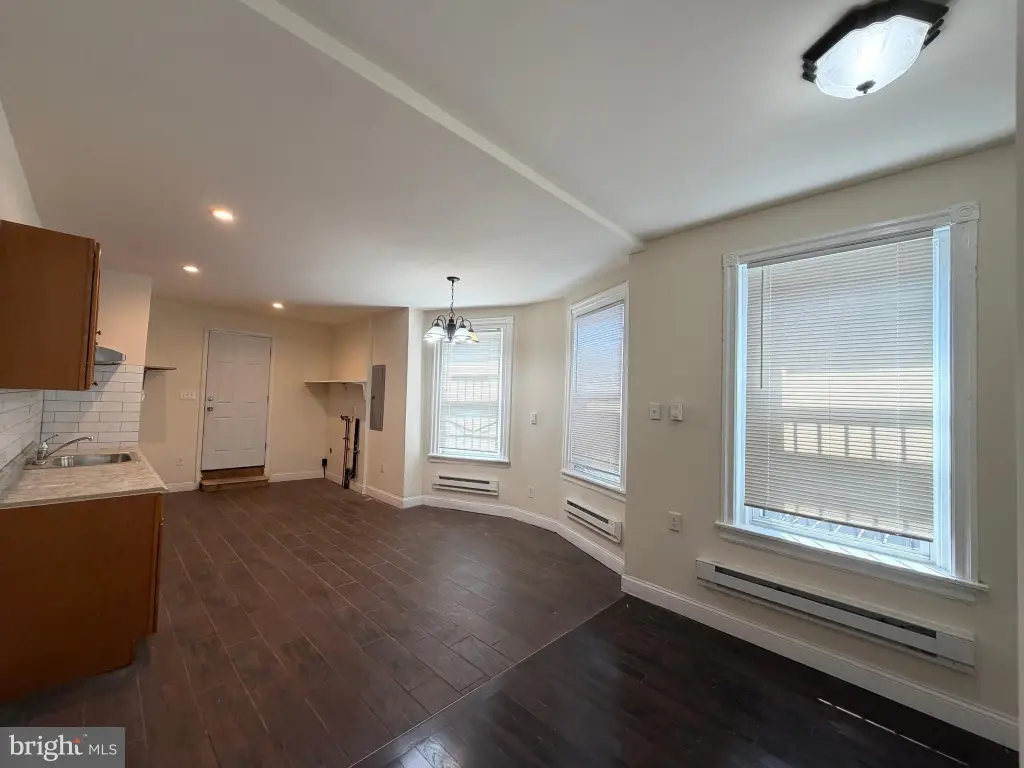
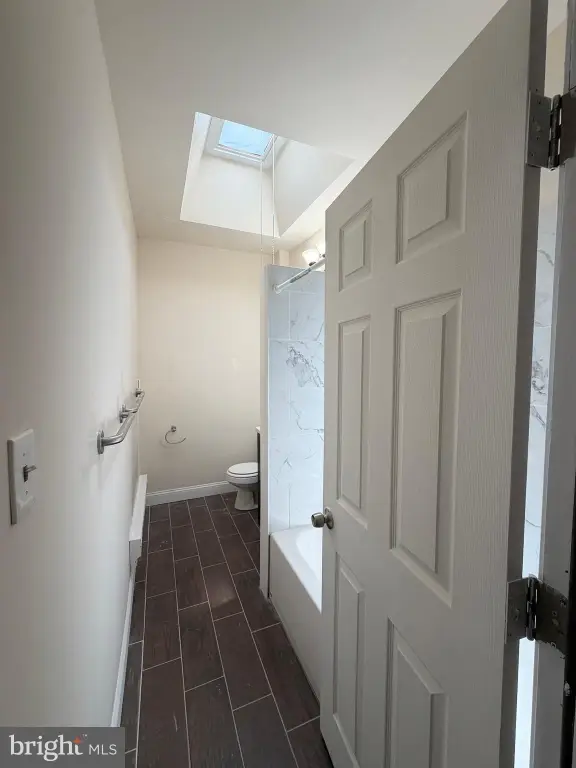
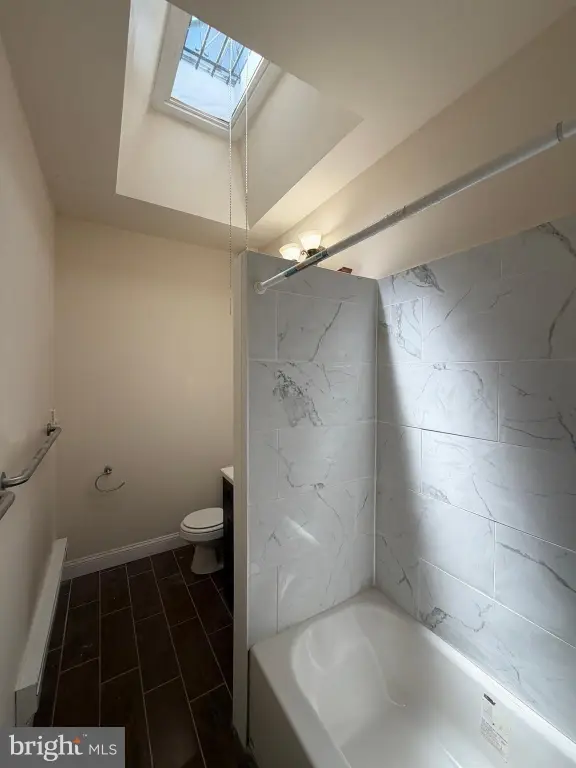
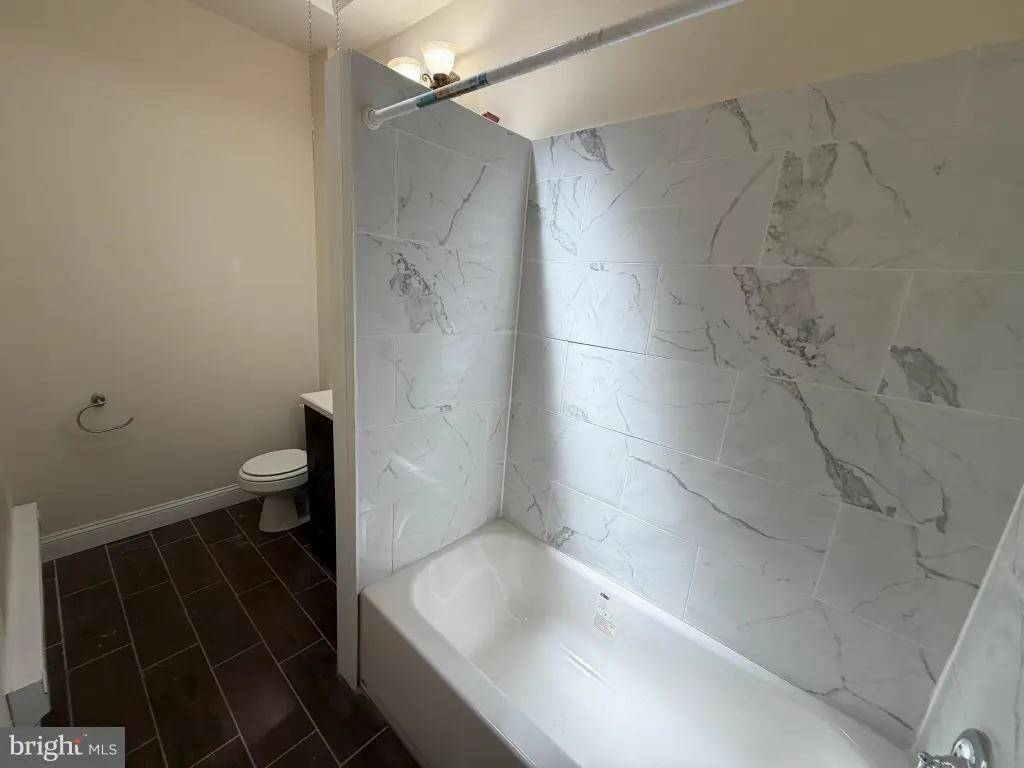
Bathroom - Tub Shower, Breakfast Area, Built-Ins, Combination Dining/Living, Combination Kitchen/Dining, Combination Kitchen/Living, Dining Area, Flat, Floor Plan - Open, Kitchen - Eat-In, Recessed Lighting, Skylight(s), Store/Office
Appliances
Built-In Range, Exhaust Fan, Oven/Range - Electric, Range Hood, Washer/Dryer Hookups Only, WaterHeater
Subdivision
OLNEY
Elementary school
JAMES R. LOWELL
Middle school
GROVER WASHINGTON JR.
High school
SAMUEL FELS
Elementary school district
THE SCHOOL DISTRICT OF PHILADELPHIA
Middle school district
THE SCHOOL DISTRICT OF PHILADELPHIA
High school district
THE SCHOOL DISTRICT OF PHILADELPHIA
Standard status
Active
Size
1,950 SF
Lot size
0.03 Acres
Taxes and HOA fees
Tax Annual Amount
2236
Utilities
Heating system
Forced Air, Central, Electric (Heating), Baseboard
Cooling system
Central Air
Building Details
Year built
1910
Number of units
2
Building materials
Masonry, Brick, Brick Front, Cast Iron Plumbing, Concrete, Copper Plumbing, CPVC/PVC, Mixed Plumbing, Mixed, Stucco, Tile, Aluminum Siding
Architectural style
Other
Listing Agency:
Century 21 Advantage Gold-South Philadelphia · Century 21 Real Estate
(215) 465-1400
Listed By:
Phong D Lam · License #RS307378
(267) 918-1880
Added: Aug 26
Changed: Sep 17
Last Checked: Oct 11 at 7:06PM
MLS# PAPH2663842
Copyright © 2026 Bright MLS. All rights reserved. All information provided by the listing agent/broker is deemed reliable but is not guaranteed and should be independently verified.
Investment Insights
Based on property information with market context.
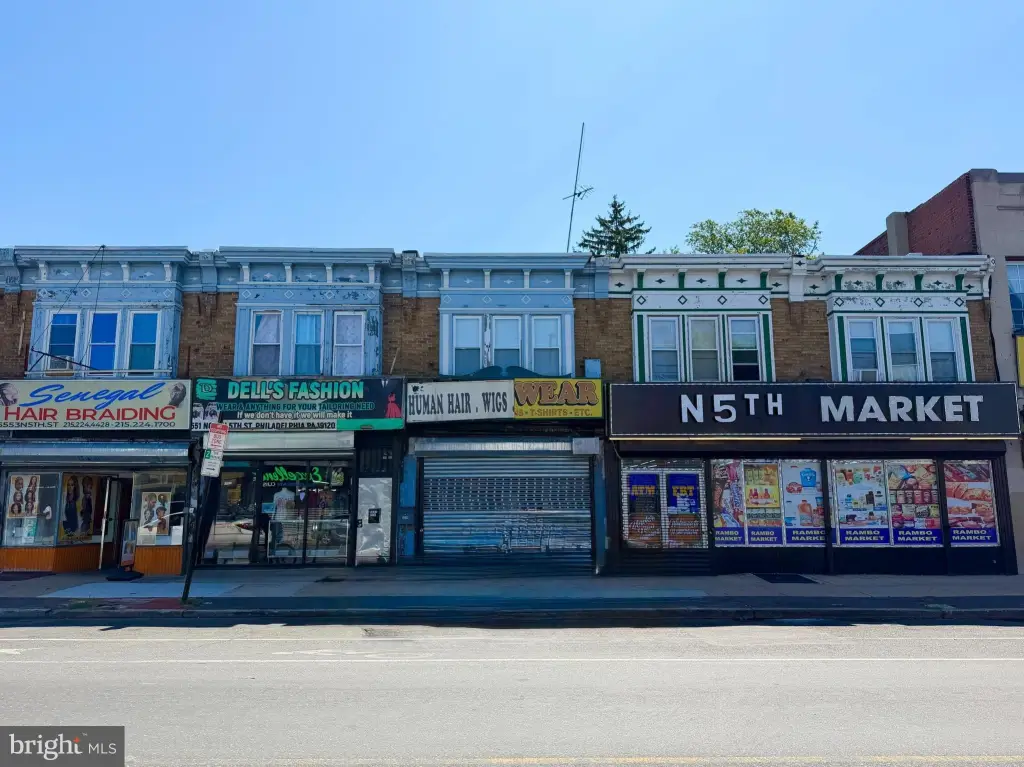
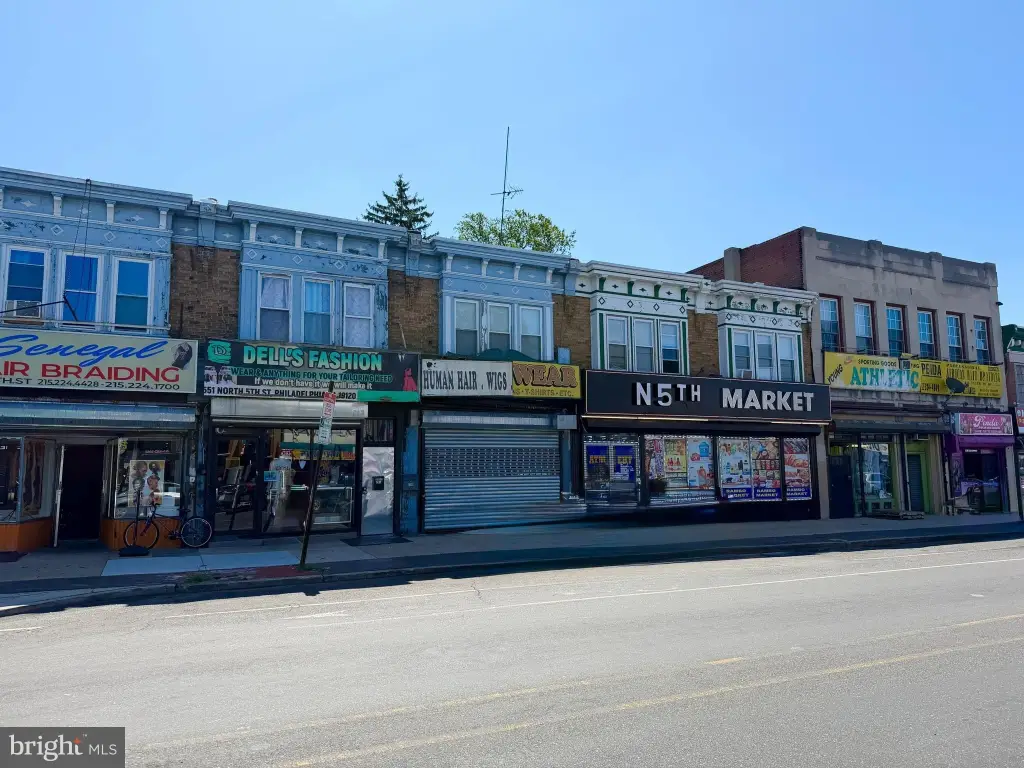
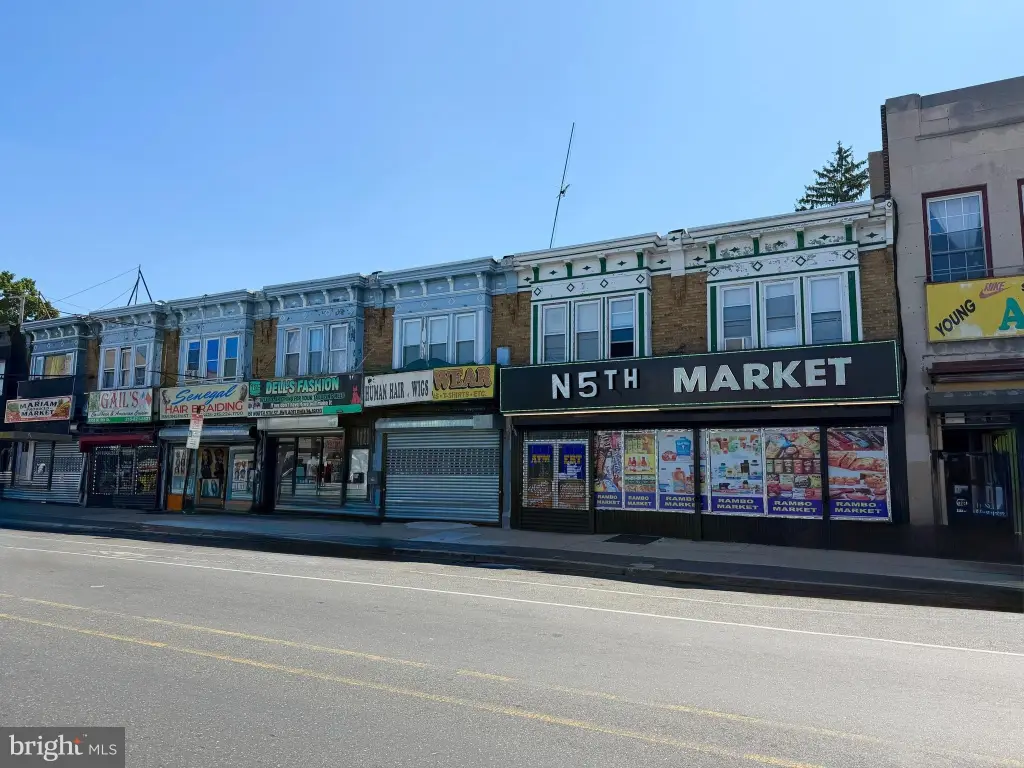
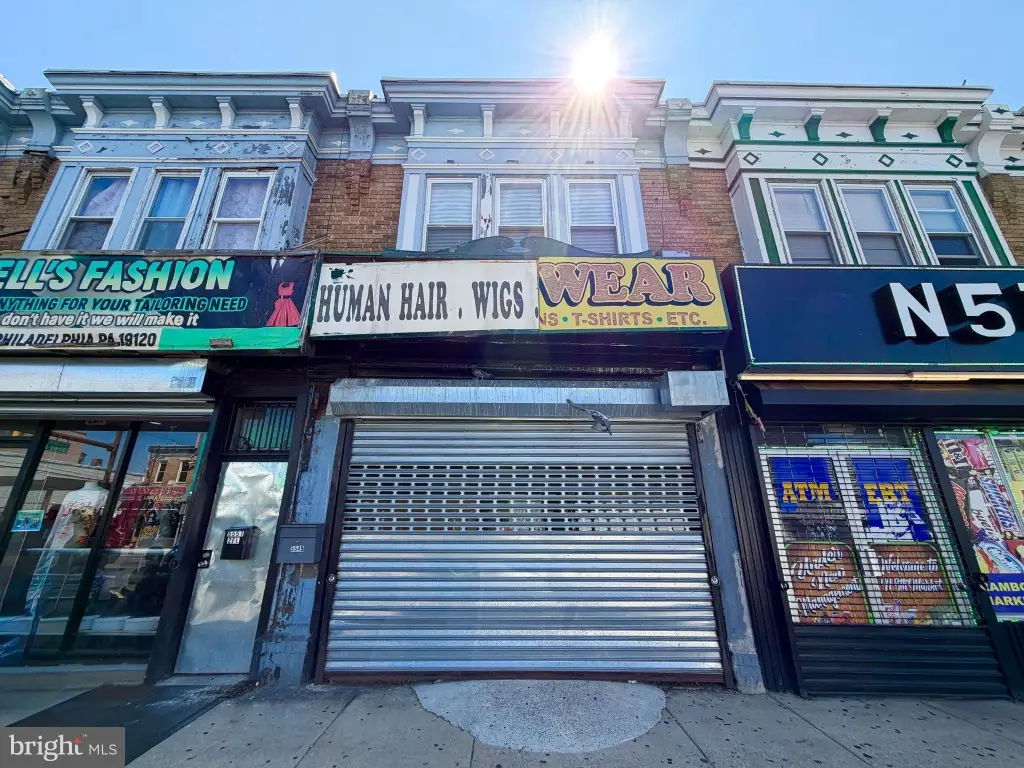
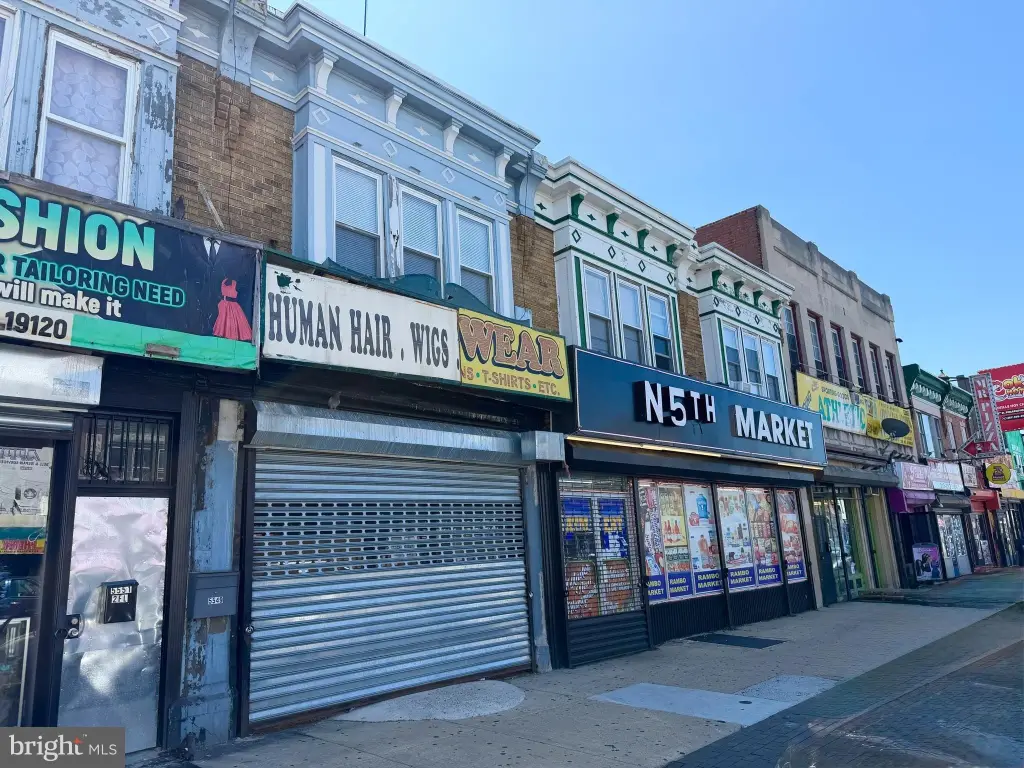
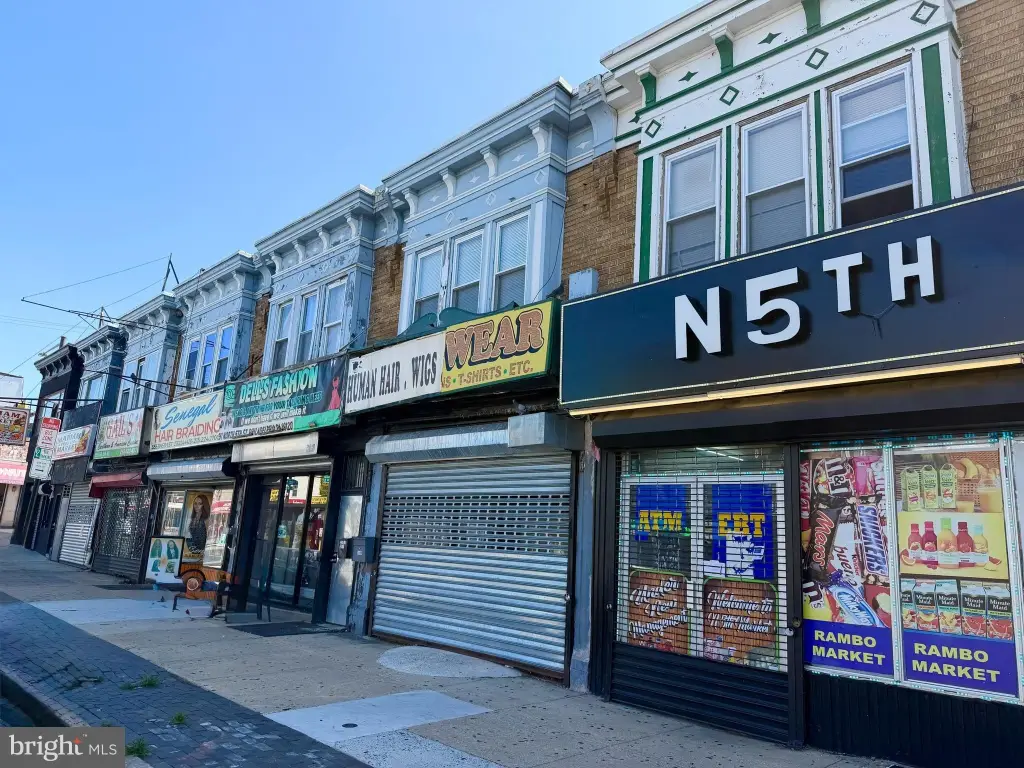
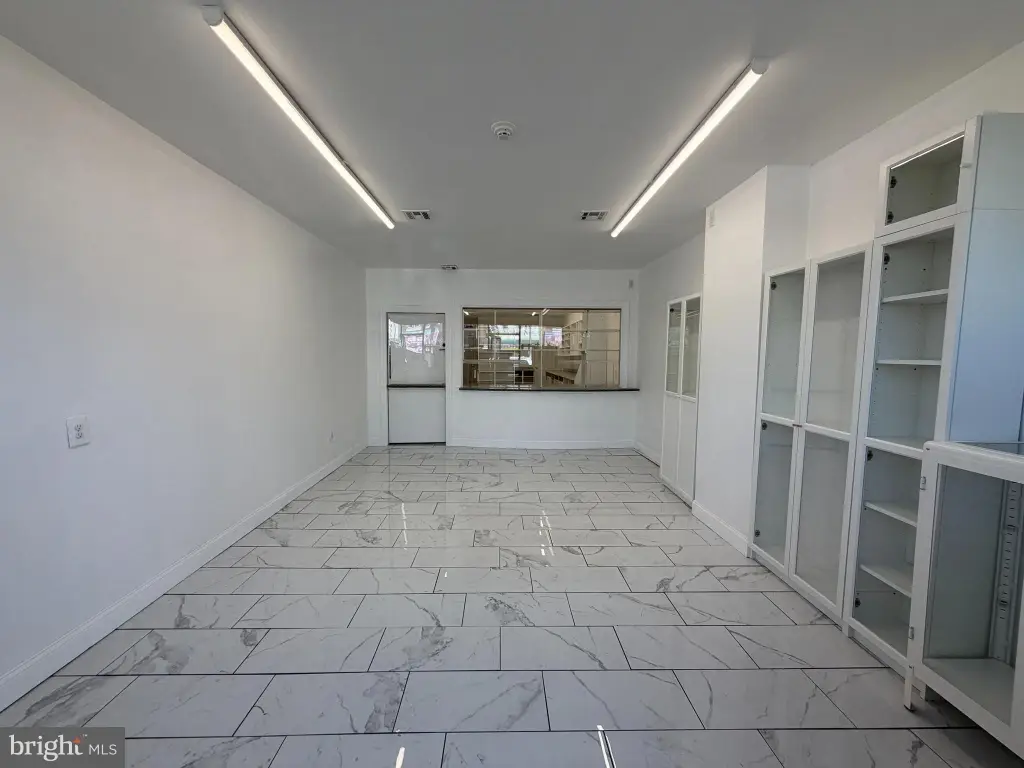
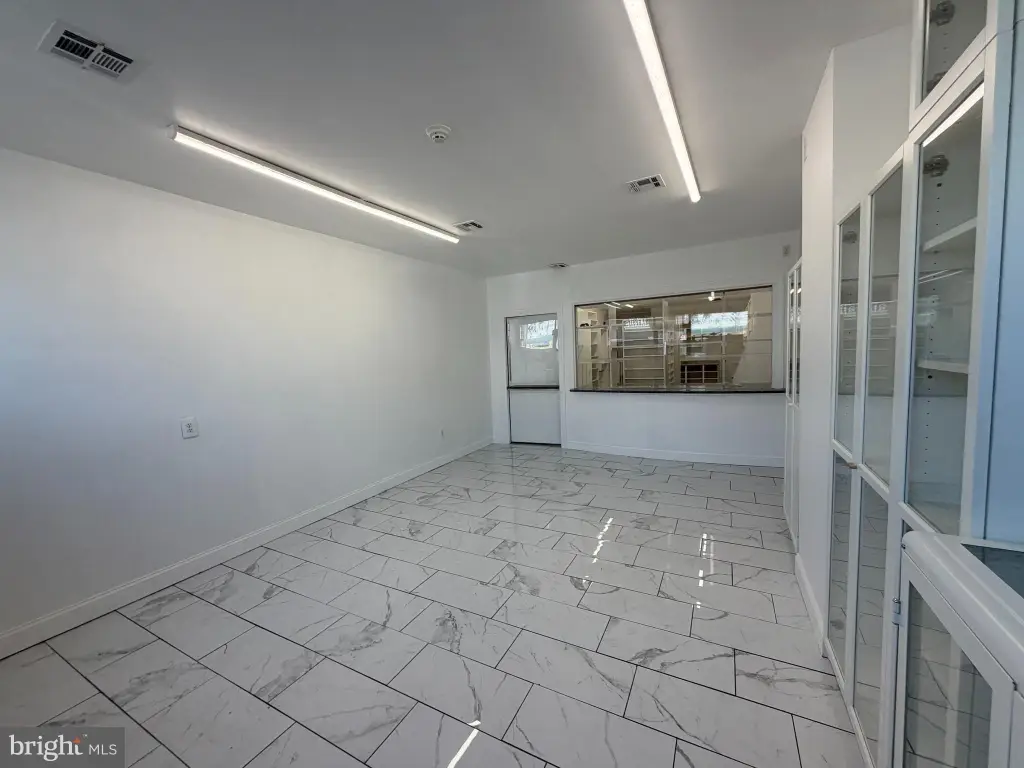
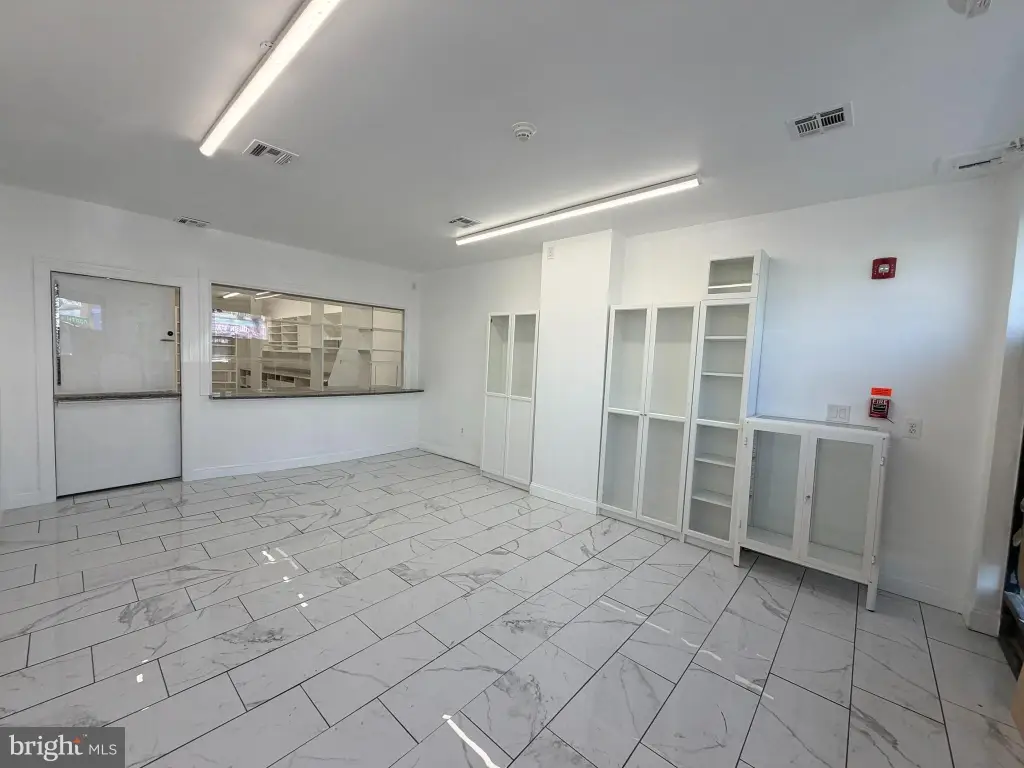
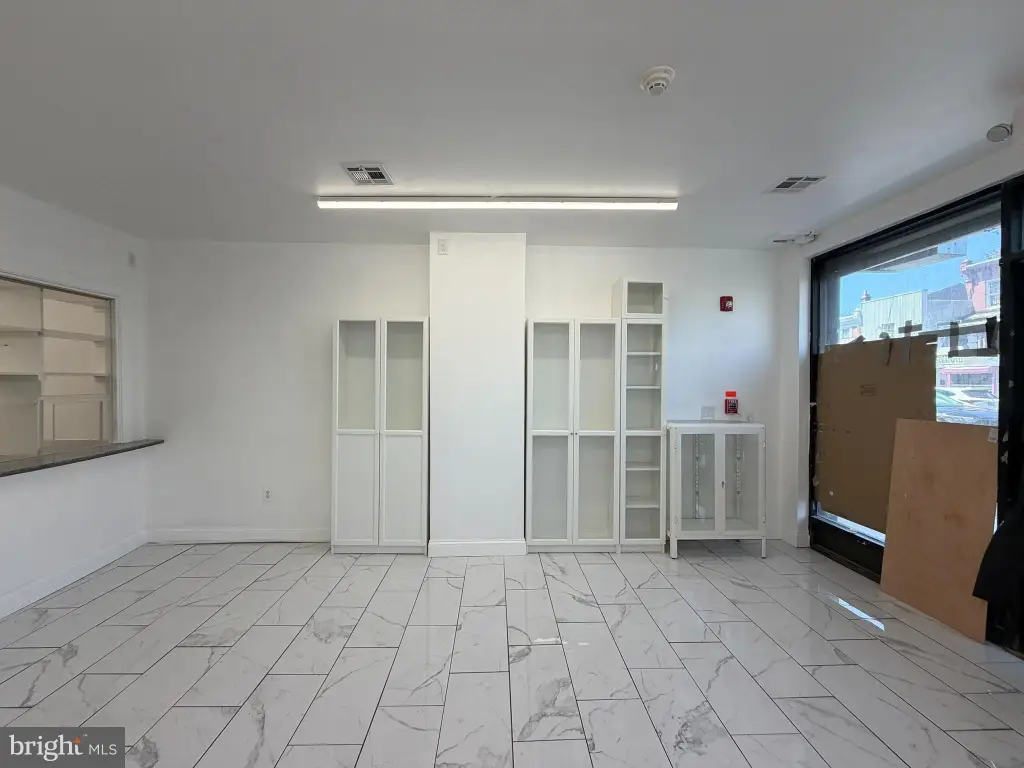
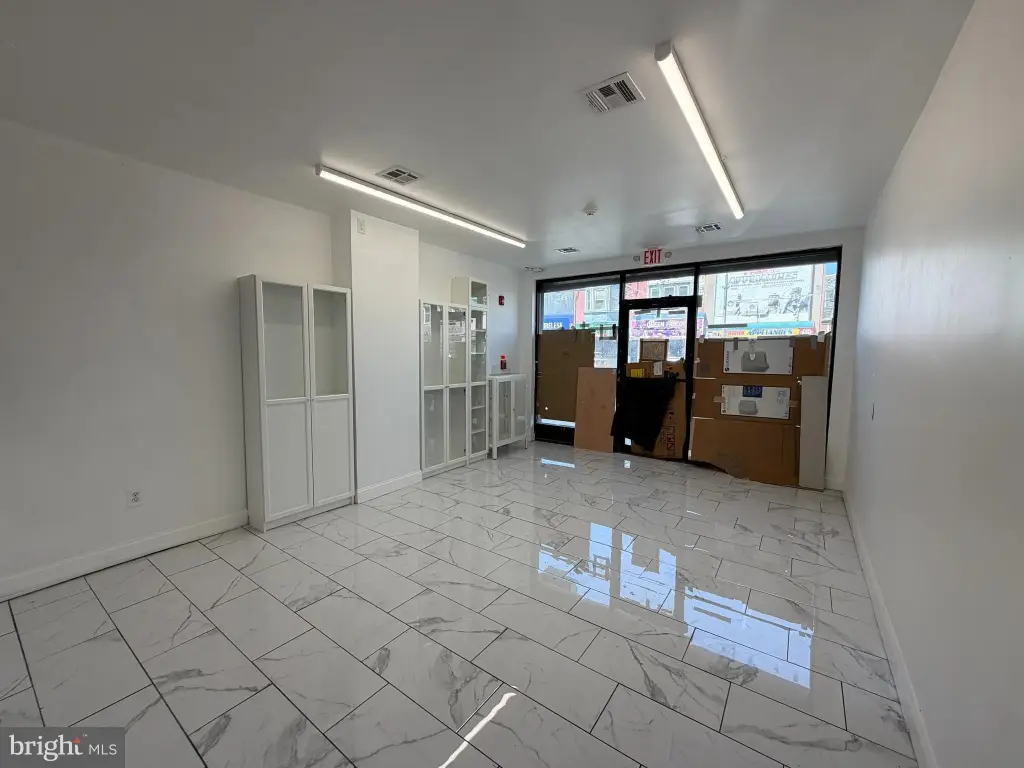
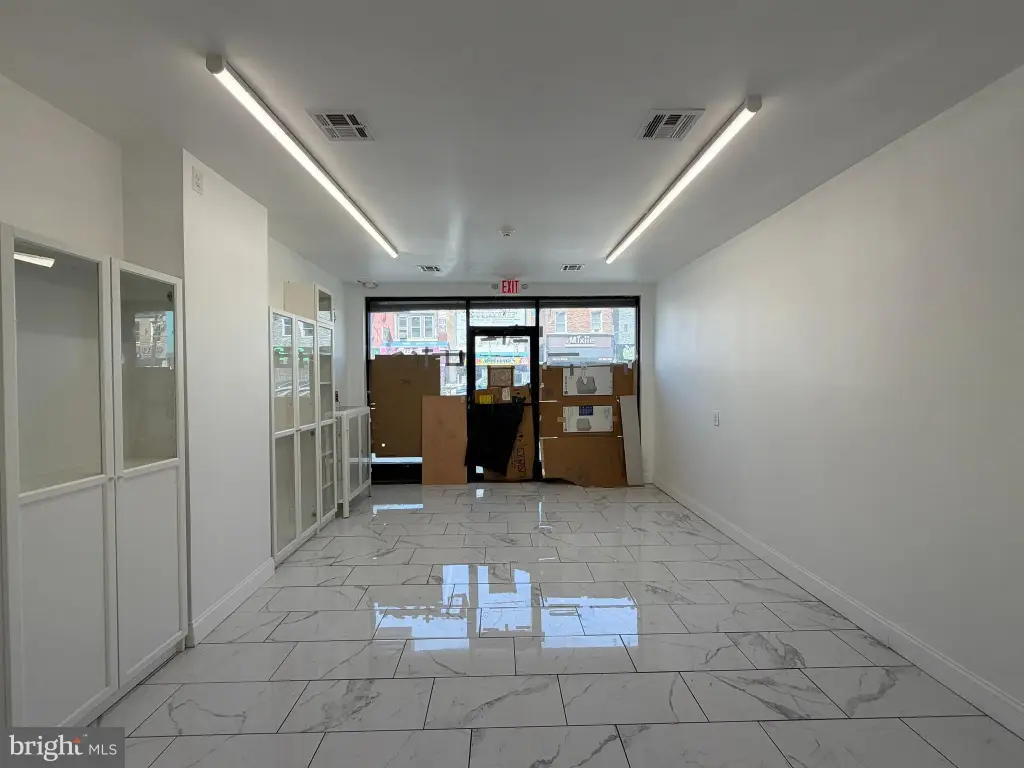
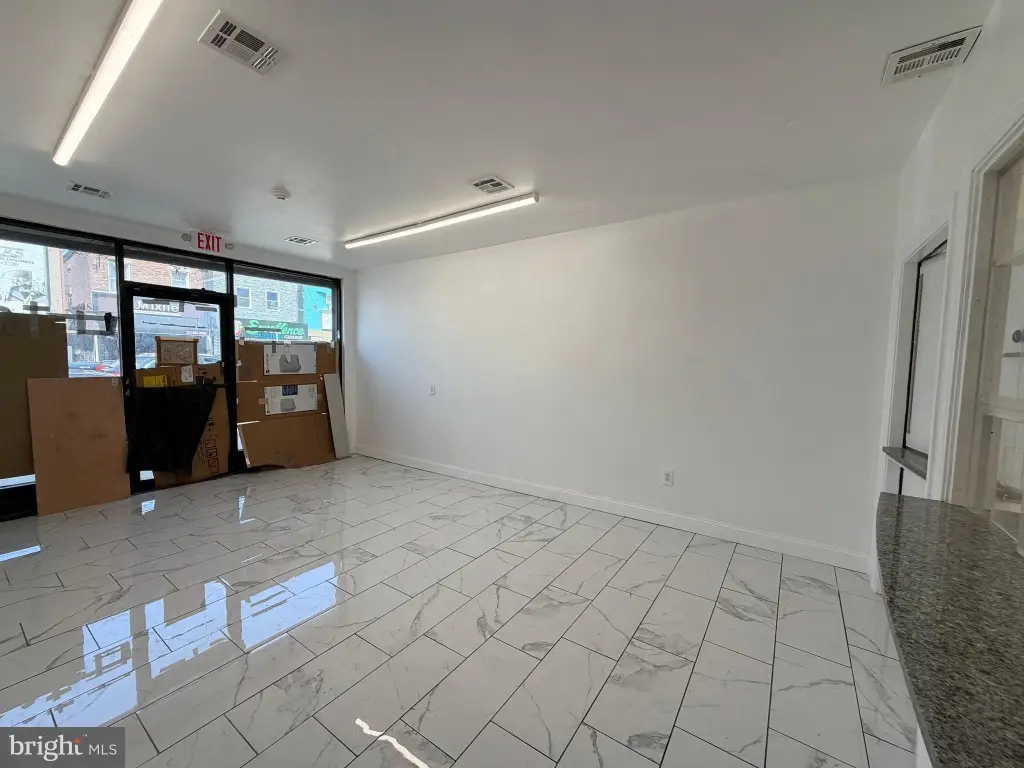
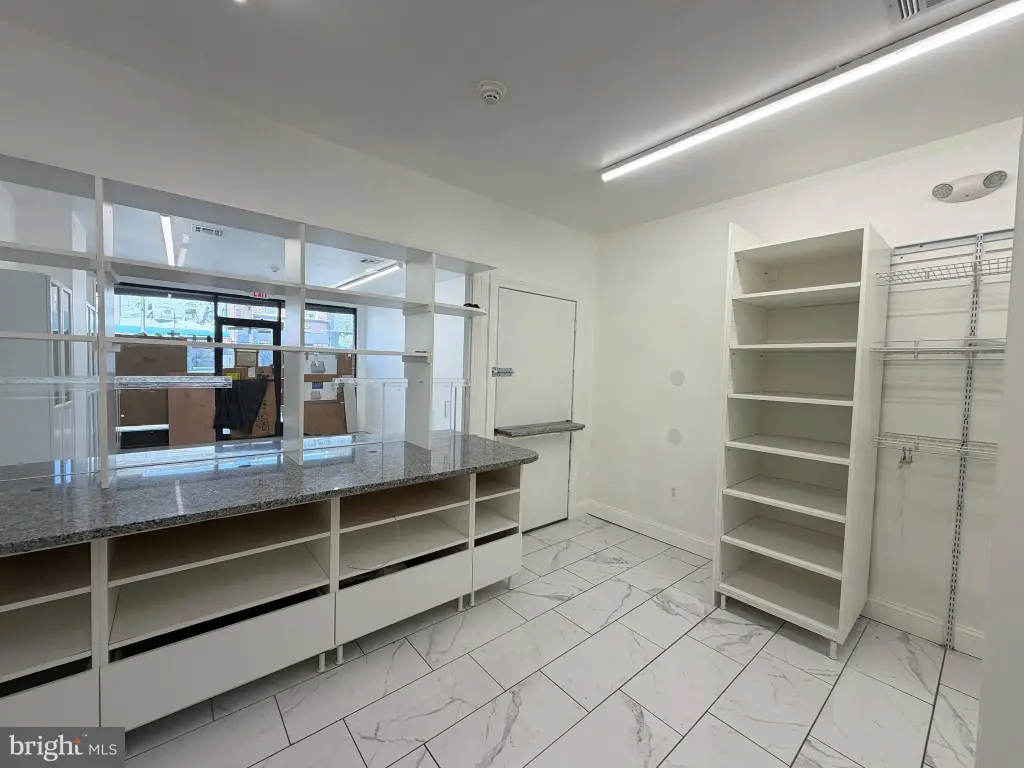
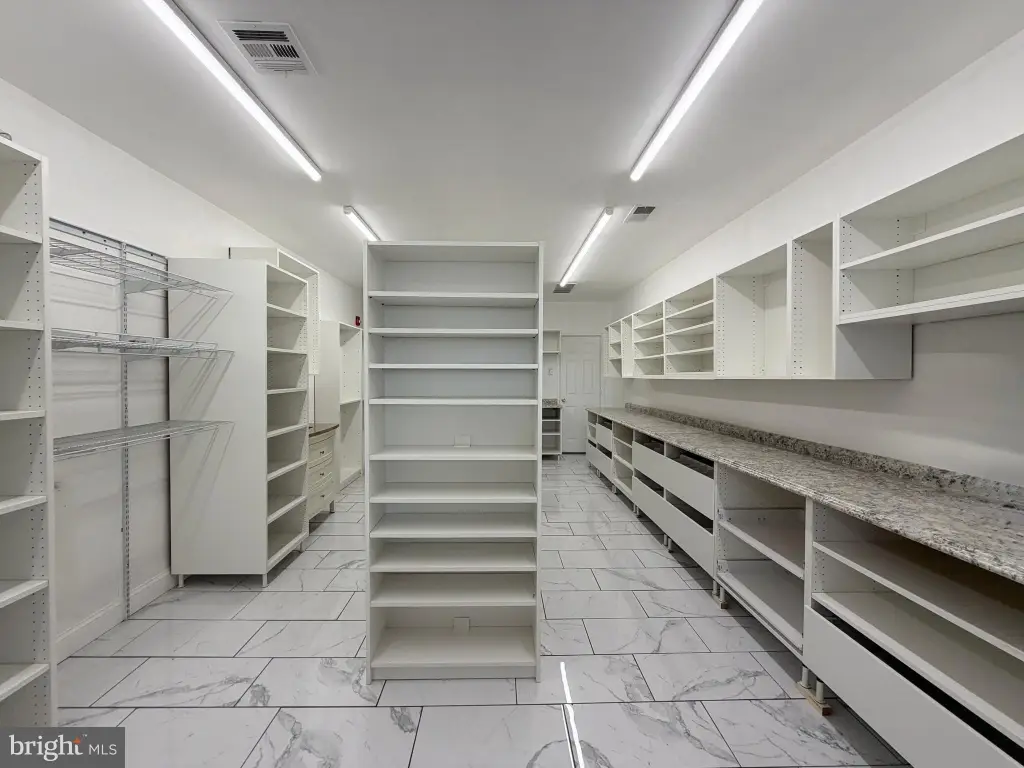
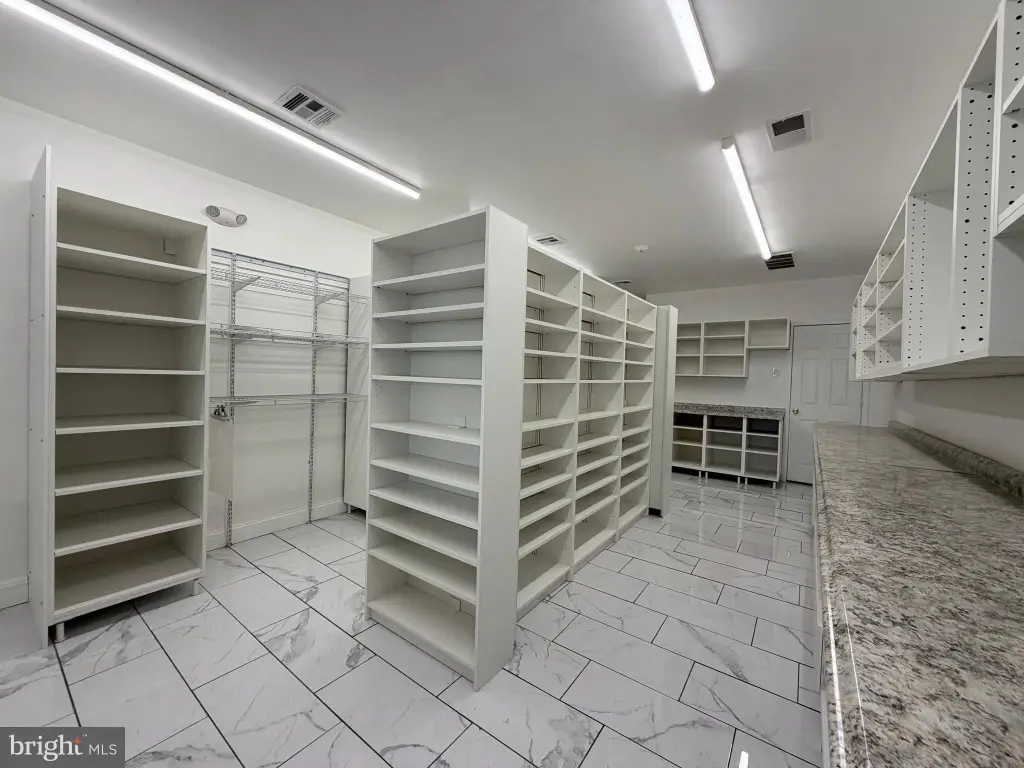
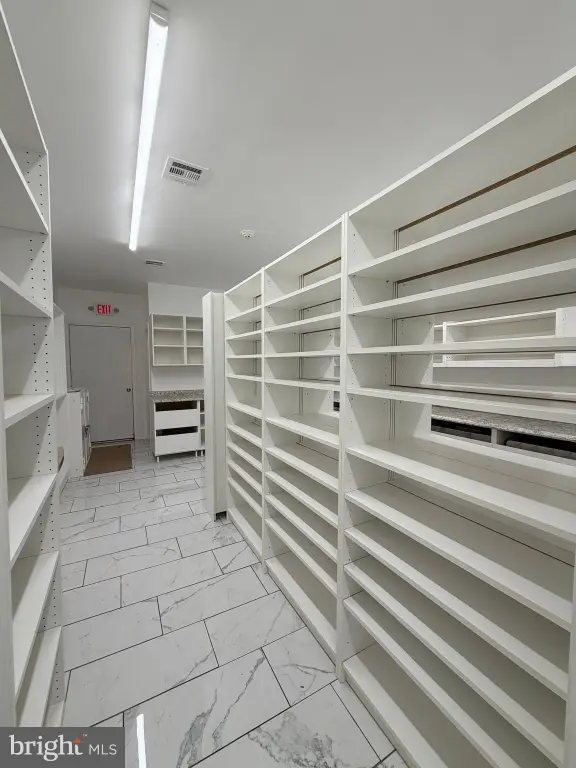
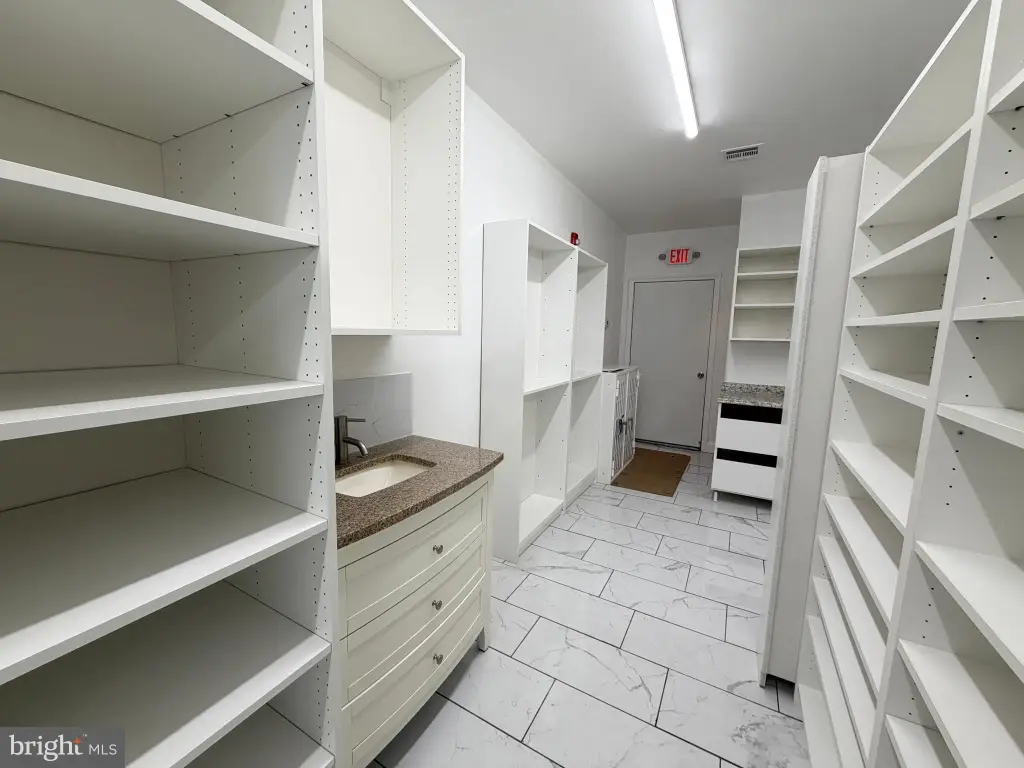
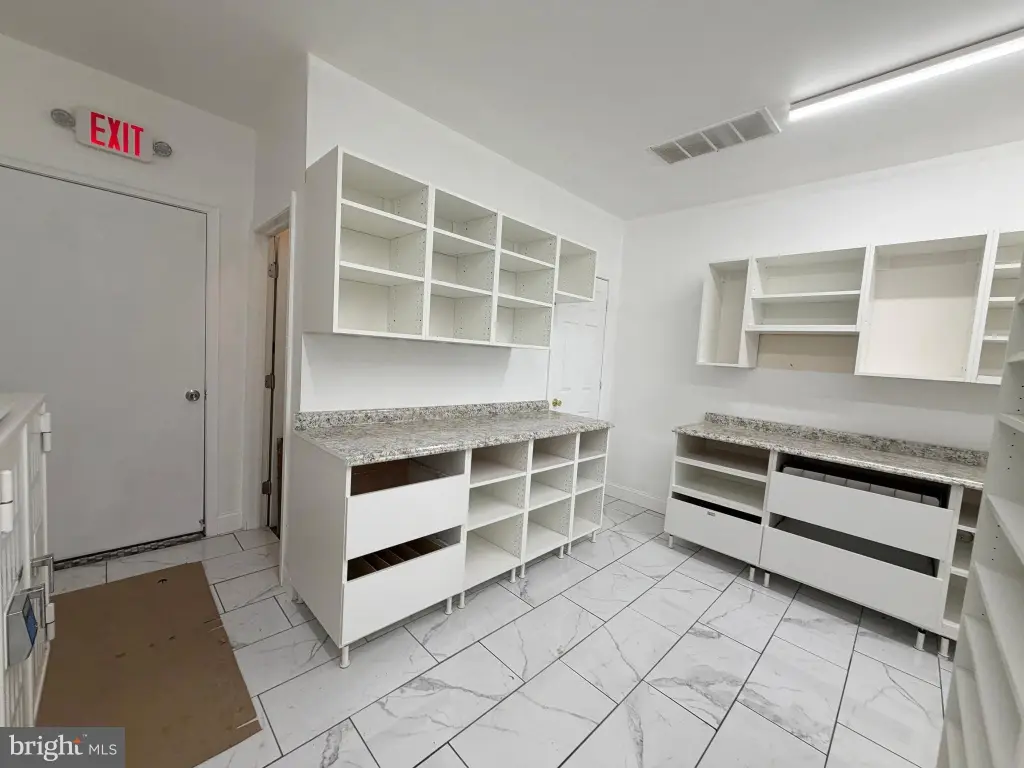
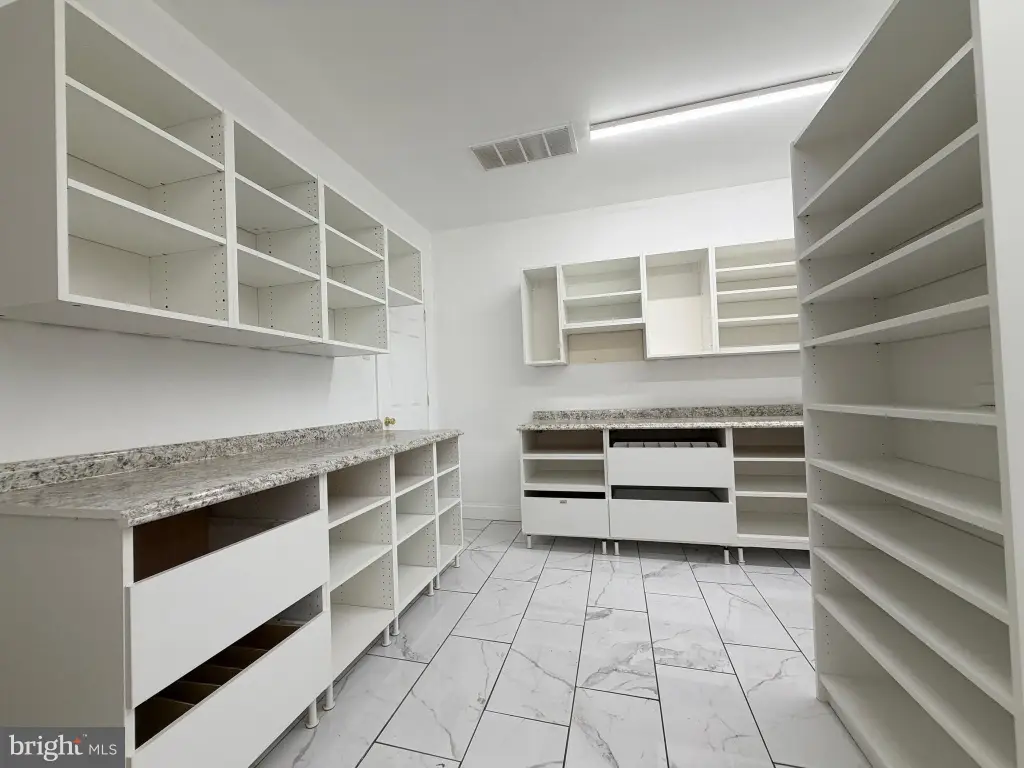
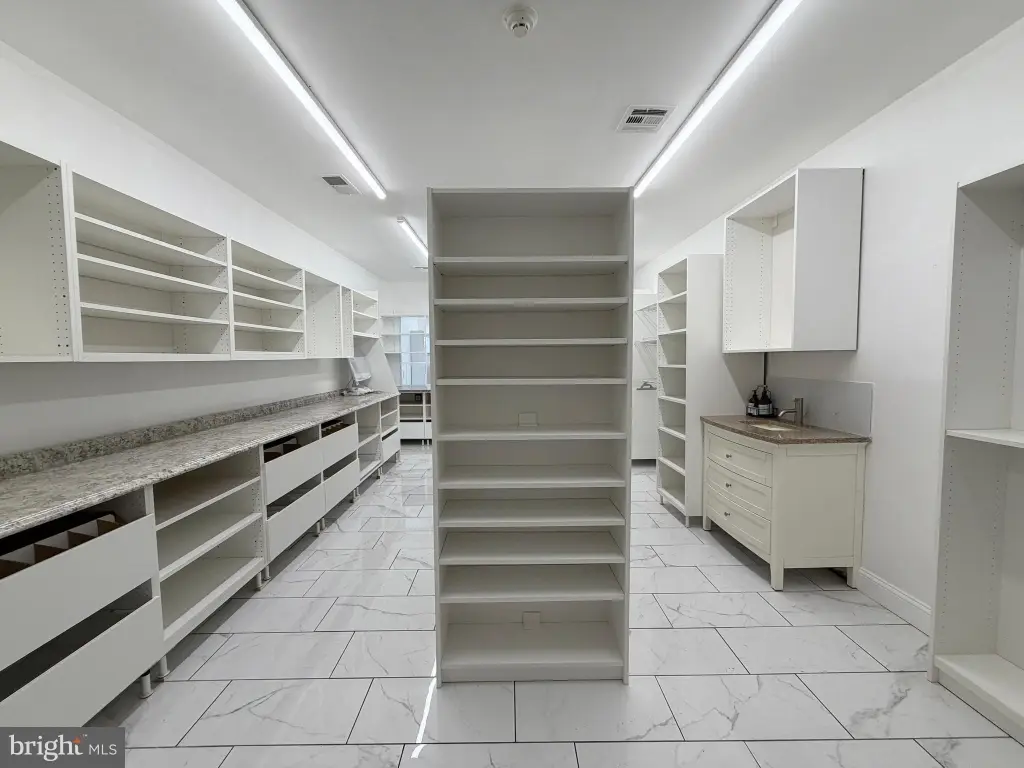
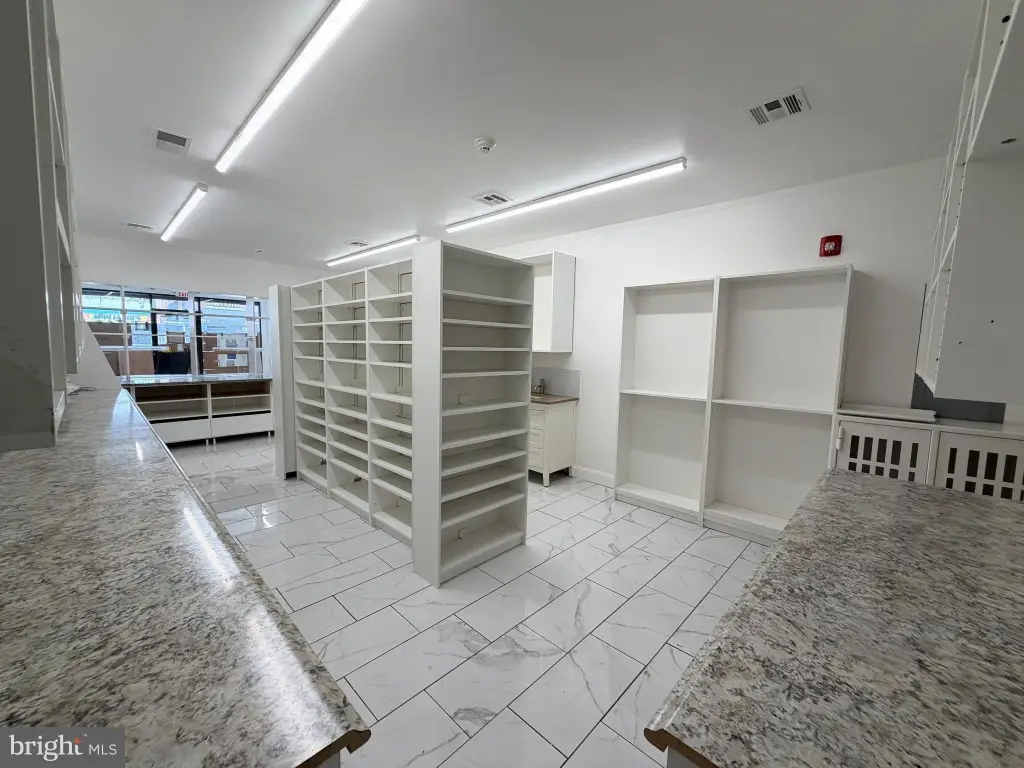
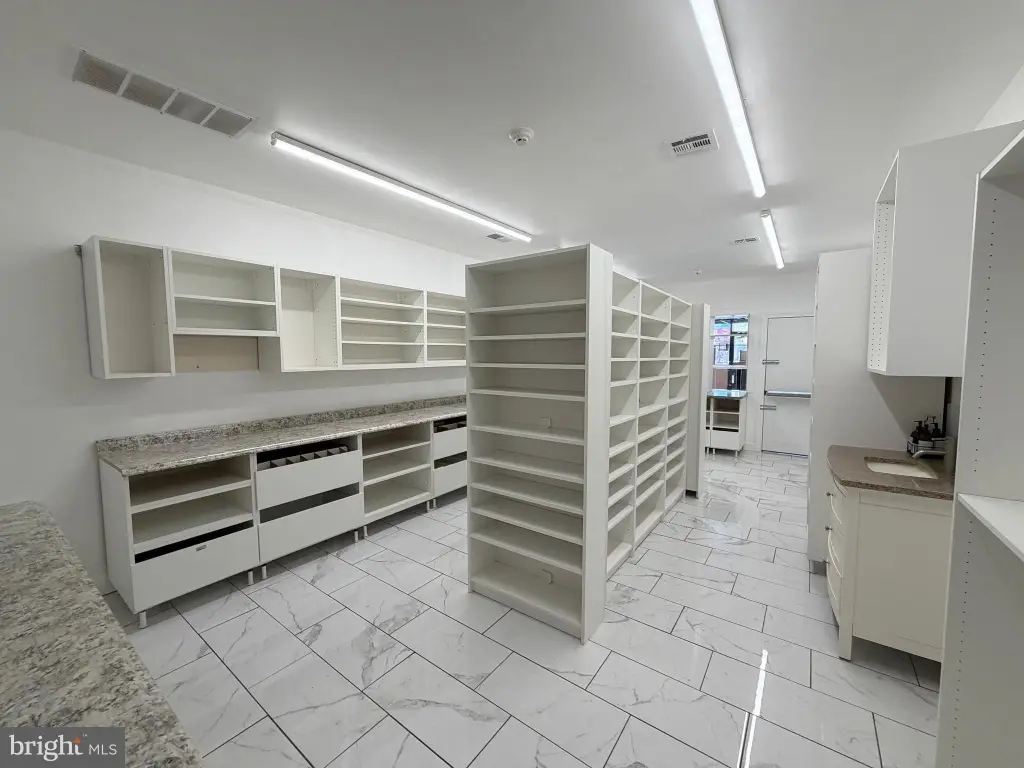
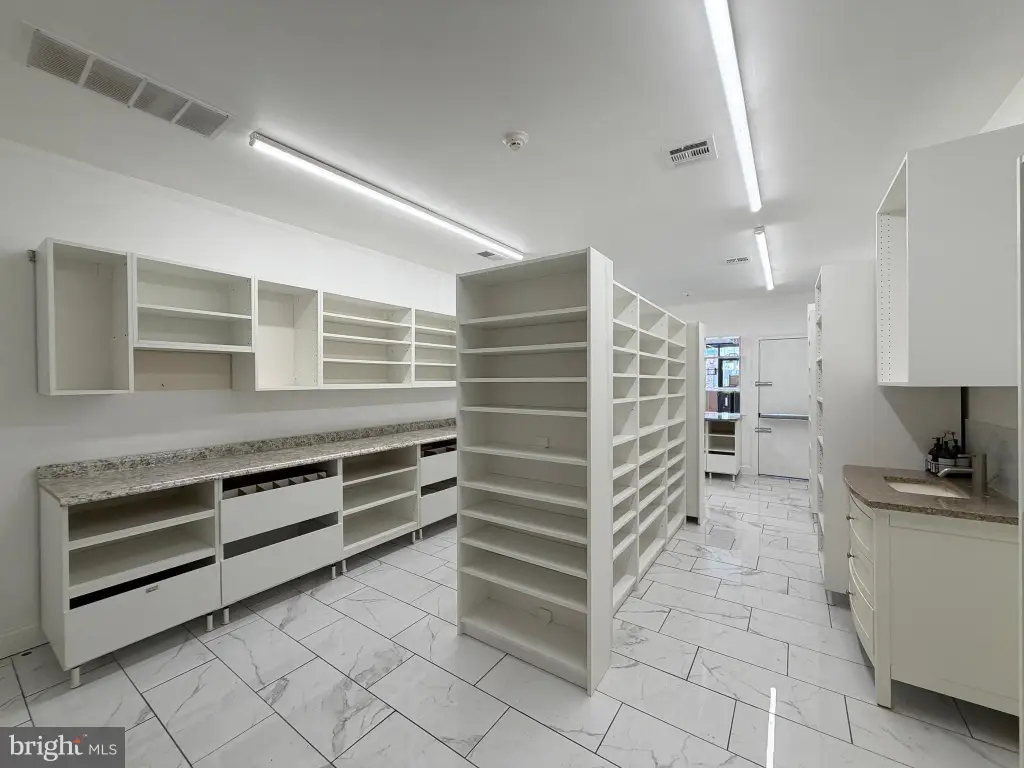
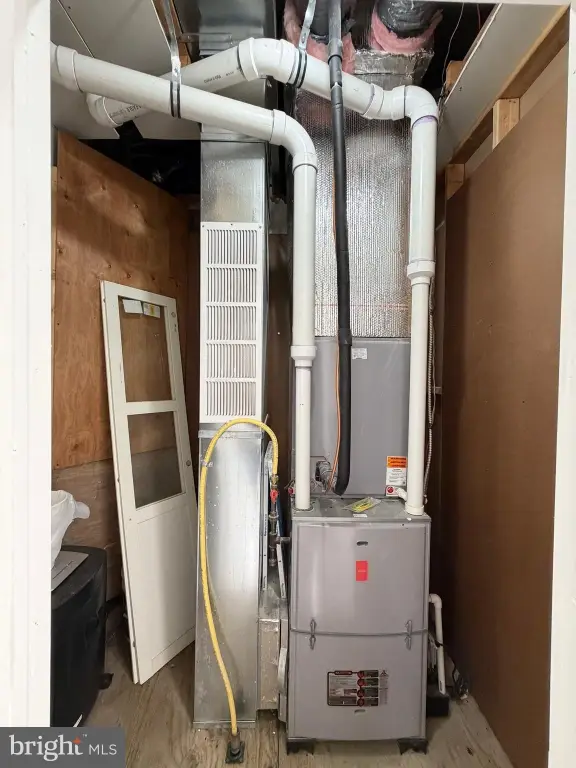
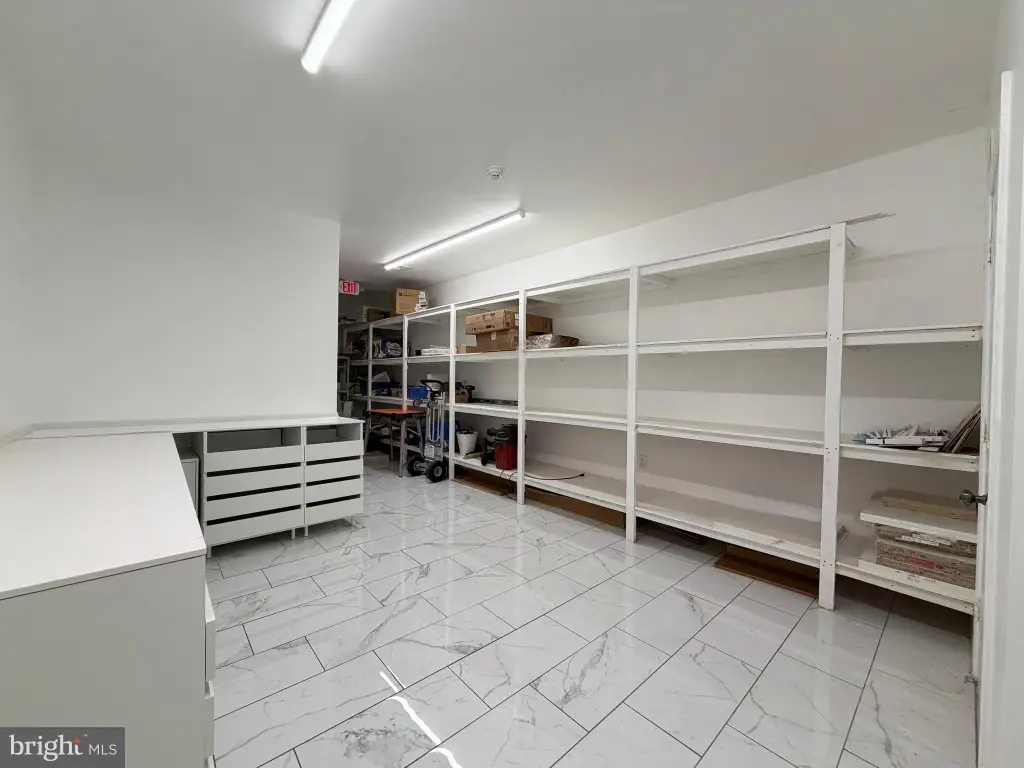
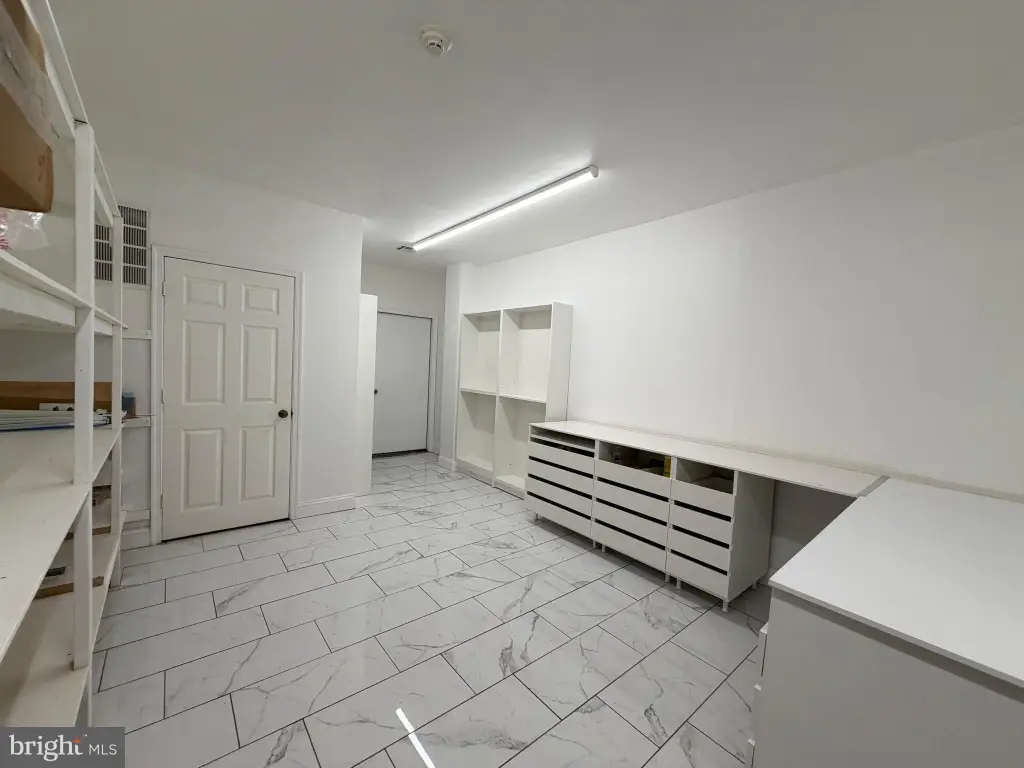
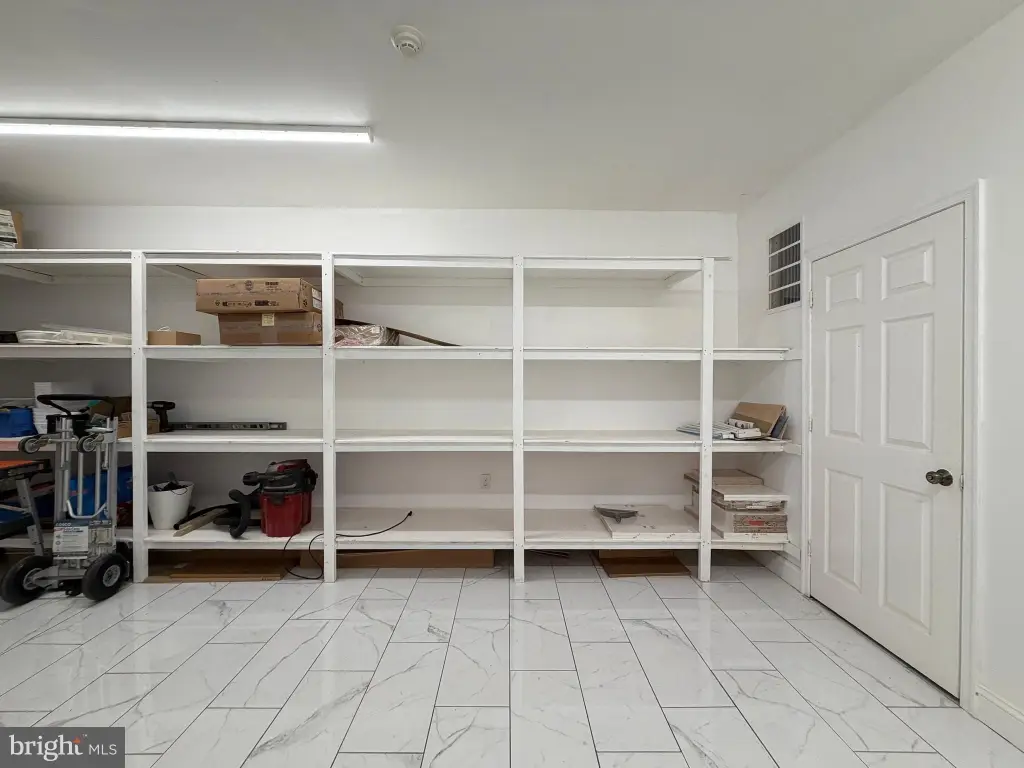
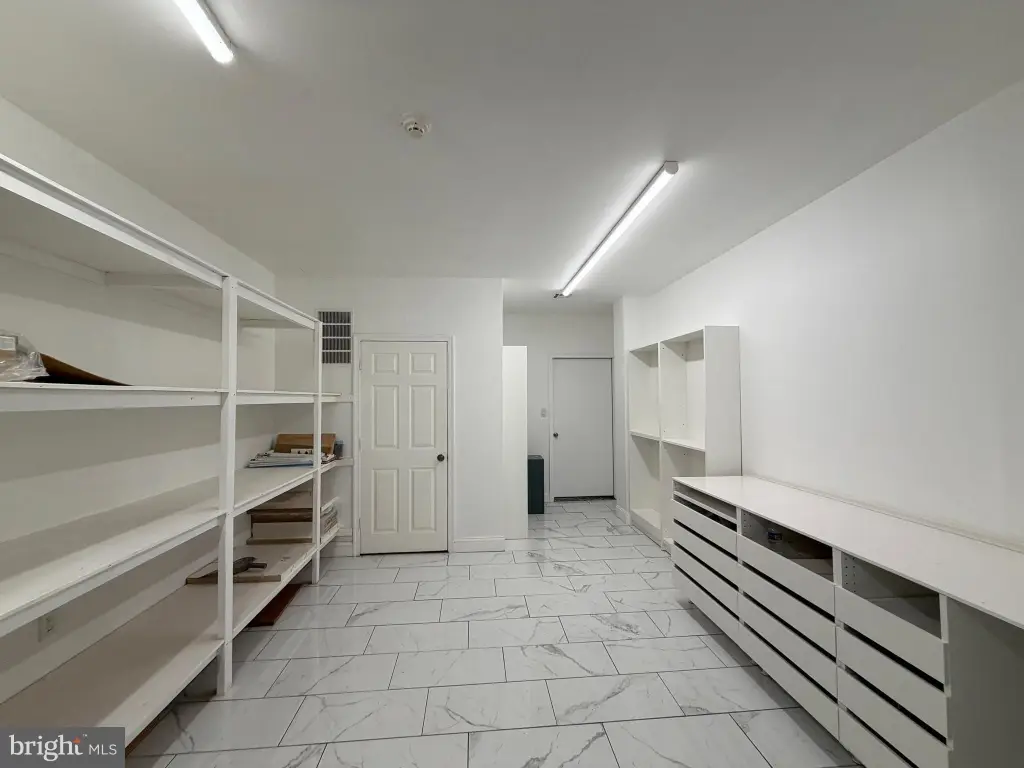
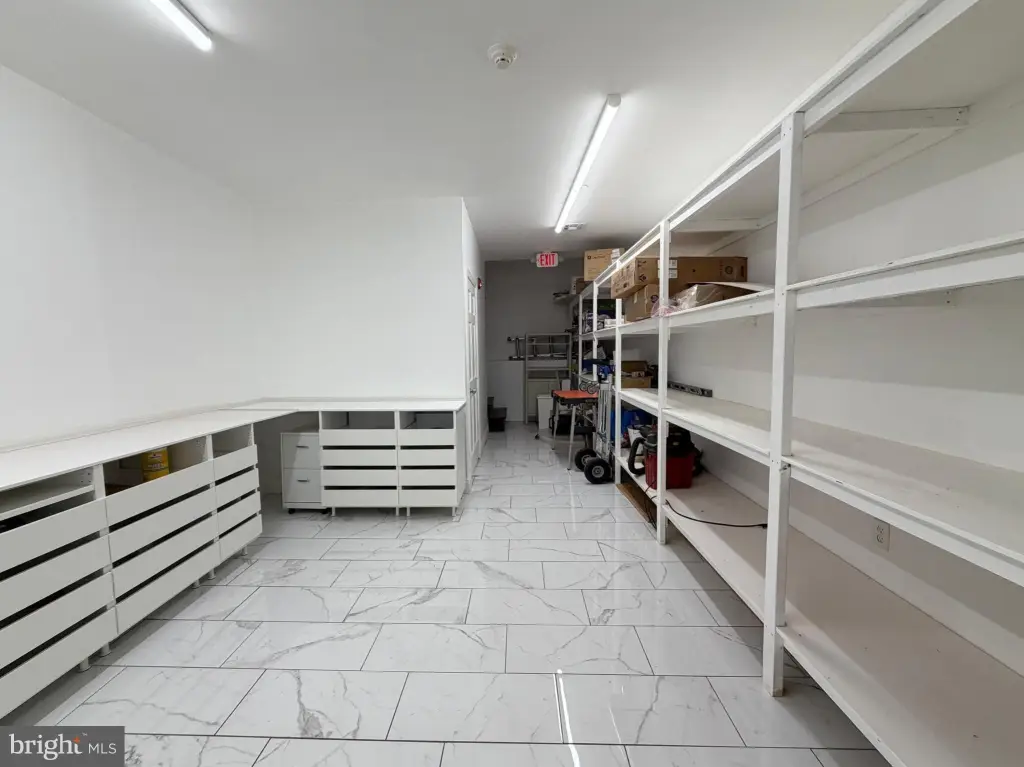
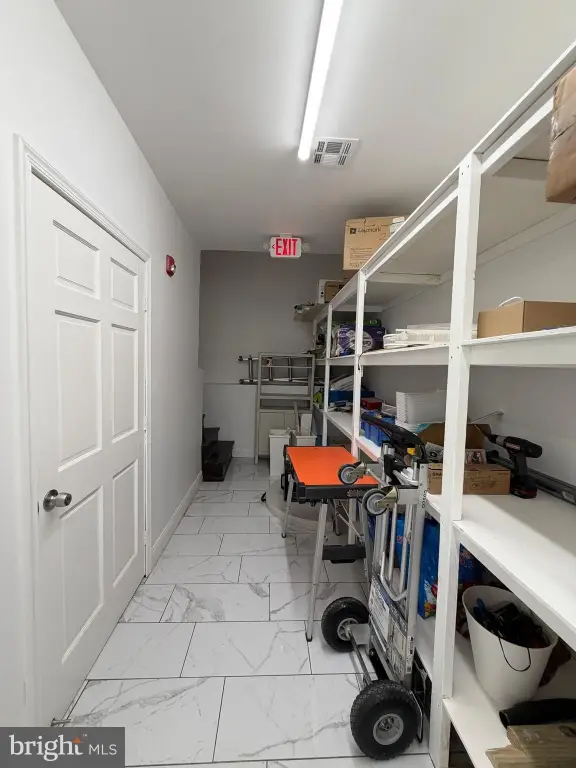
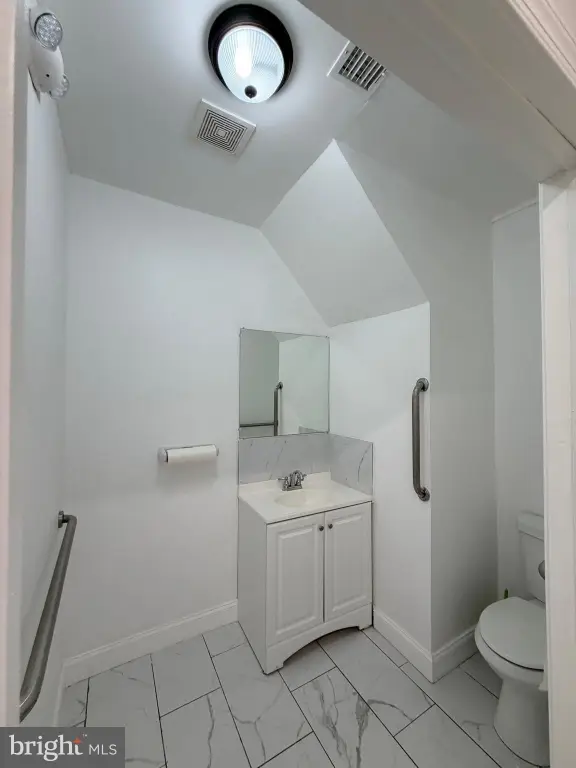
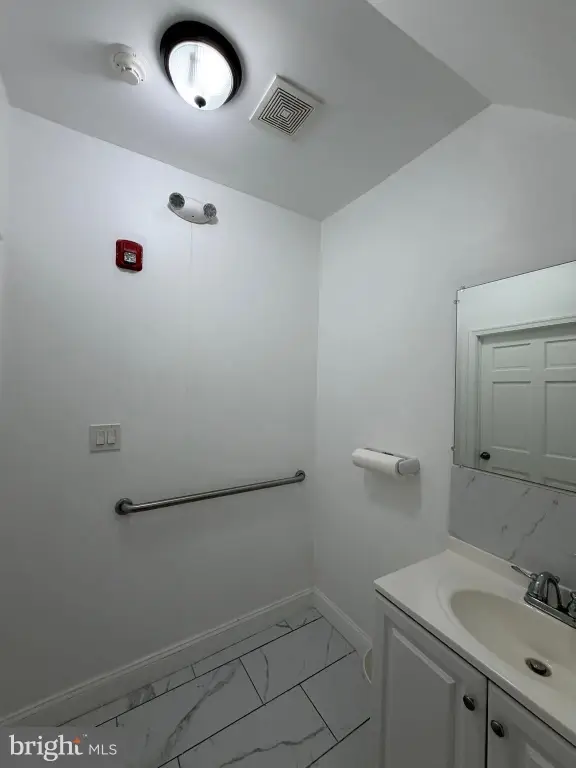
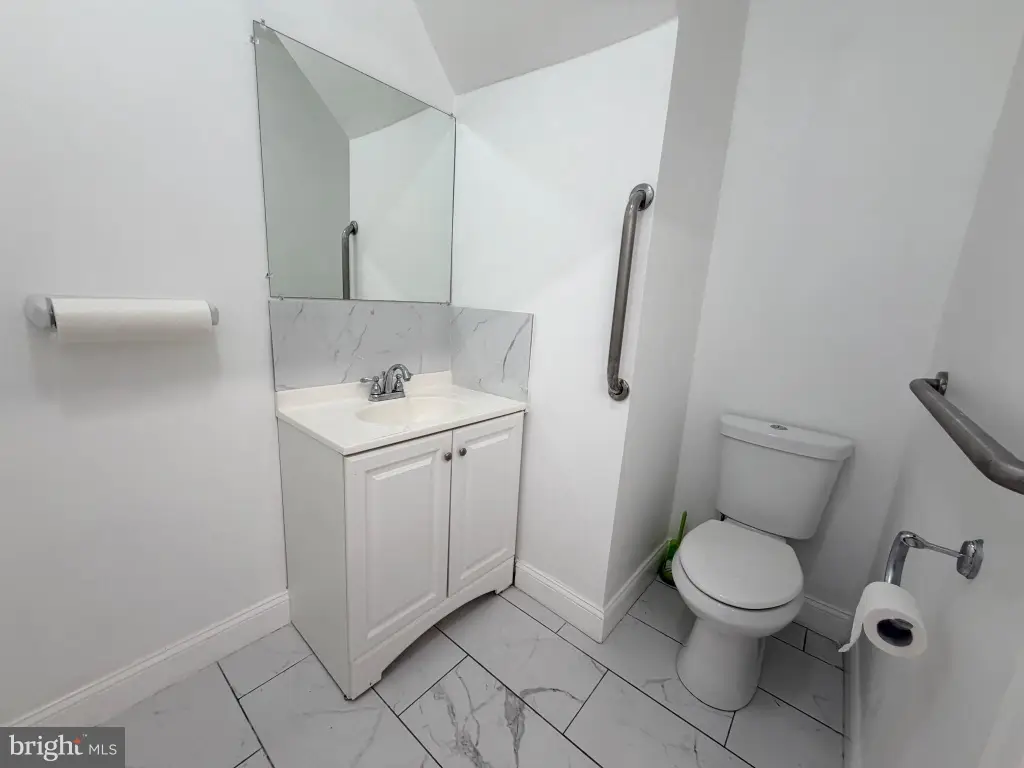
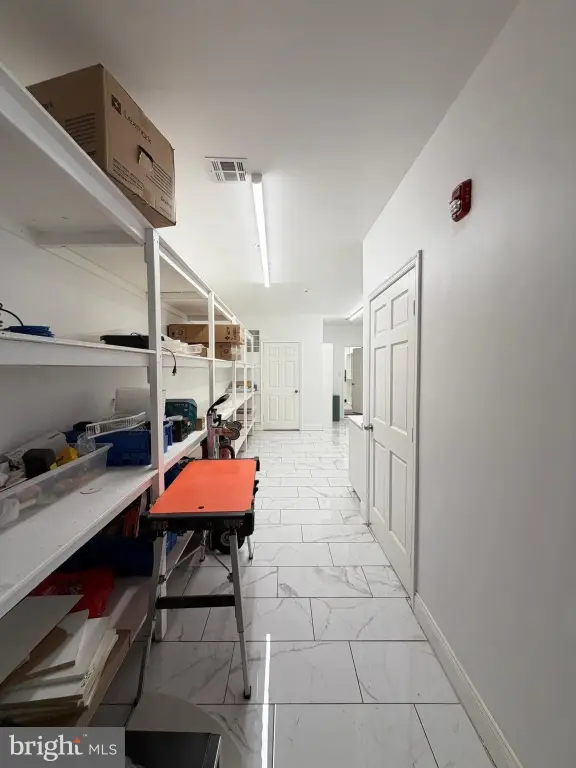
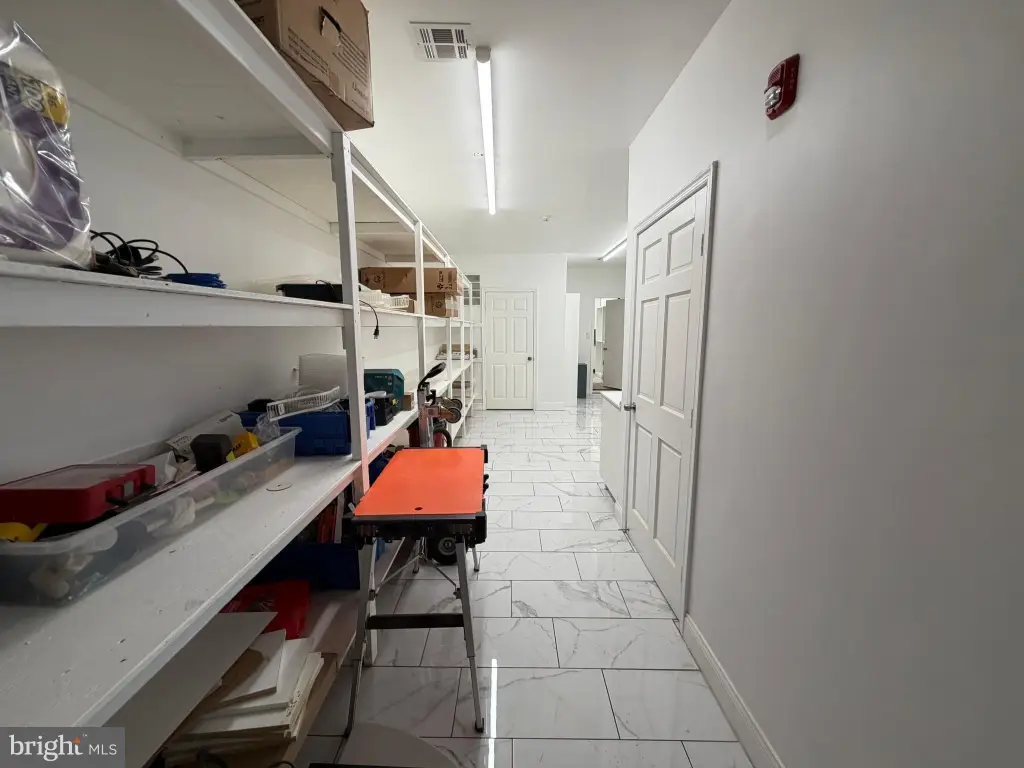
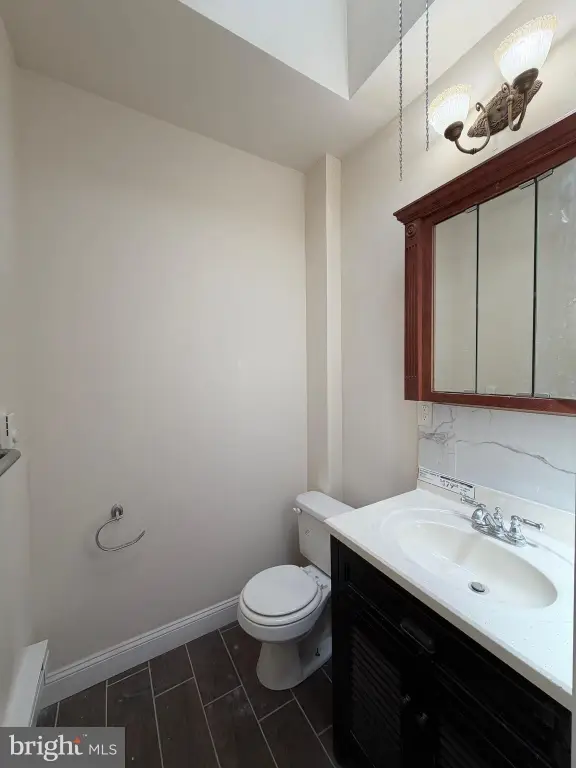
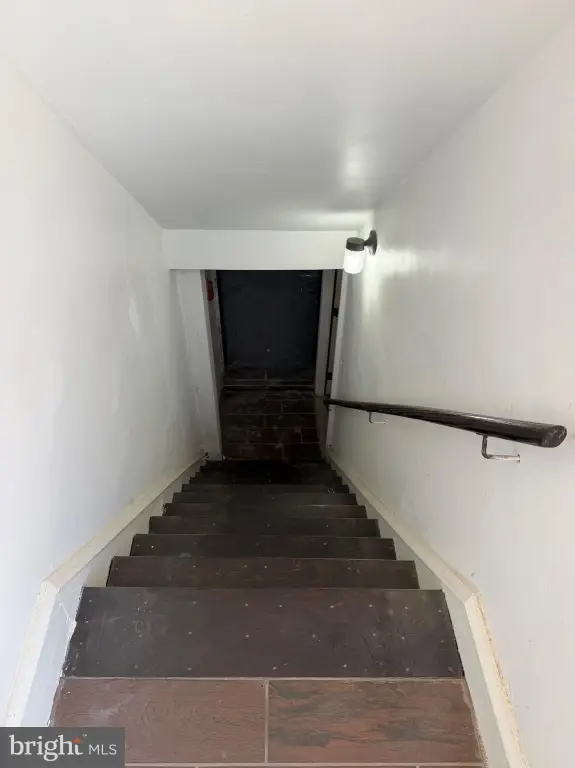
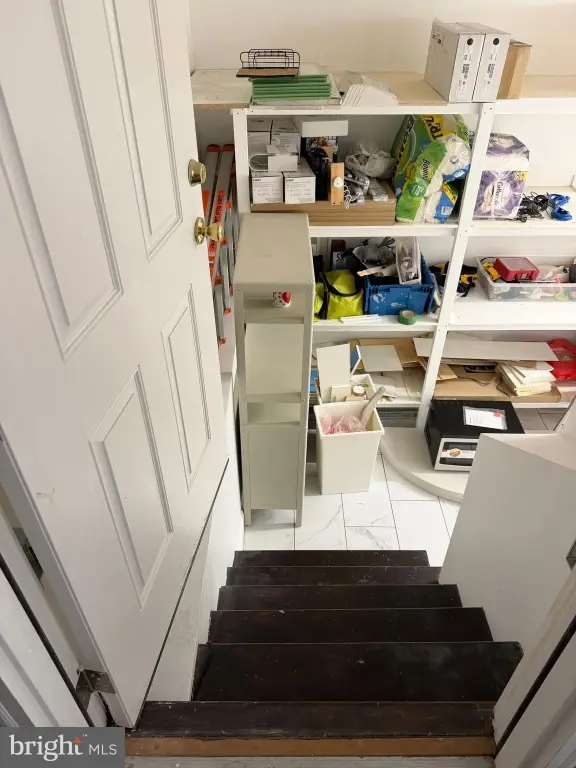
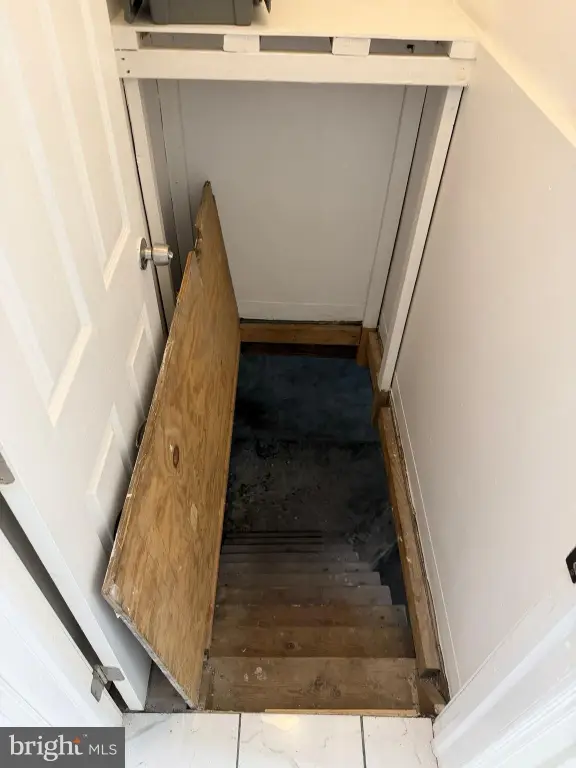
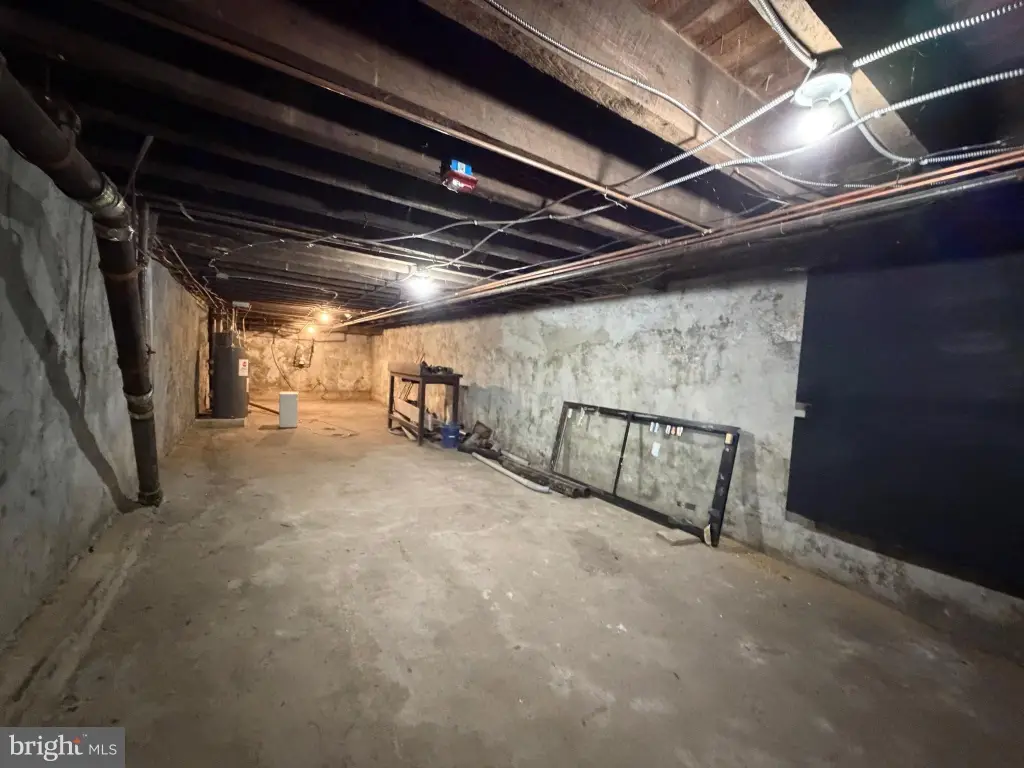
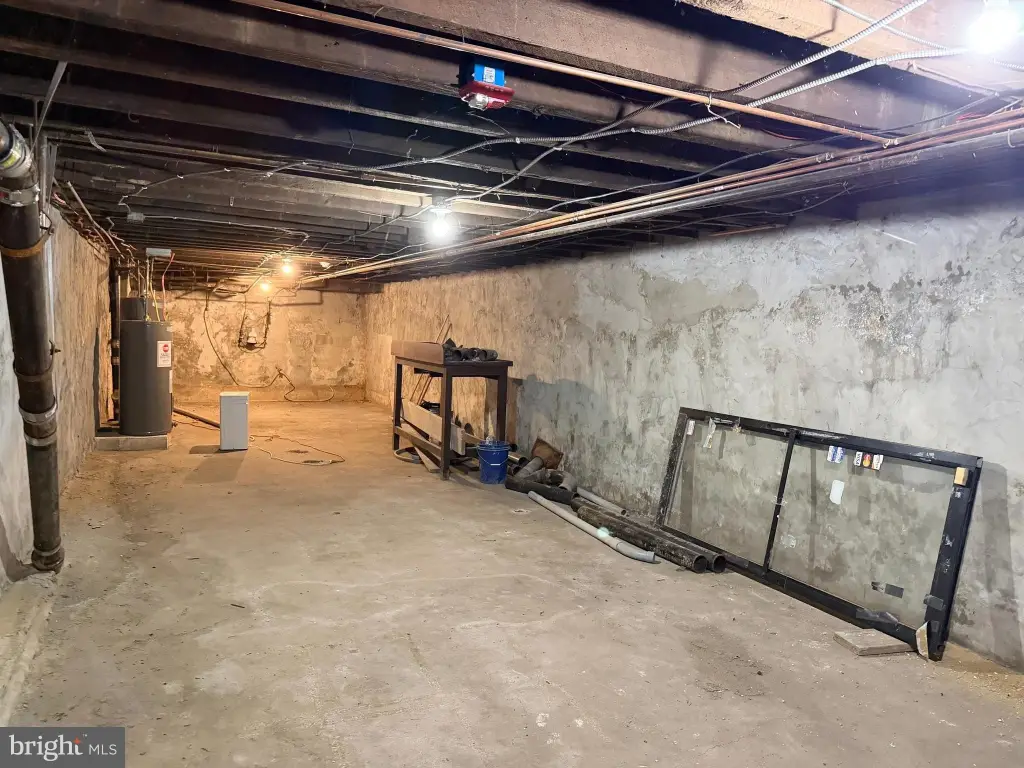
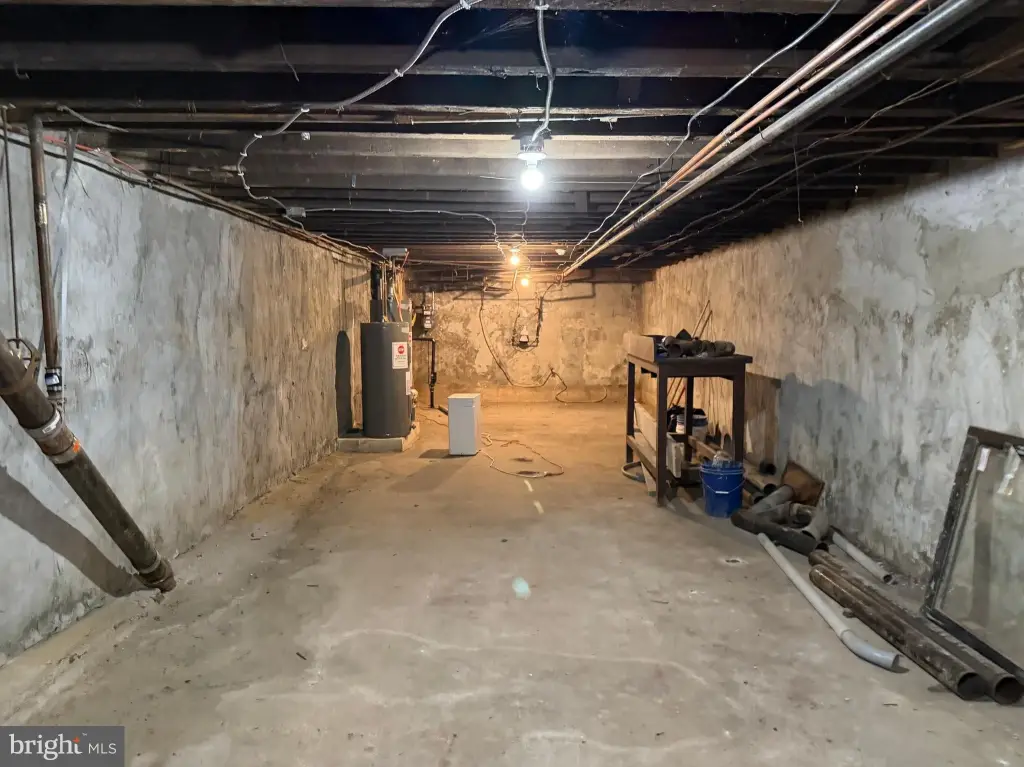
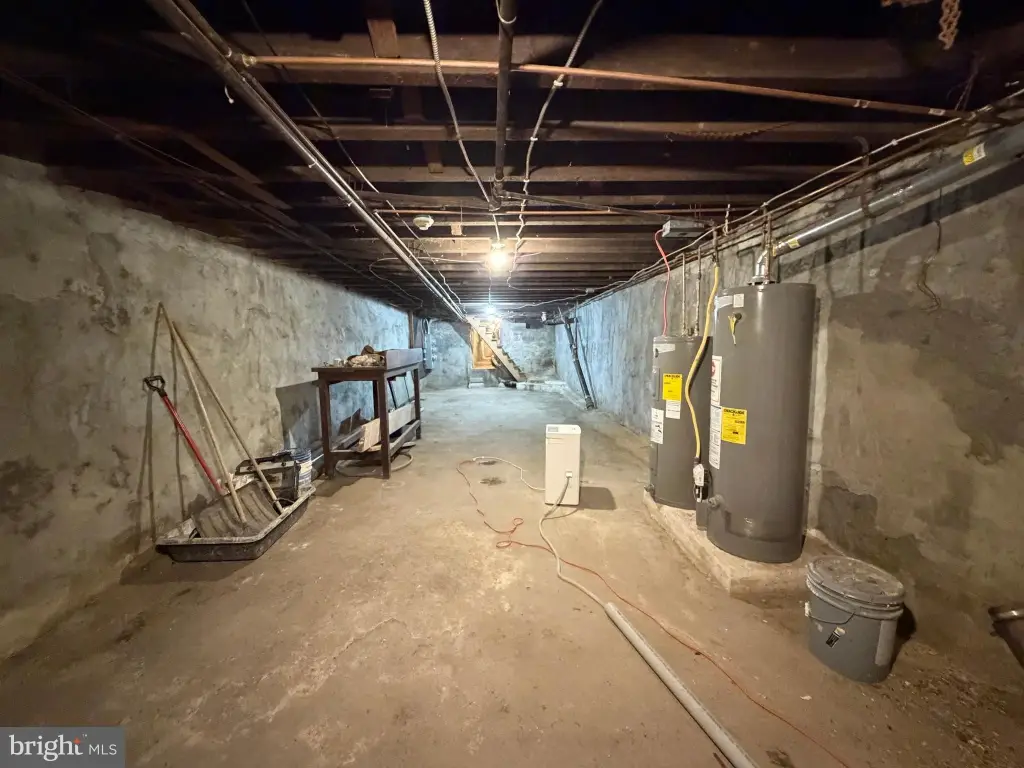
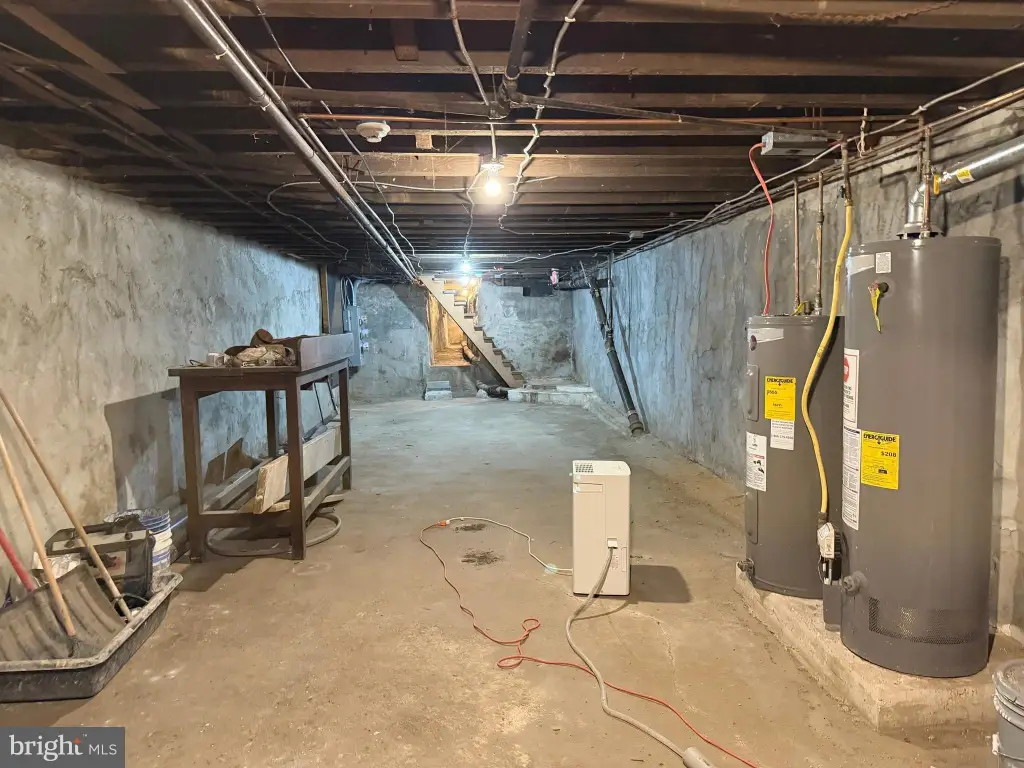
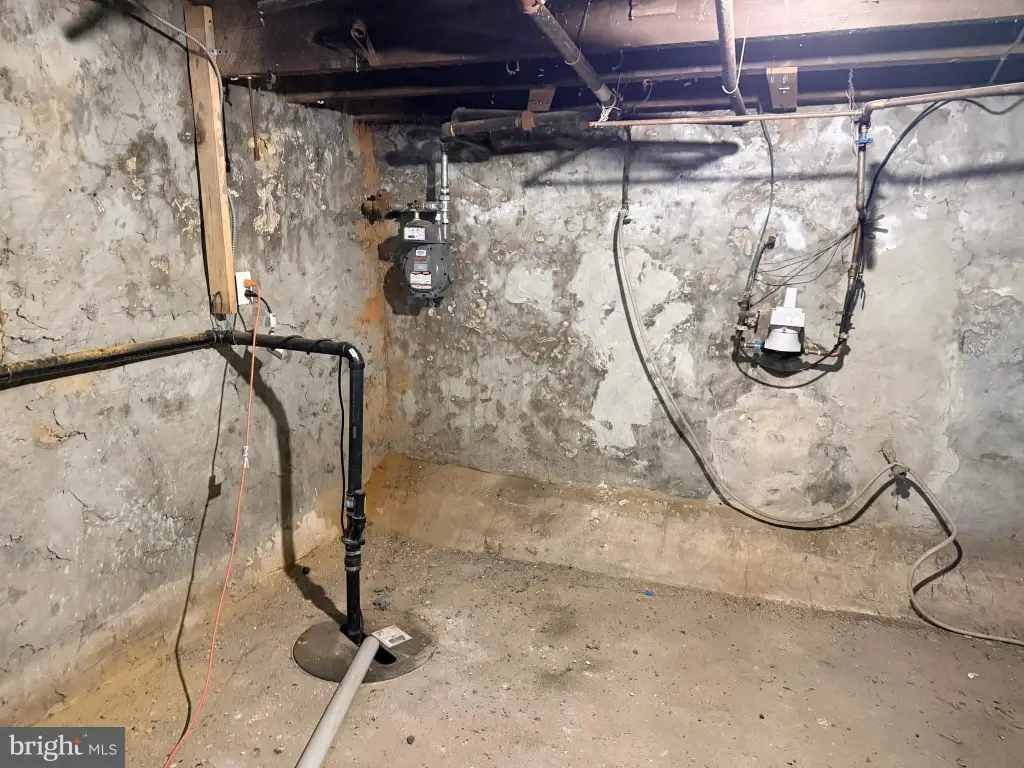
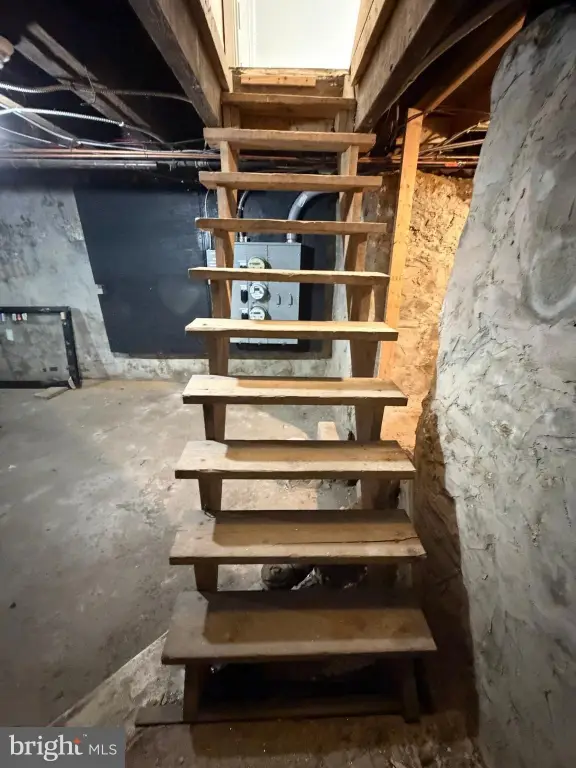
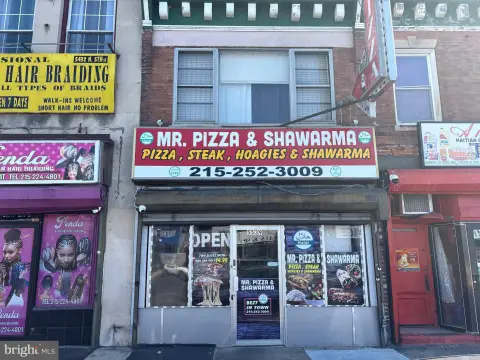
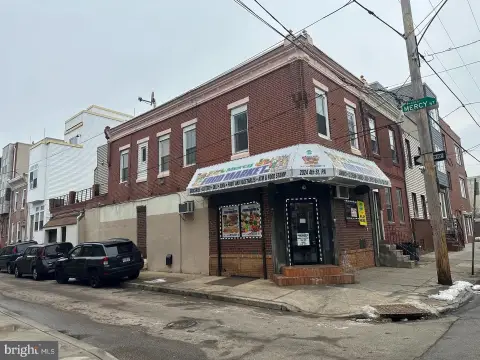
This 1,950-square-foot mixed-use property combines a retail storefront with a two-bedroom apartment above. The commercial level includes glass frontage, LED lighting, shelving, open cabinetry, a built-in sink, storage space, a half bathroom, and an automatic roll-up security gate. A full unfinished basement provides additional storage, while central air and heating serve the utility area.
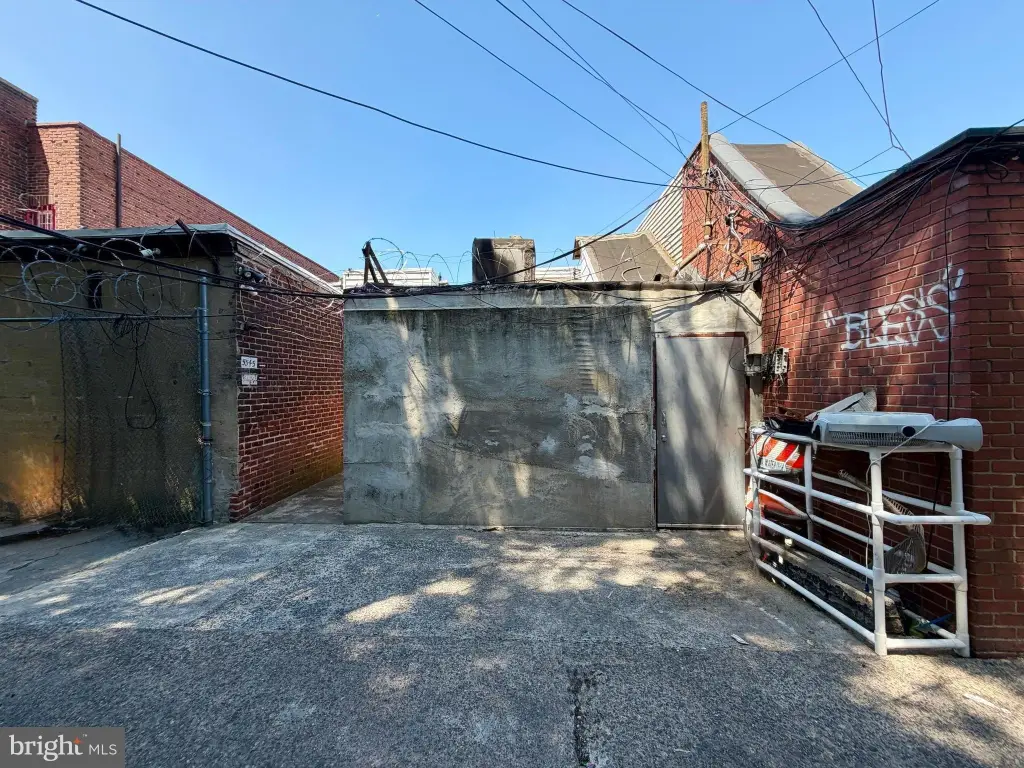
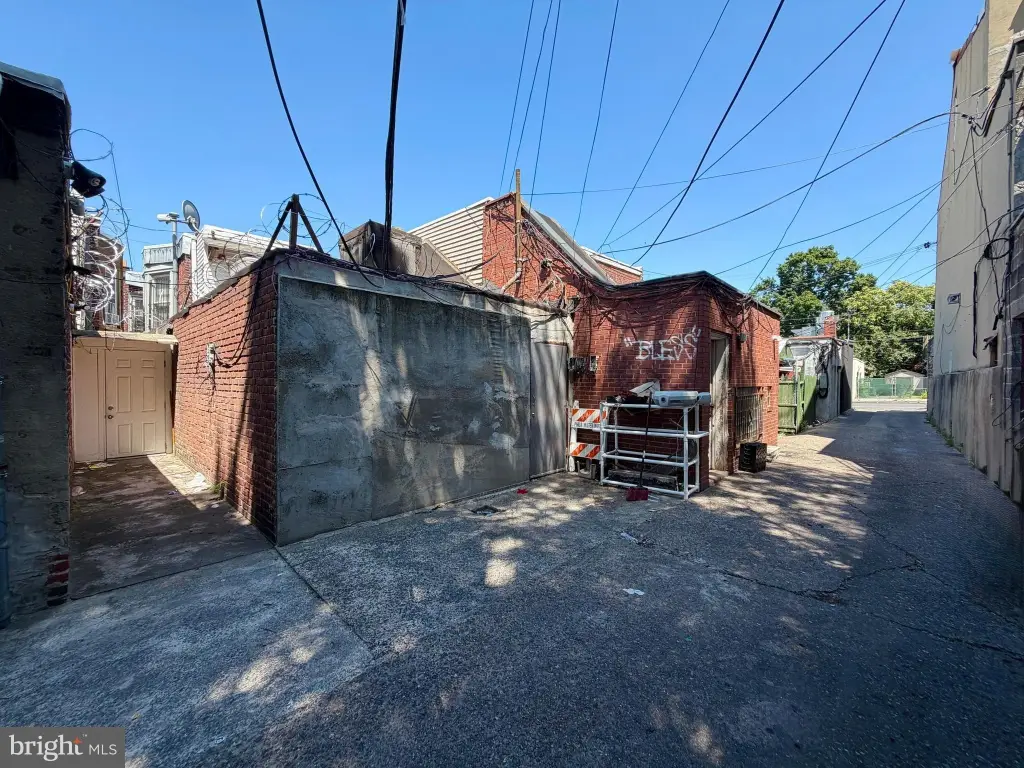
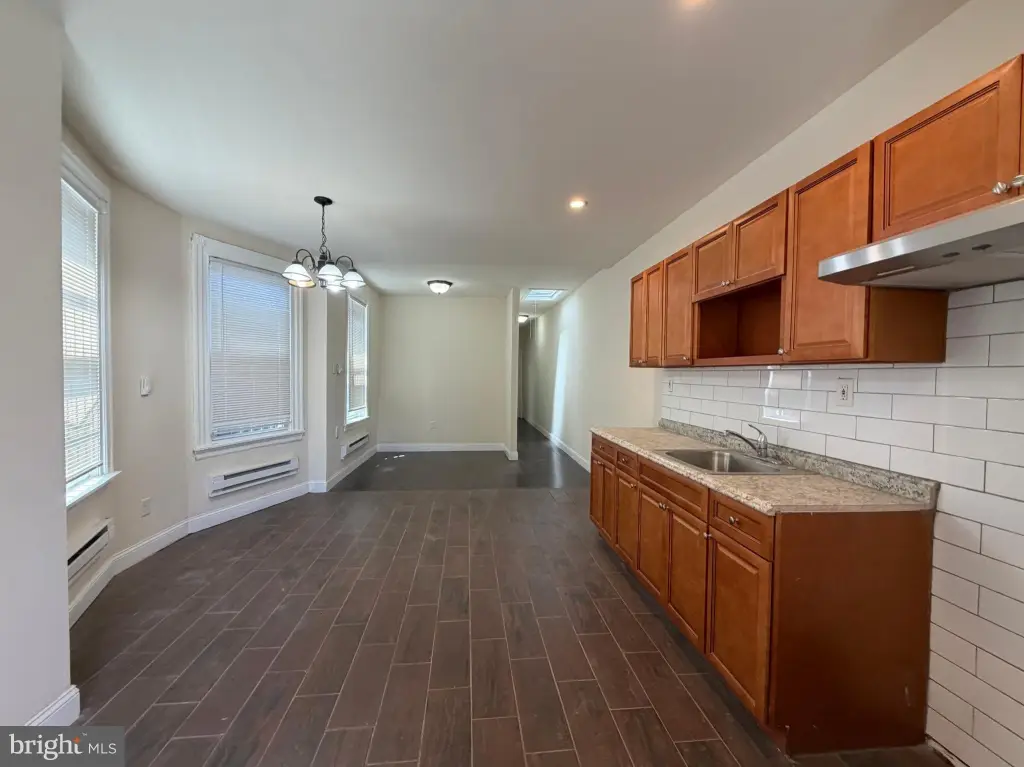
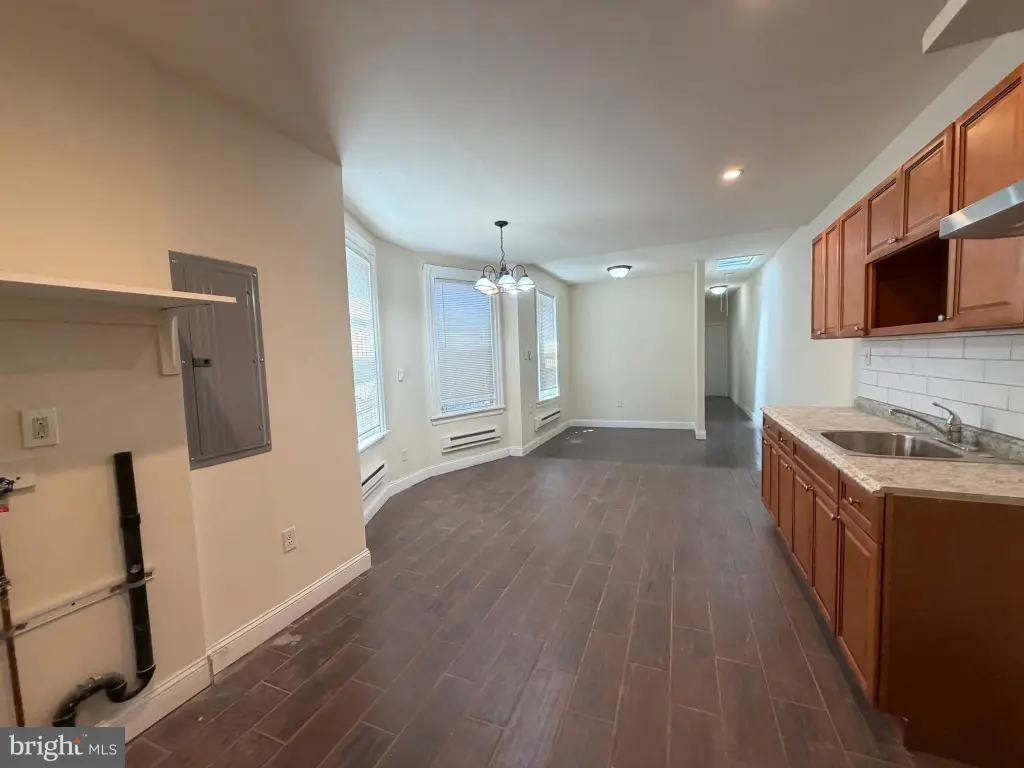
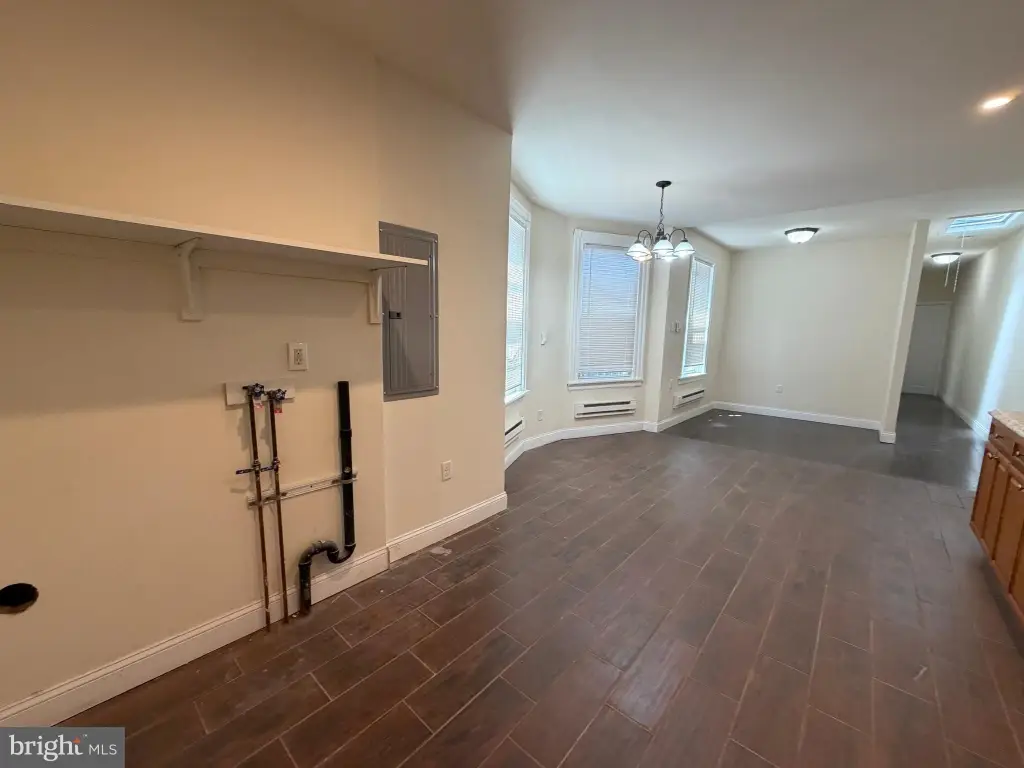
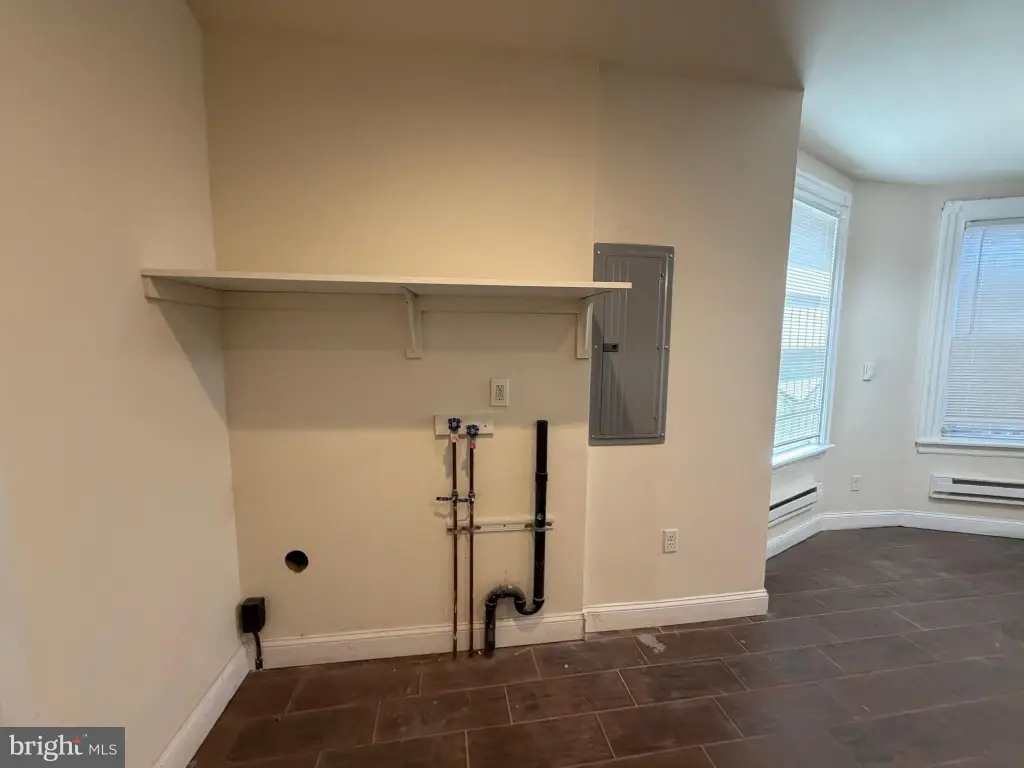
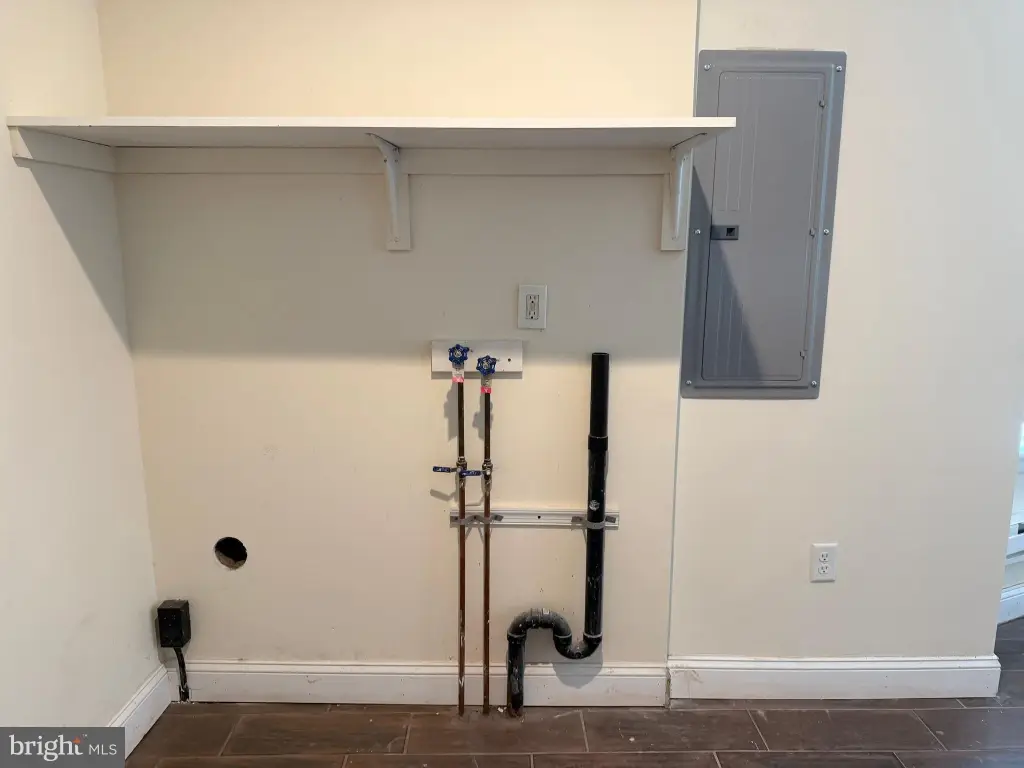
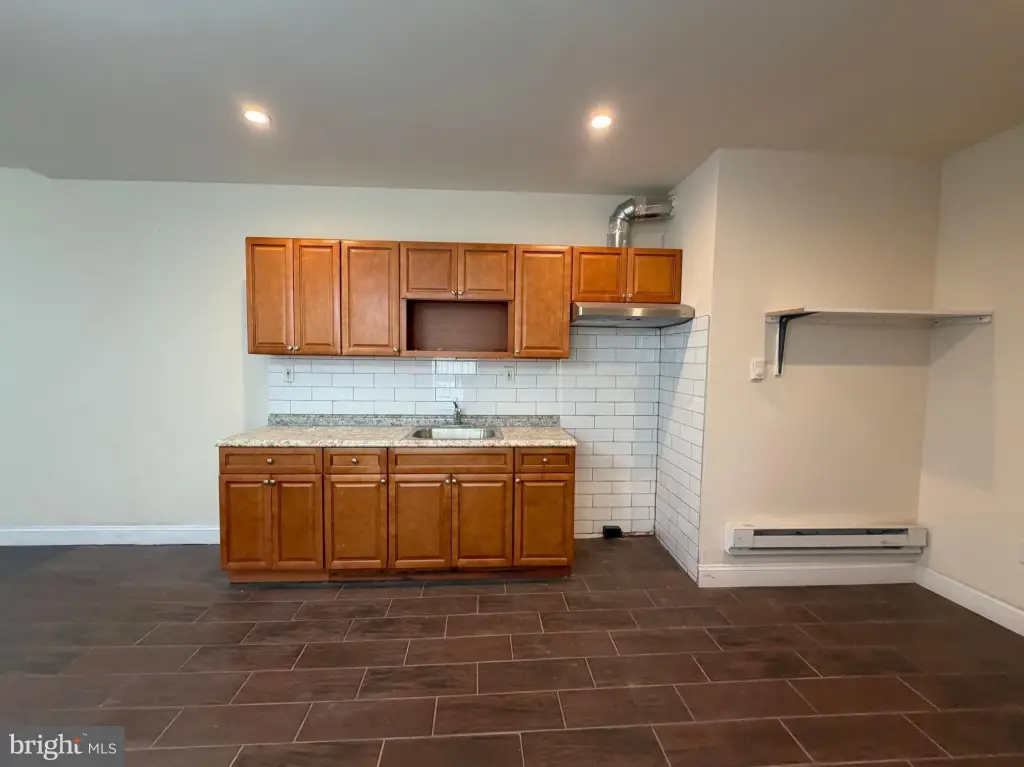
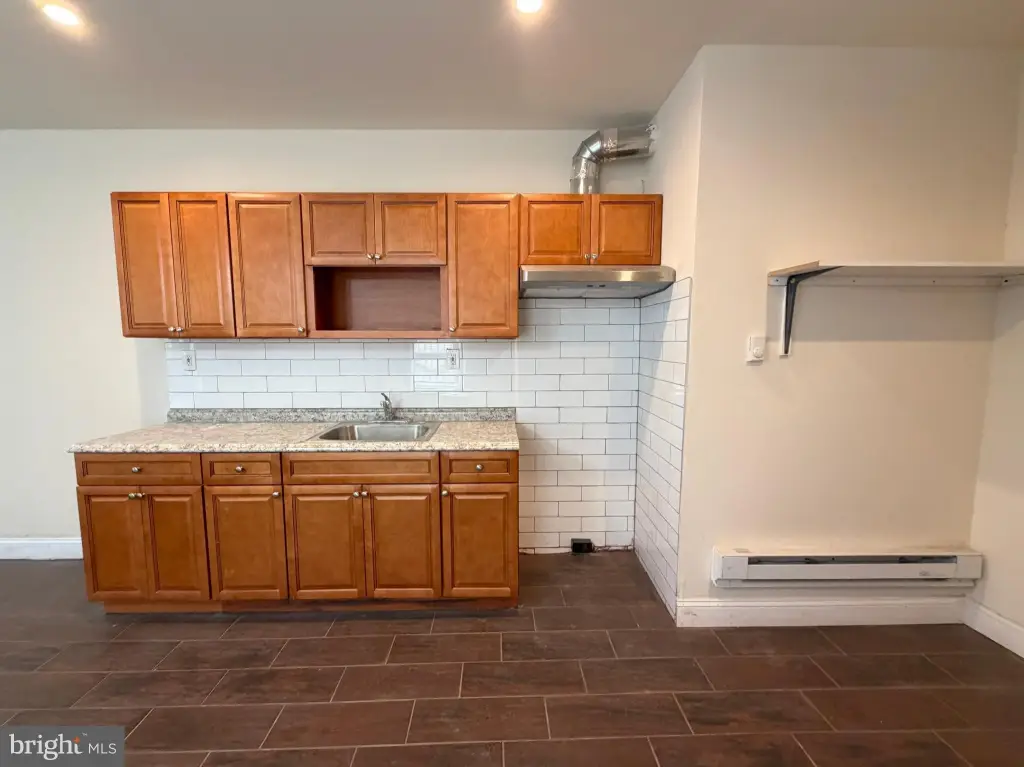
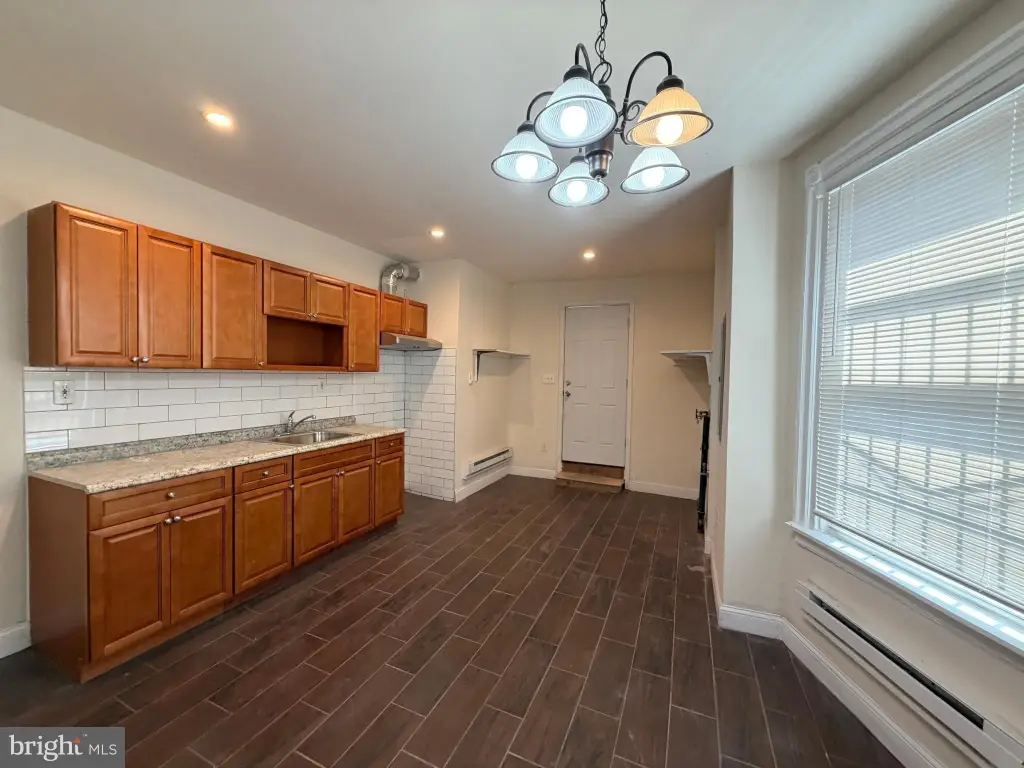
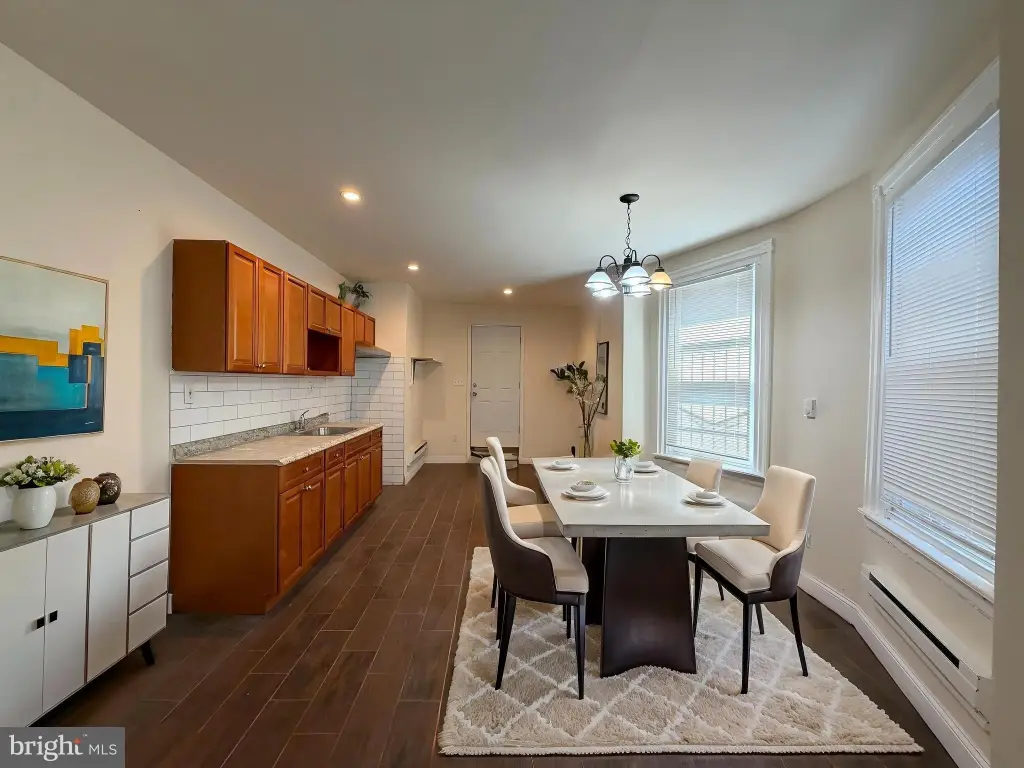
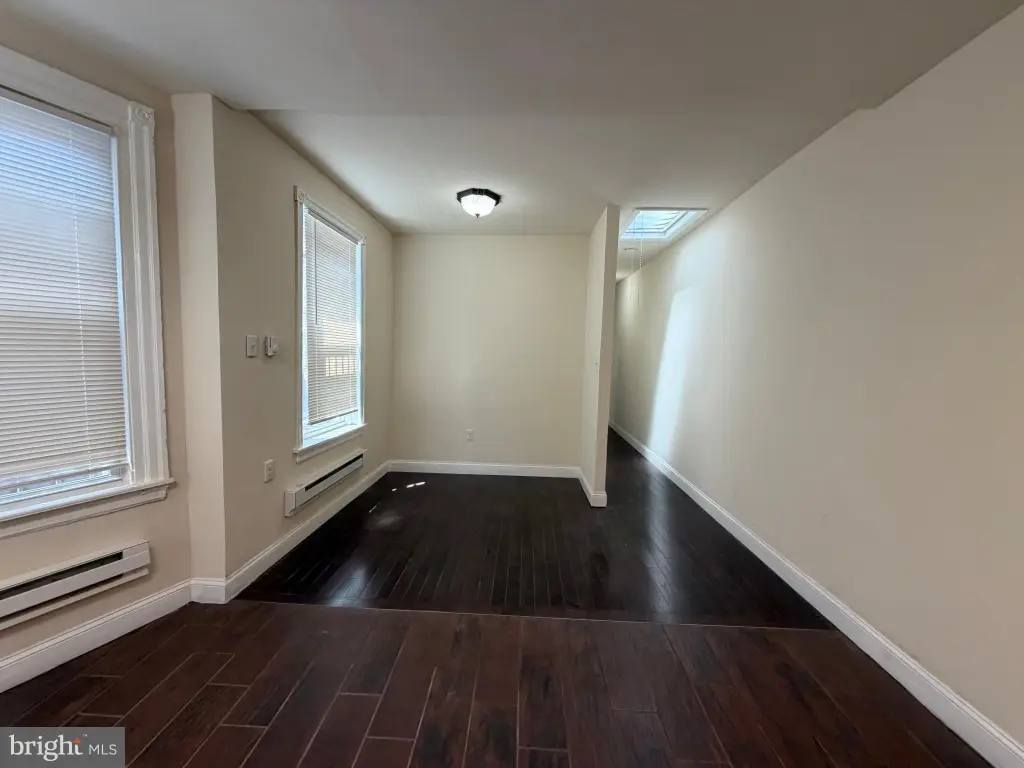
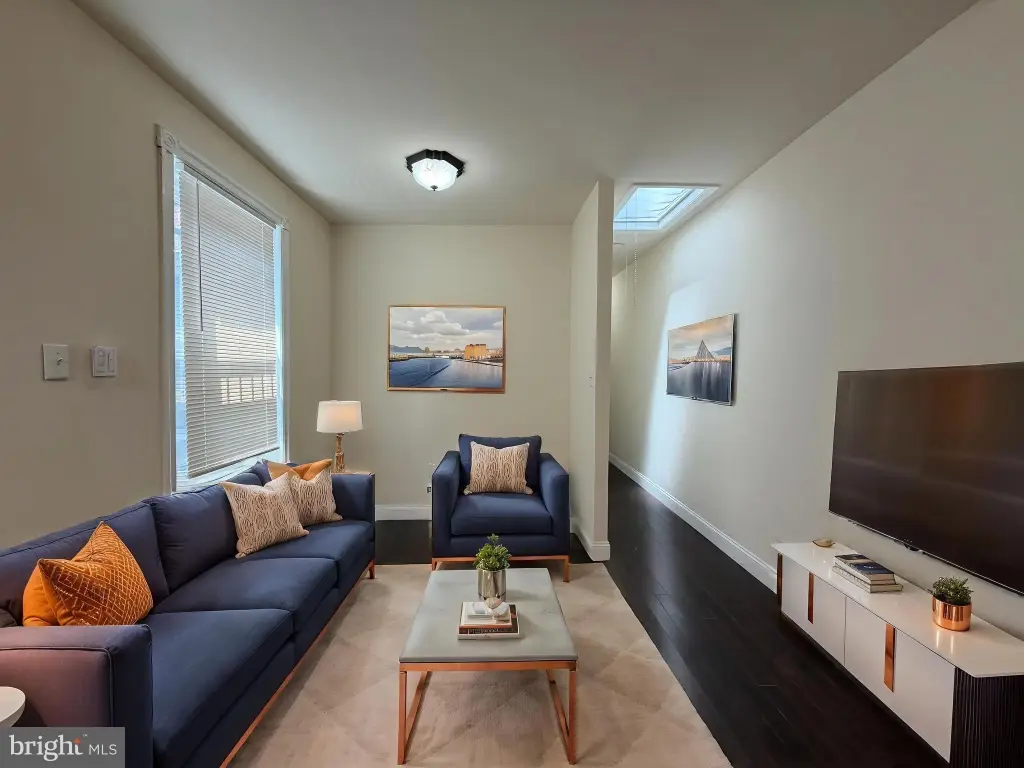
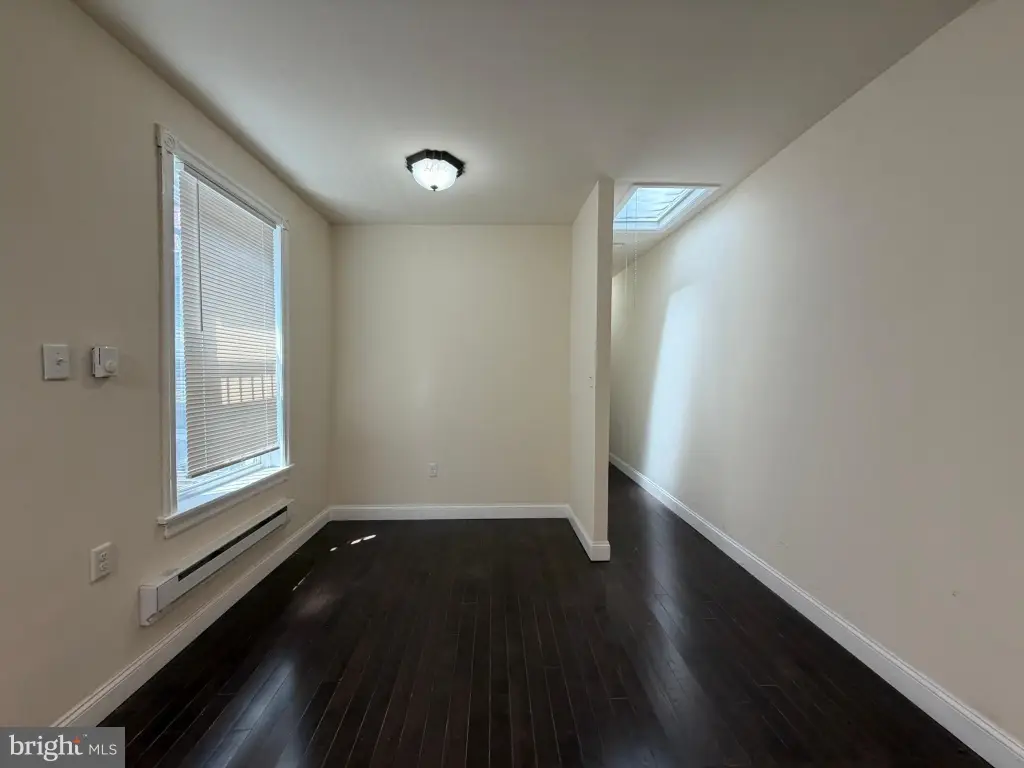
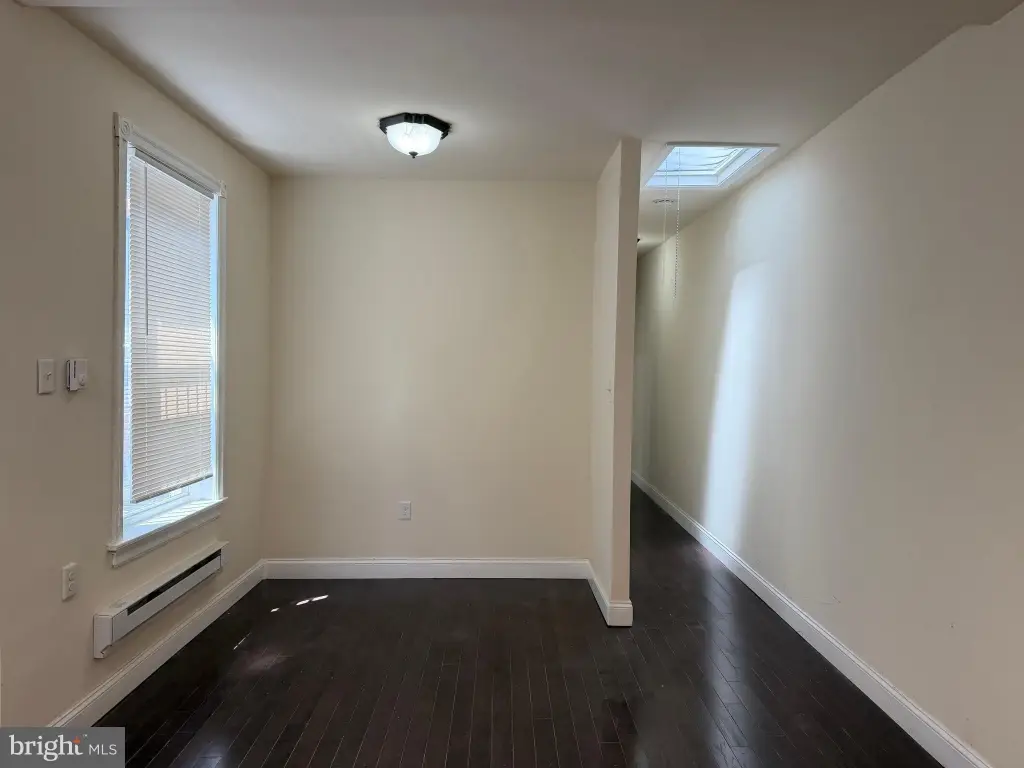
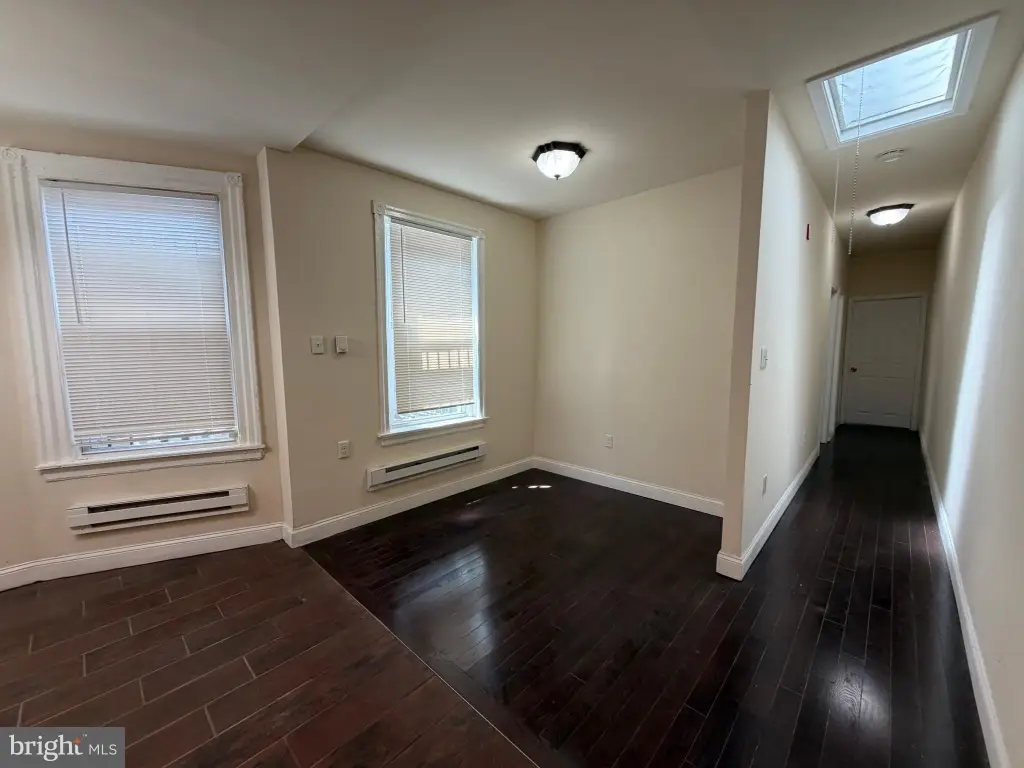
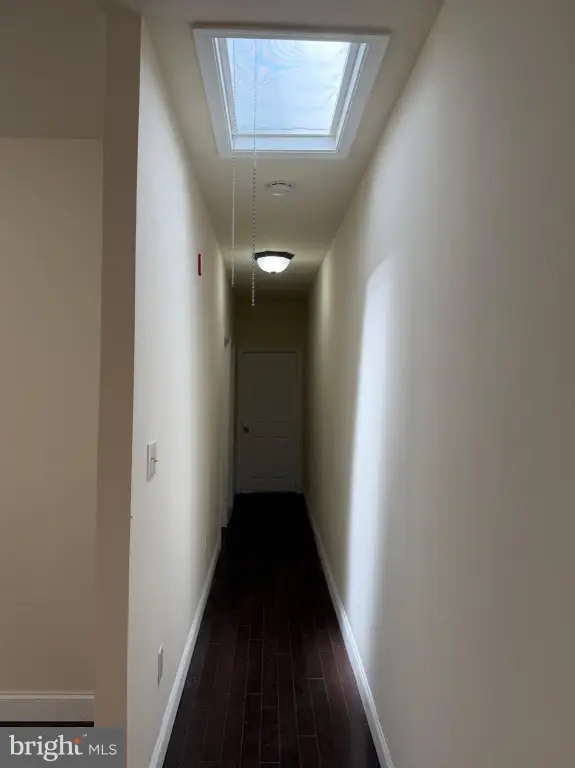
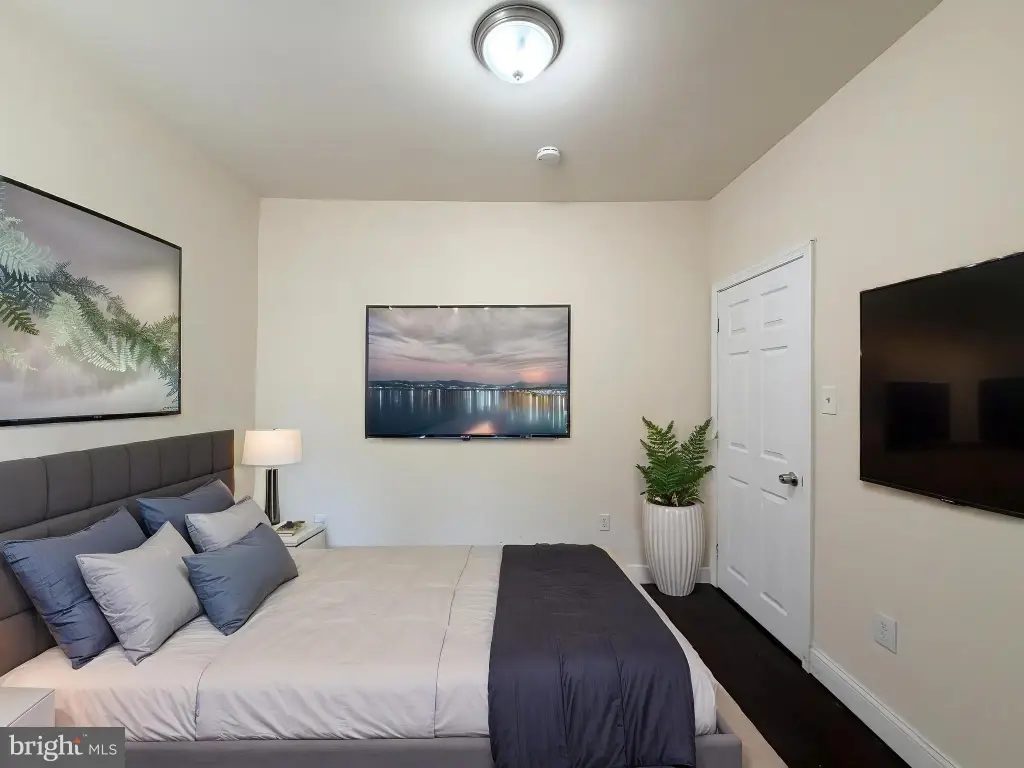
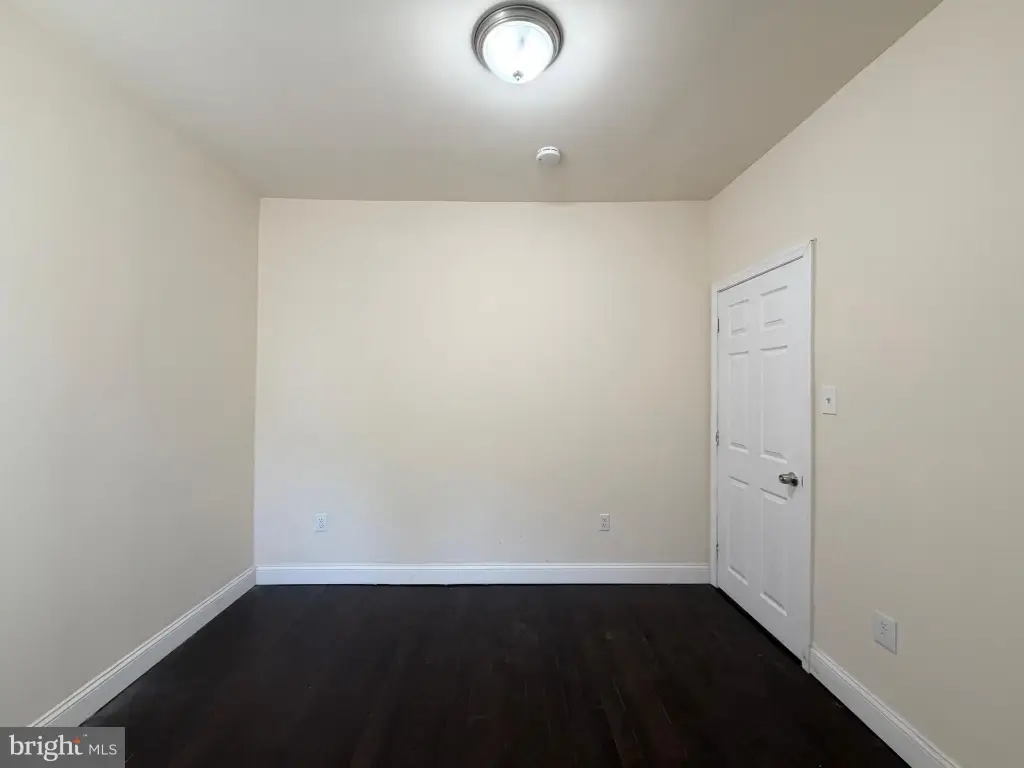
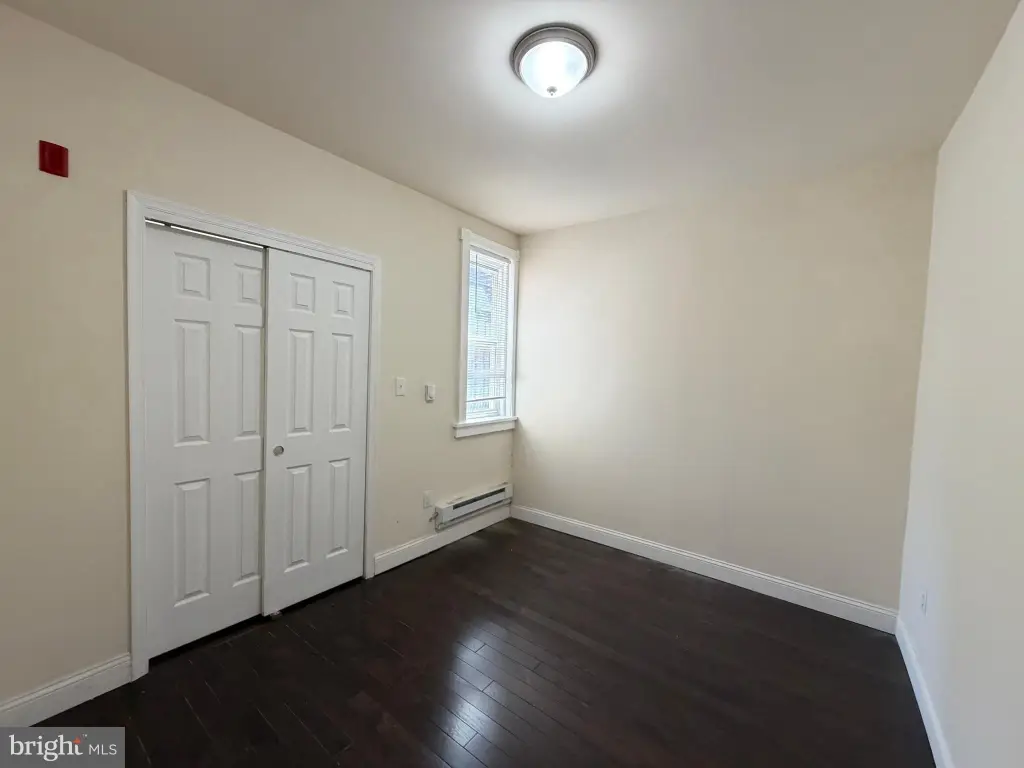
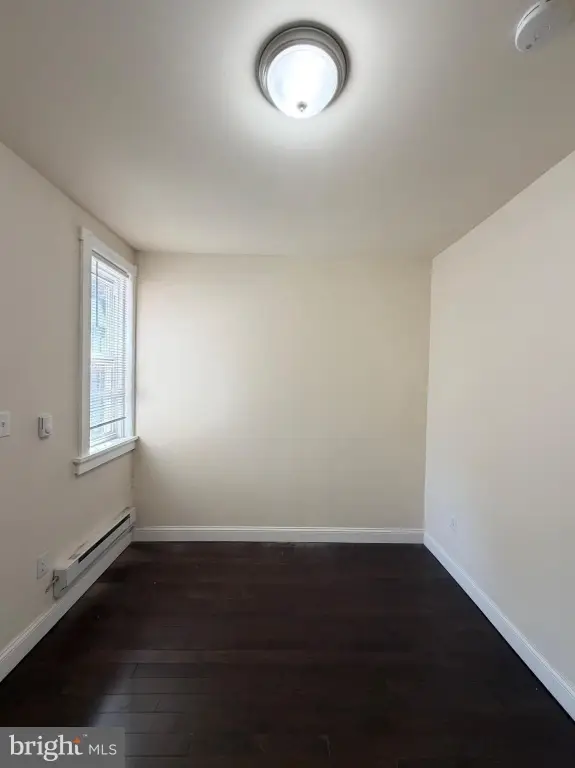
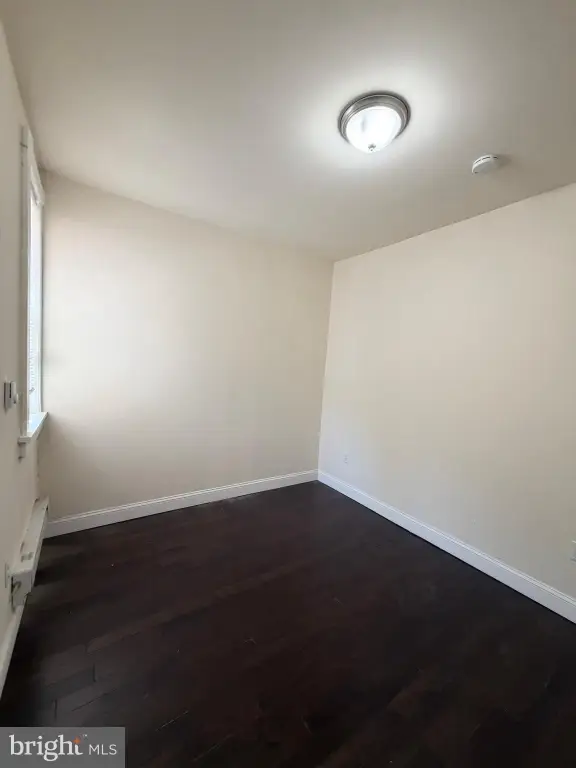
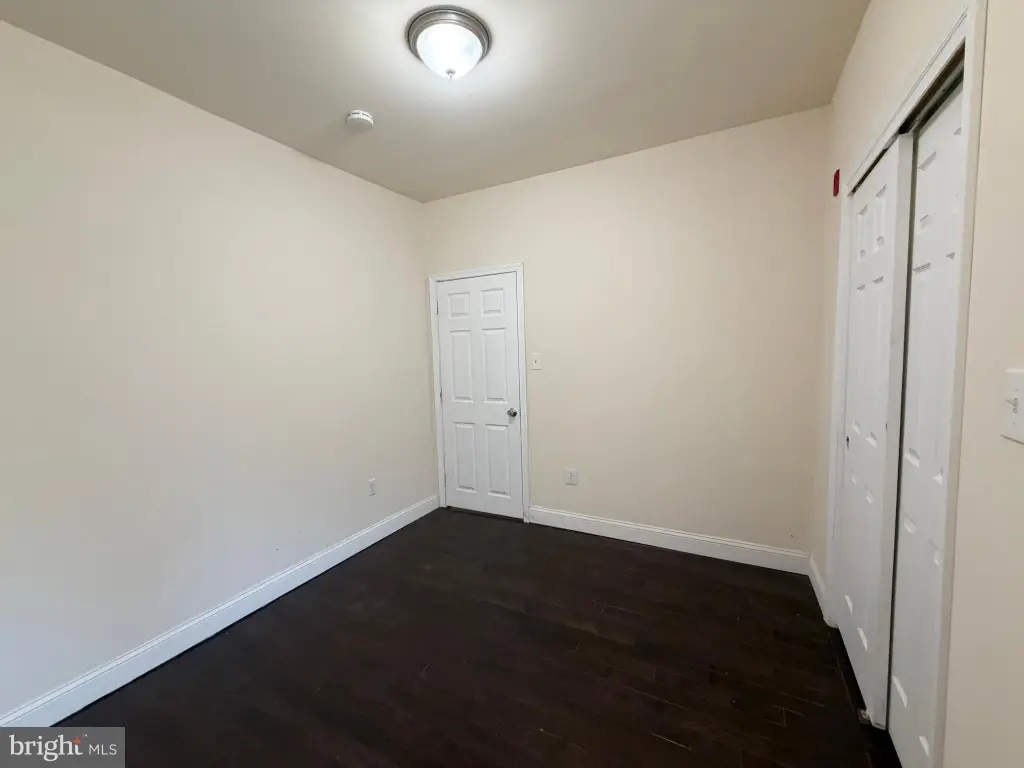
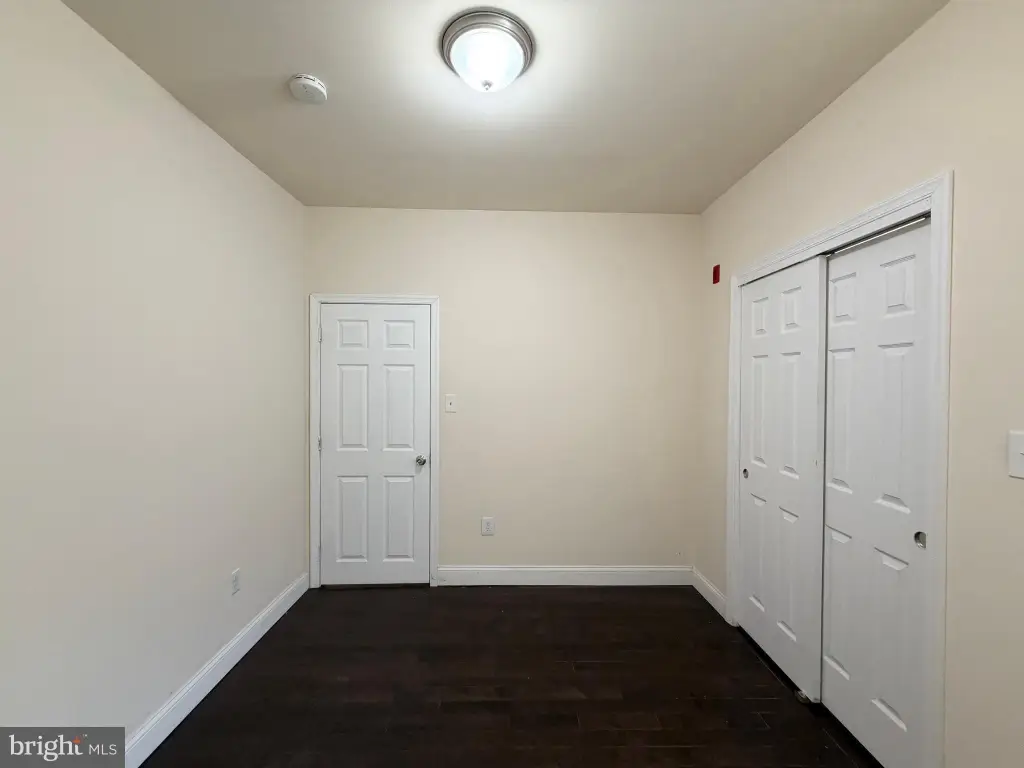
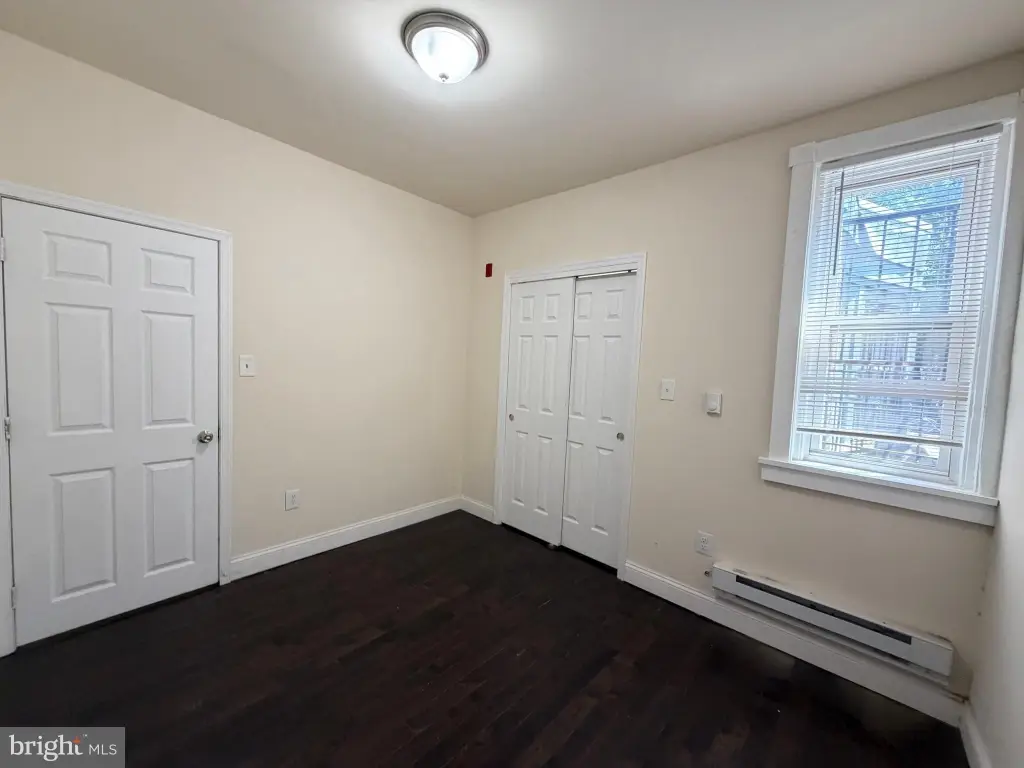
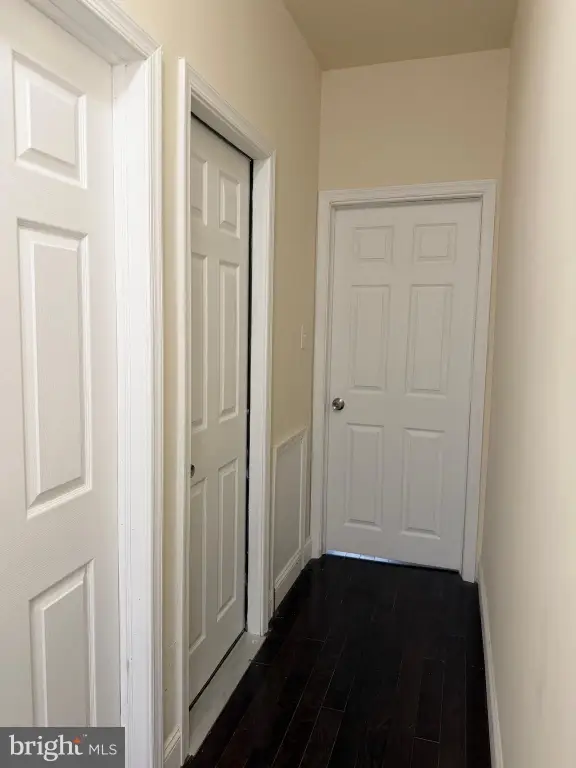
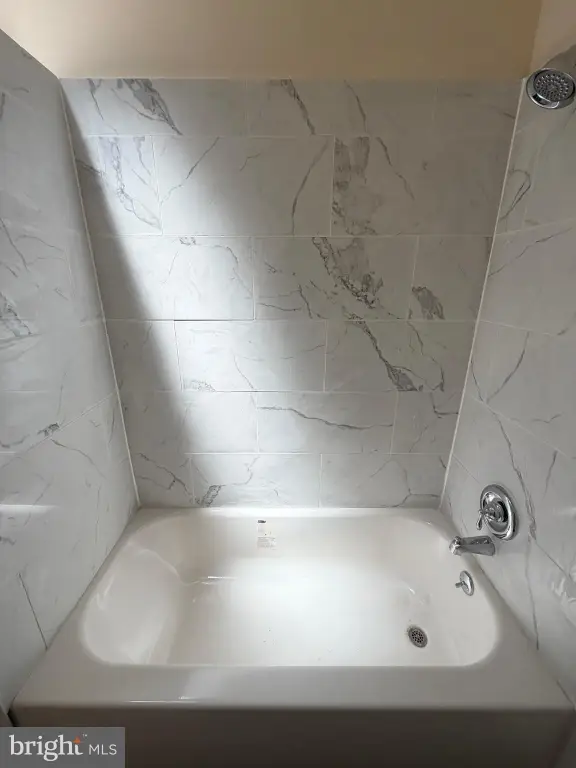
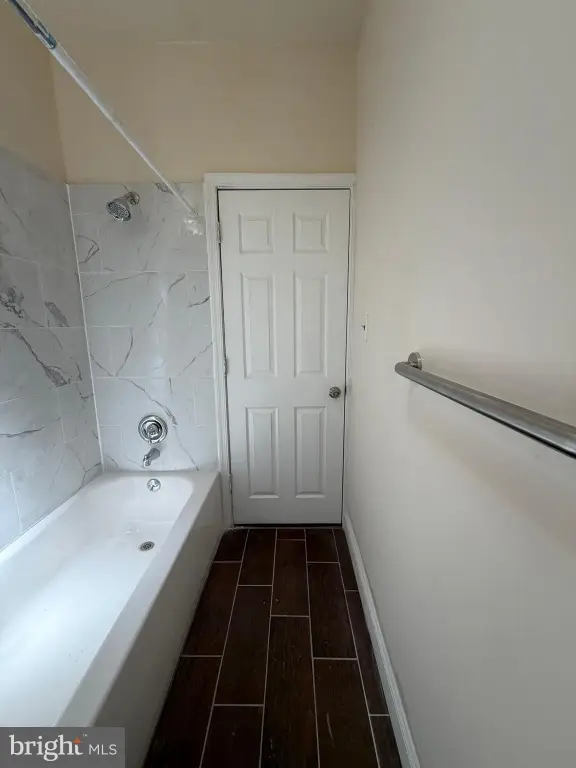
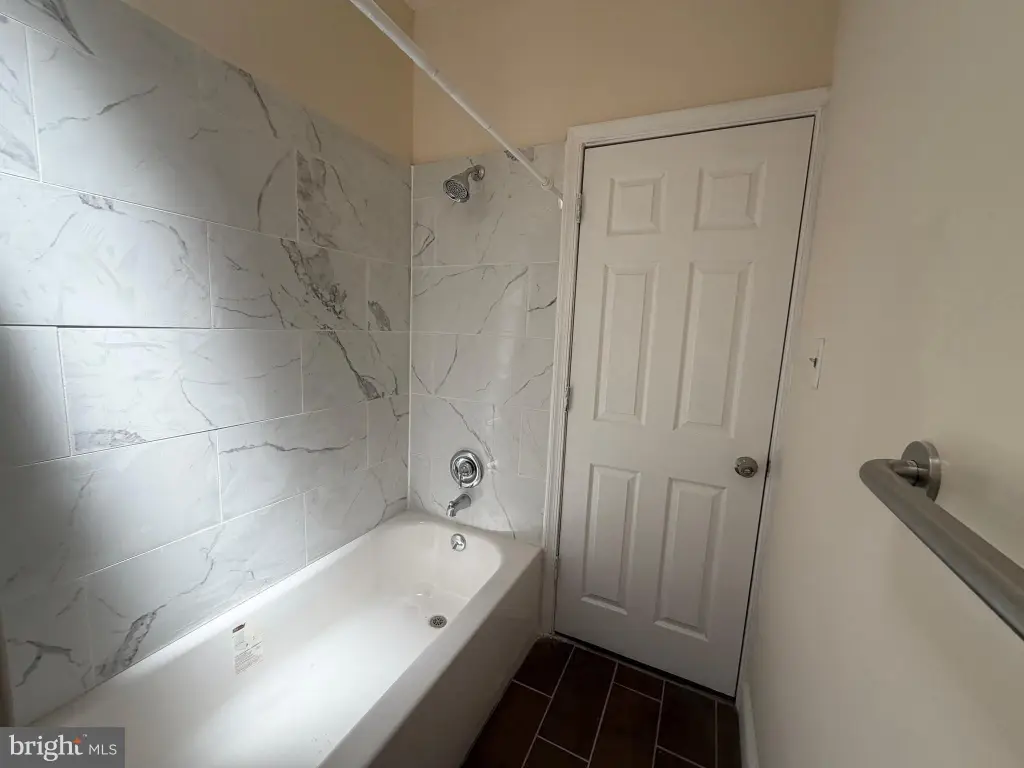
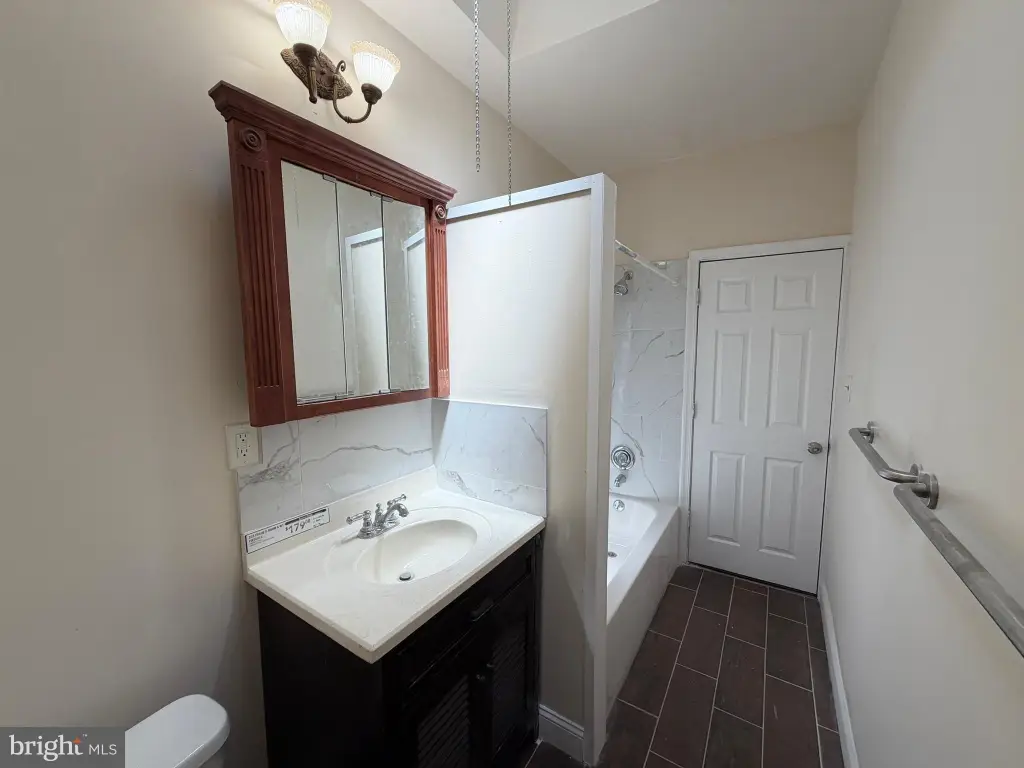
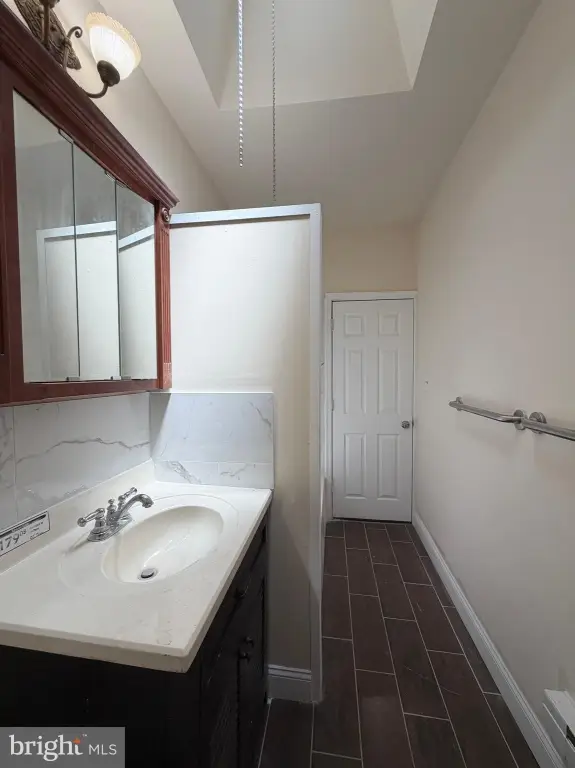
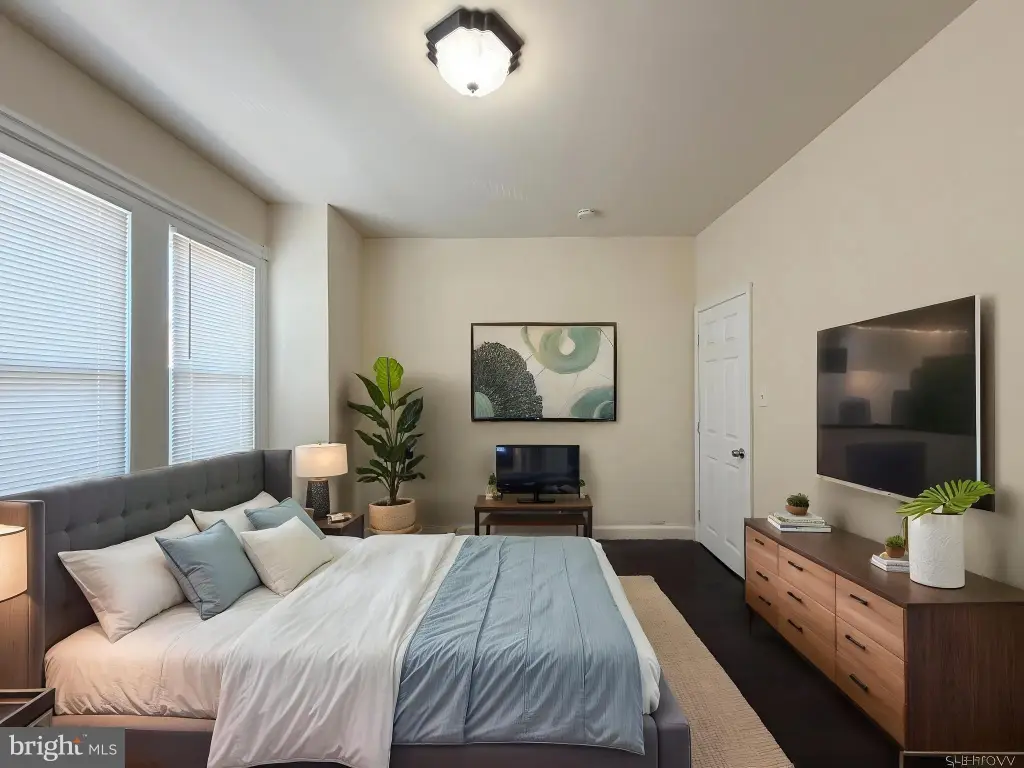
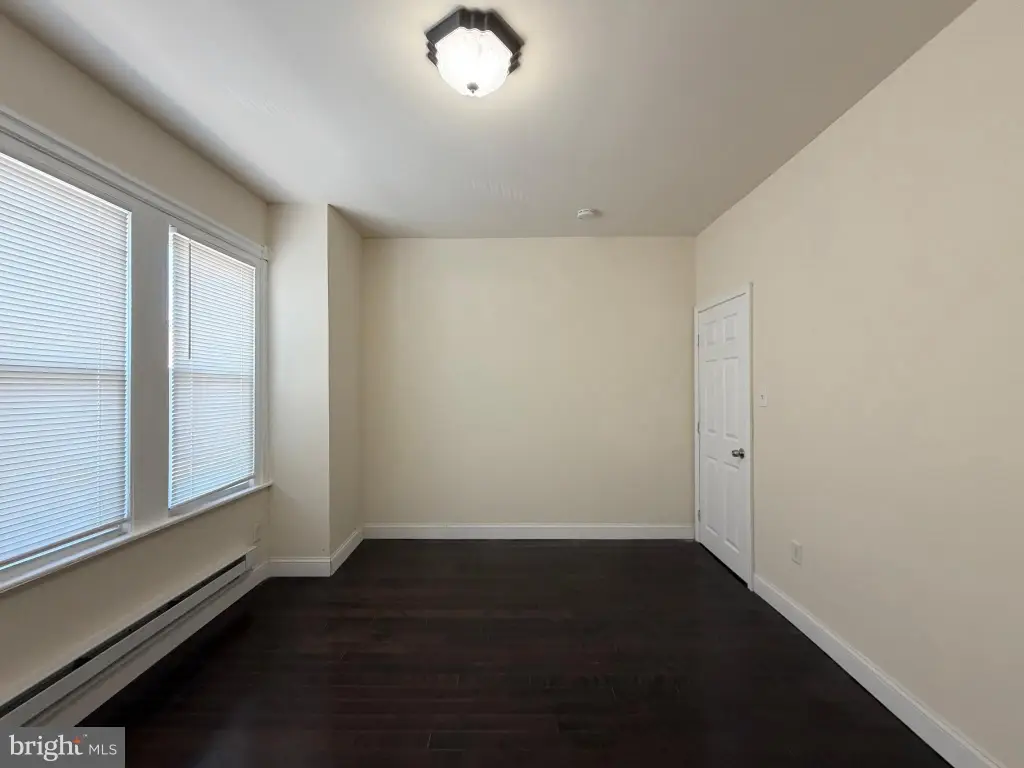
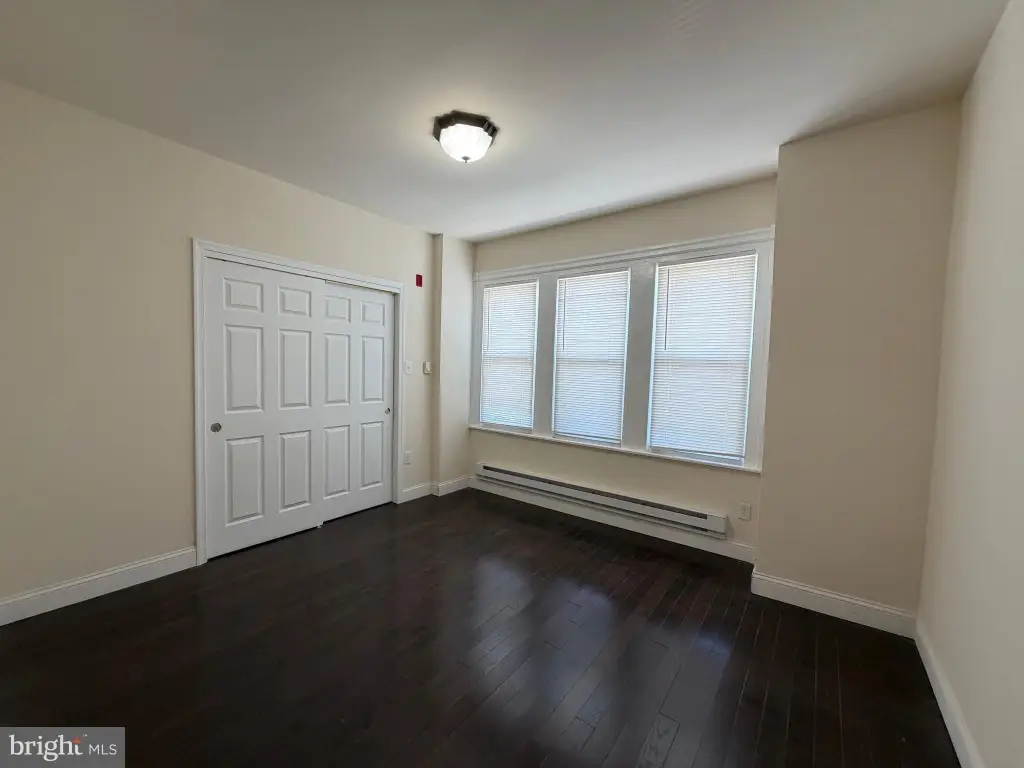
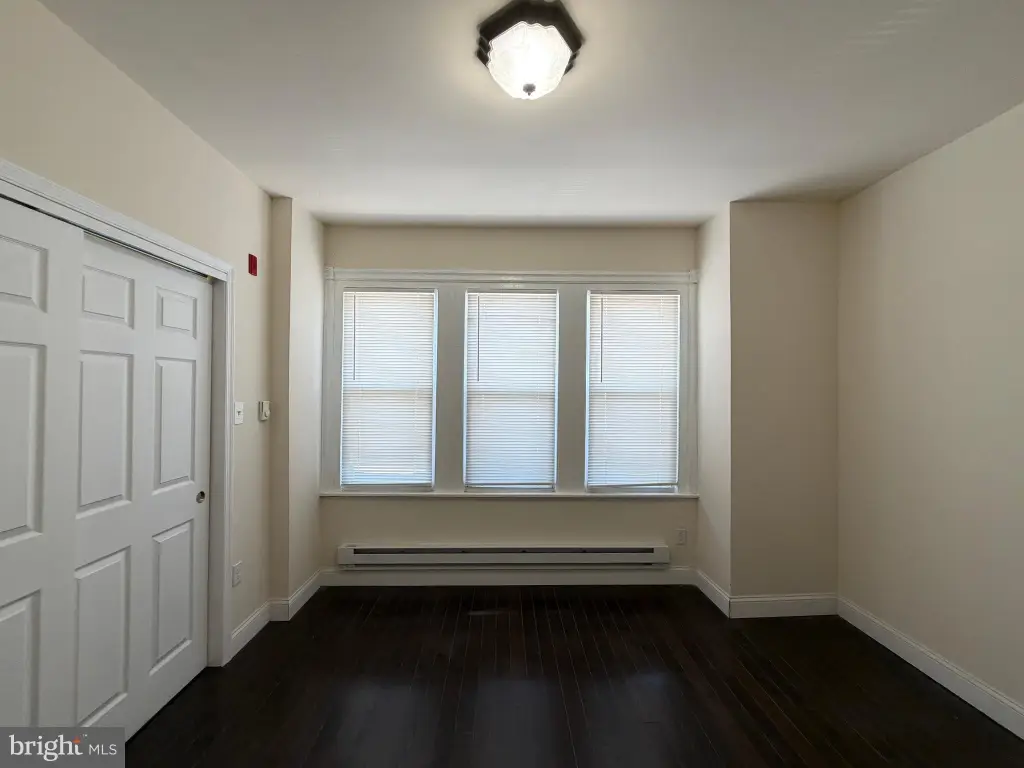
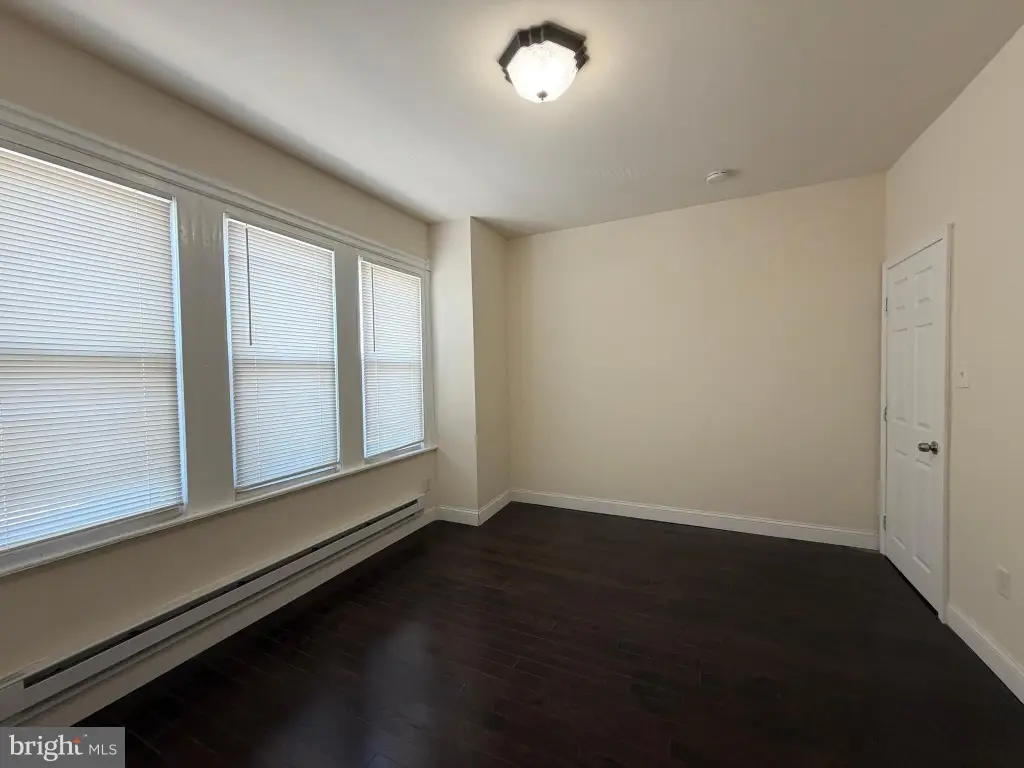
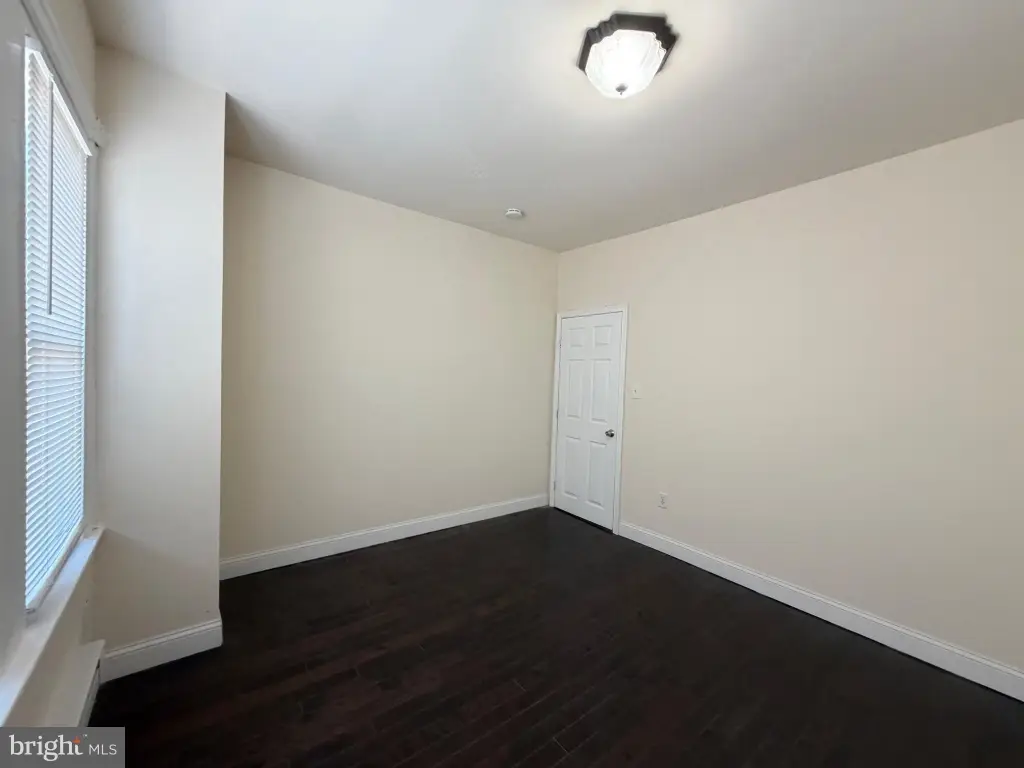
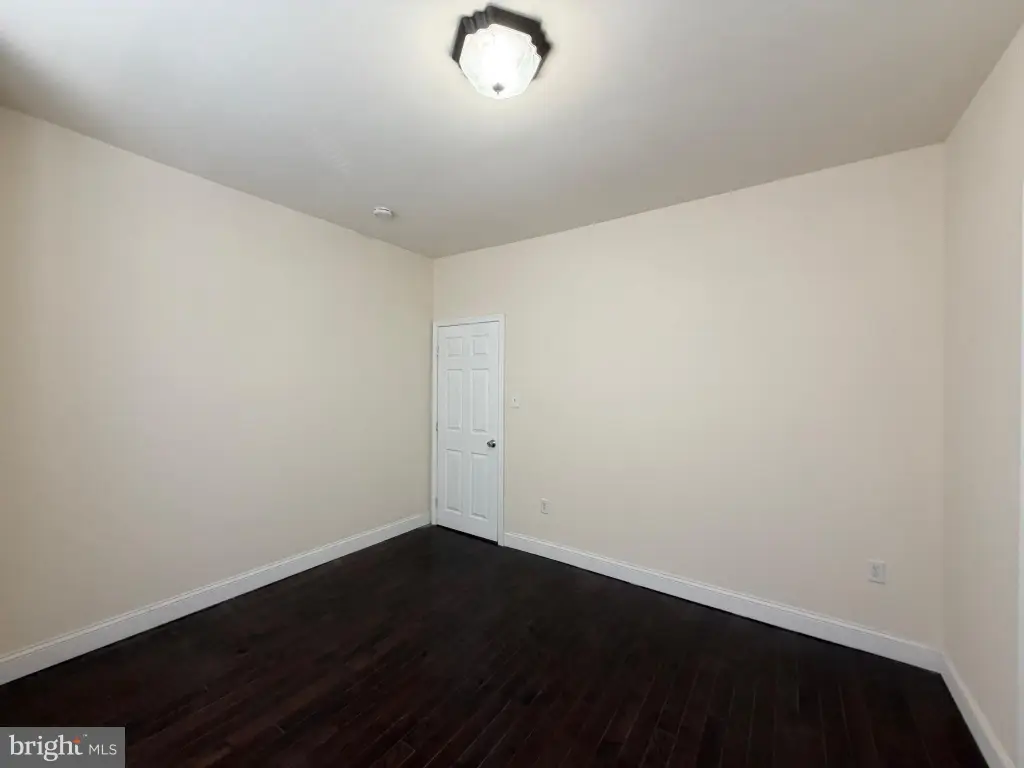
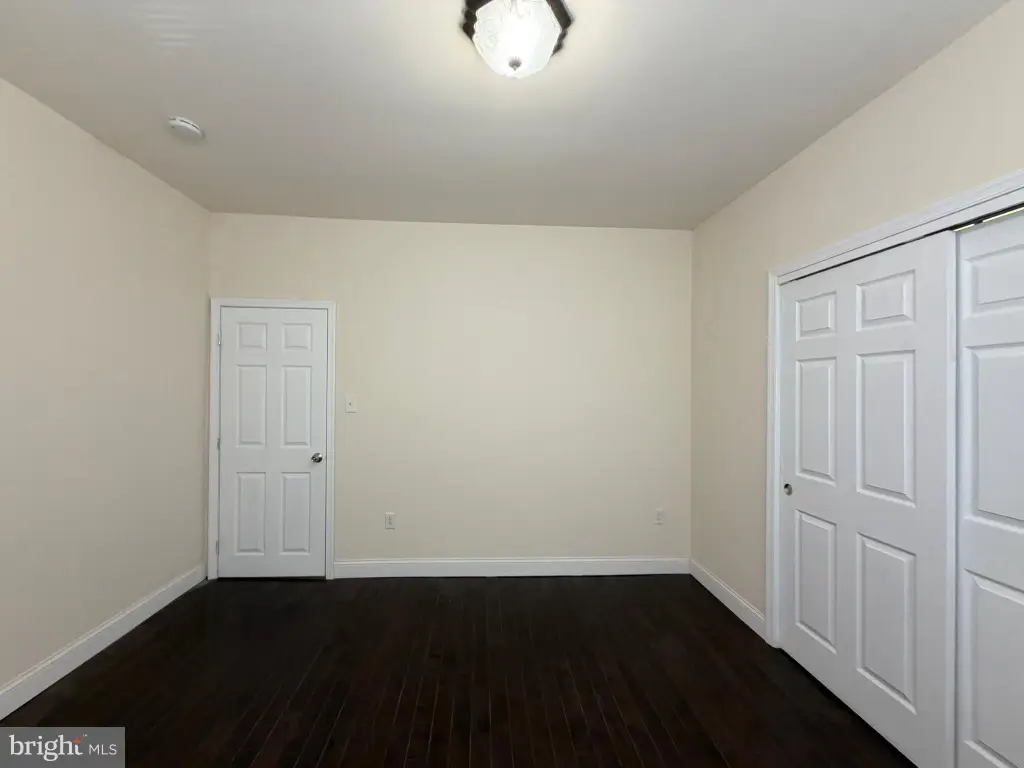
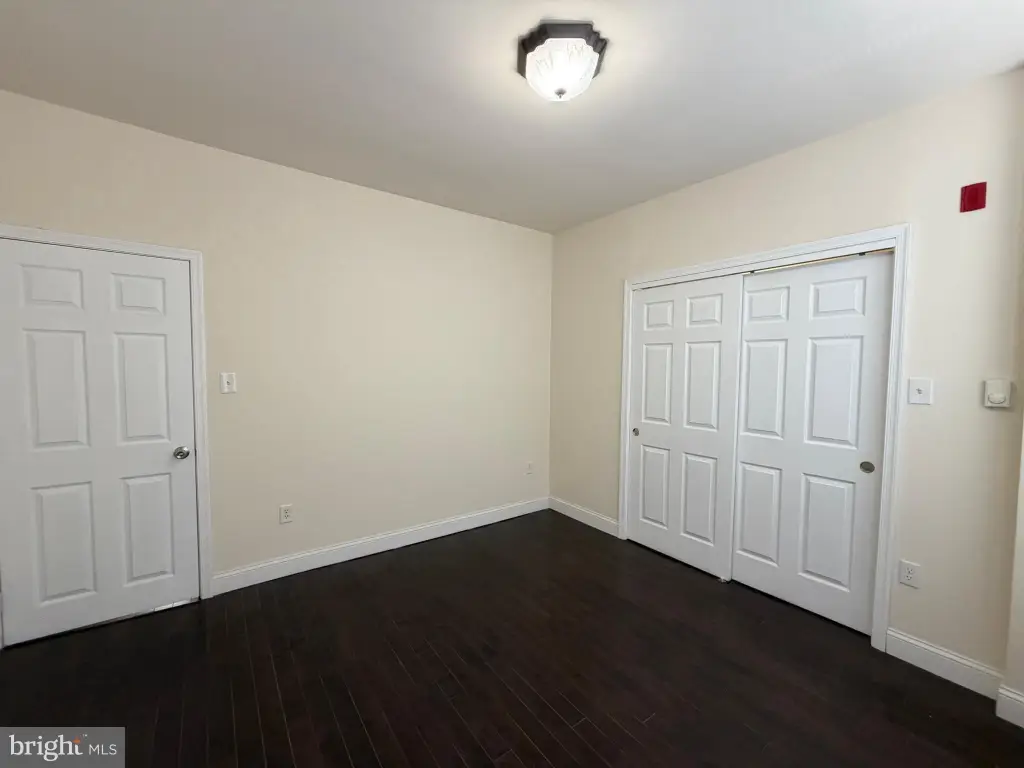
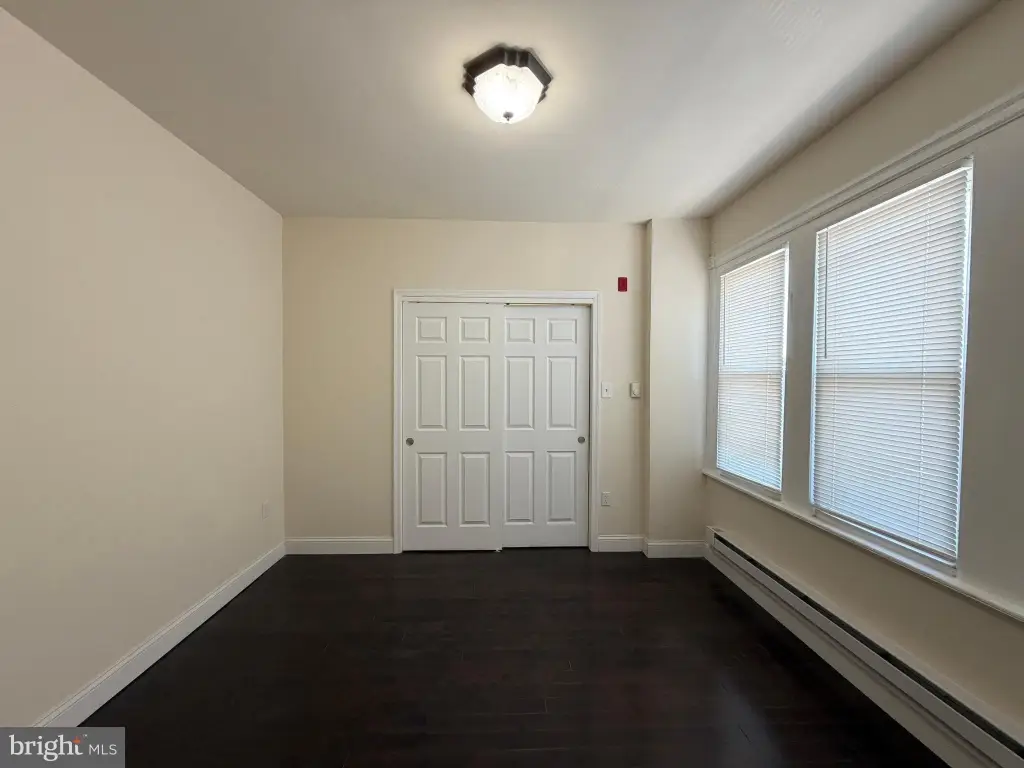
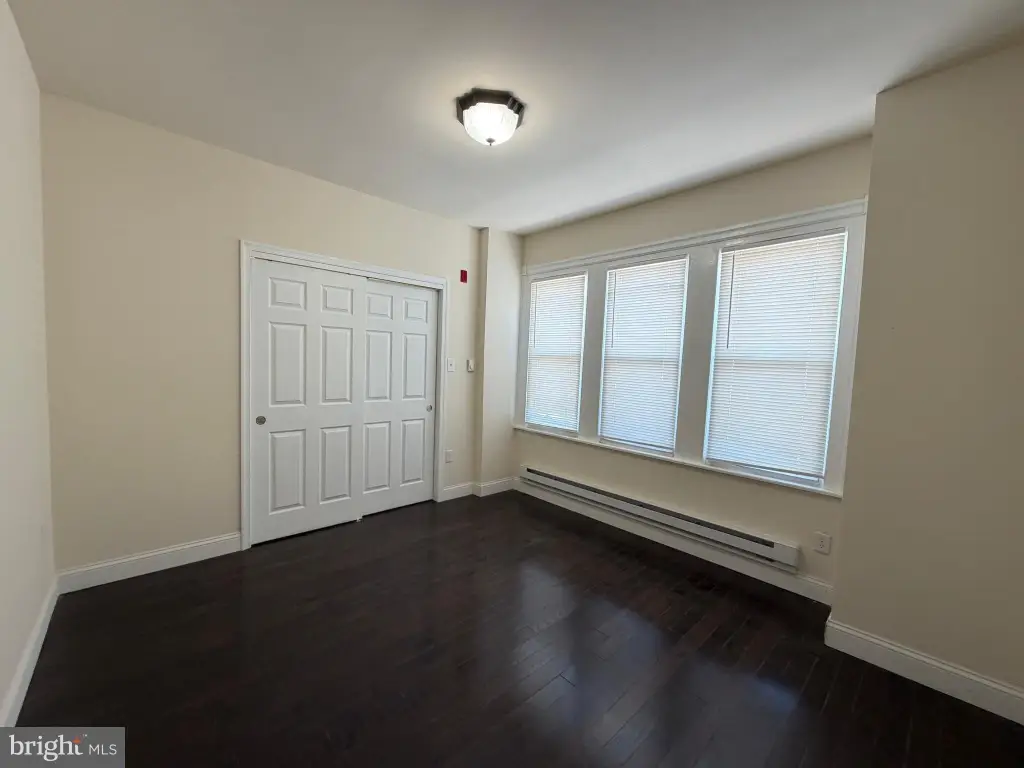
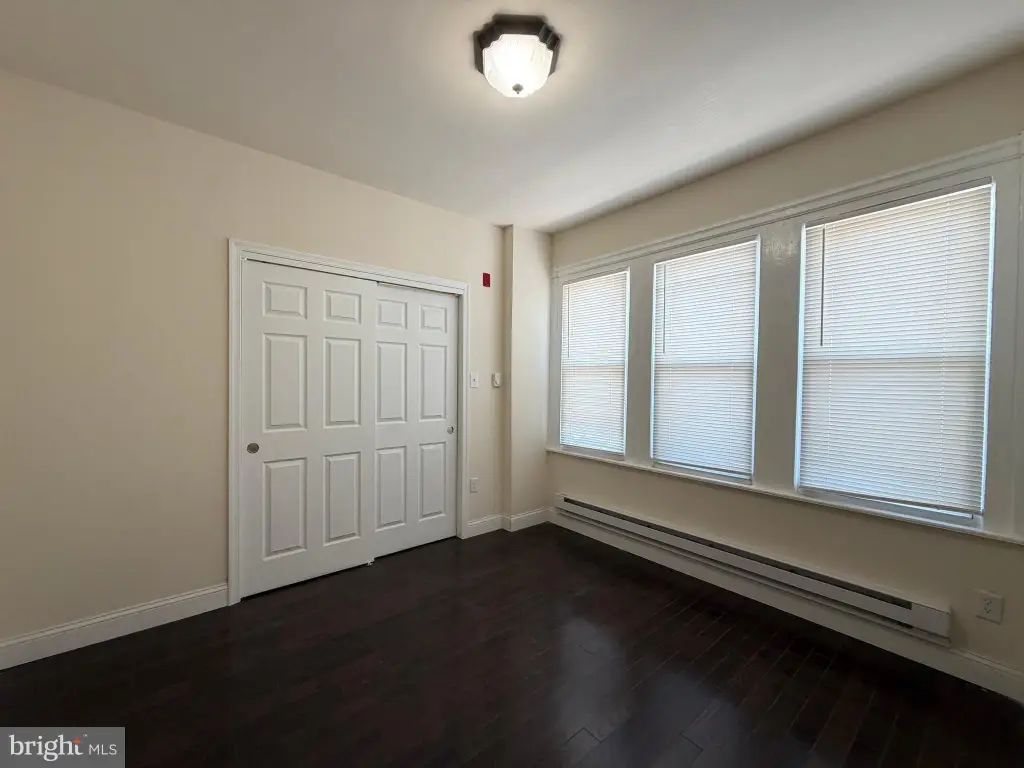
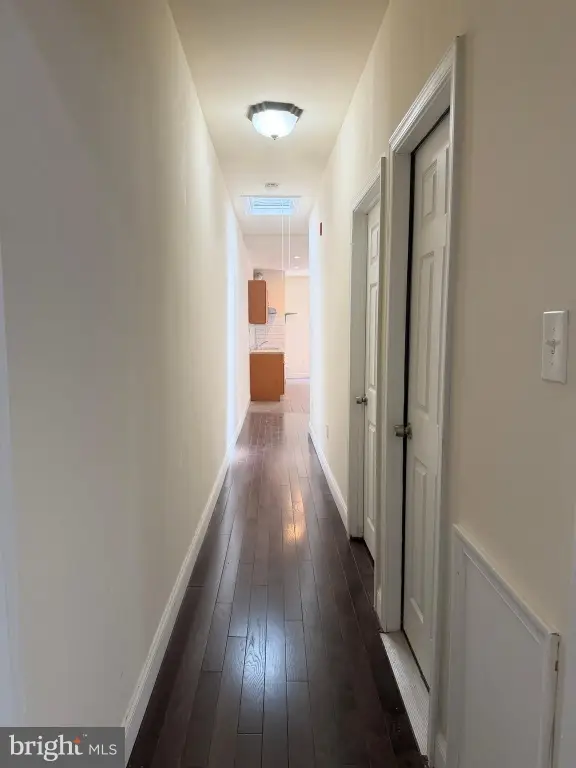
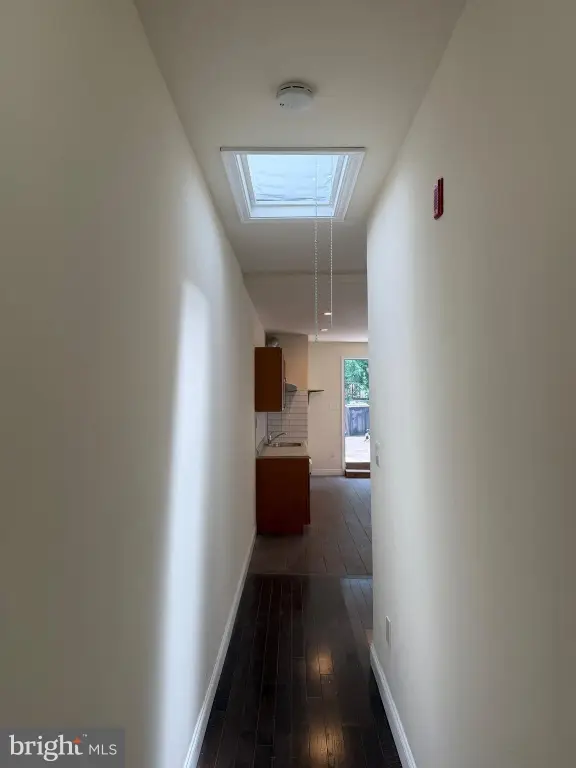
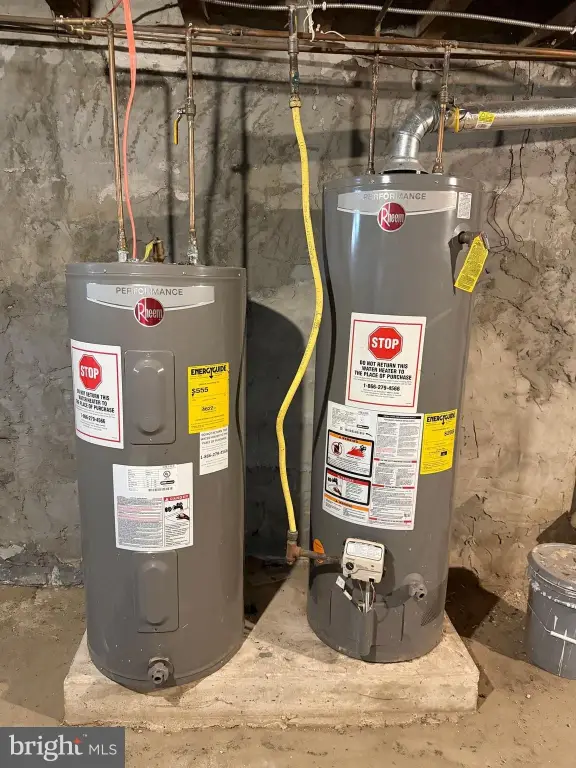
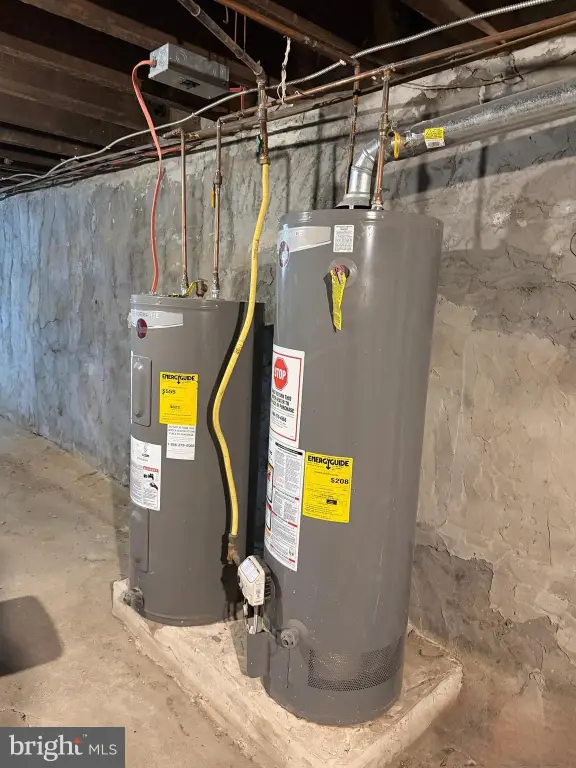
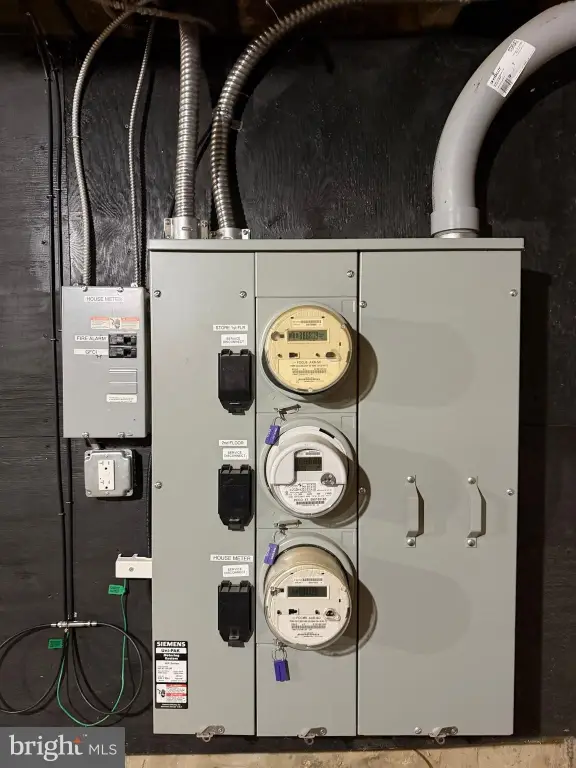
The upper residence has a separate rear entry and includes two bedrooms, one full bathroom, a living room, dining area, and kitchen with oak cabinetry, tile backsplash, recessed lighting, range, hood, skylight, and washer/dryer hookups. New tile flooring is installed in the kitchen, with hardwood flooring through the living areas and bedrooms. Utilities are separately metered, with two hot water heaters. The property sits at 5549 N 5TH Street in Philadelphia, within the 19120 ZIP code, with public transportation and a rear one-car driveway.
The upper residence has a separate rear entry and includes two bedrooms, one full bathroom, a living room, dining area, and kitchen with oak cabinetry, tile backsplash, recessed lighting, range, hood, skylight, and washer/dryer hookups. New tile flooring is installed in the kitchen, with hardwood flooring through the living areas and bedrooms. Utilities are separately metered, with two hot water heaters. The property sits at 5549 N 5TH Street in Philadelphia, within the 19120 ZIP code, with public transportation and a rear one-car driveway.
Key Highlights
- 1,950‑square‑foot mixed‑use property with retail space and a two‑bedroom apartment
- Commercial level includes glass frontage, LED lighting, shelving, built‑in sink, storage, and half bathroom
- Two‑bedroom apartment with one full bathroom, kitchen, living room, and dining area
Financial Insights
Estimated NOI and Cap Rate
NOI / Yr
$16,750
Cap Rate
3.99%
Suggested Prices Based on Cap Rates
Cap Rate 5%
$335,000
$335.0K
Cap Rate 7%
$239,286
$239.3K
Cap Rate 9%
$186,111
$186.1K
Market Conditions
NOI Build-Up for 1,950 SF
Gross rent
$26.7K $13.68/SF
− Vacancy
−$2.7K −$1.41/SF
EGI
$23.9K $12.27/SF
− OpEx
−$7.2K −$3.68/SF
NOI
$16.7K $8.59/SF
Area
ZIP 19120
Vacancy
10.30%
Lease Rate
$13.68 /SF/Yr
Expense Ratio
30.00%
Simulate Cap Rate and NOI
Suggested Prices Based on Cap Rates
Cap Rate 5%
$335,000
Cap Rate 7%
$239,286
Cap Rate 9%
$186,111
Alternative Uses
Best Use
Retail
$239.3K
$209.4K – $279.2K
NOI $16,750 @ 7.0% cap · market cap 3.99%
Second Best
Mixed Use
$239.0K
$209.1K – $278.9K
NOI $16,731 @ 7.0% cap · market cap 3.98%
Theoretical Best
Office A
$465.8K
$407.6K – $543.5K
NOI $32,607 @ 7.0% cap · market cap 7.77%
Zoning and permitted uses should be independently verified with authorities.
Property Analytics
Unlock full access to Insights
Subscribe to Realmo Intelligence
Open Analytics
Current Use
Lease Details
1
Residential units
Yes
Highway access
Yes
Utilities to site
Location Intelligence
Trade Area within ½ mile
1,658
Businesses Nearby
Explore this area
Business Placement
Demographics for 19120, PA
66,177
Population
25,730
Households
2.6
Avg Household Size
35
Median Age
13%
College-Educated
77%
High-School Grad
3.2 sq mi
ZIP Area
20,680
Density / Sq Mi
$51,993
Median Household Income
$32,980
Median Earnings
$1,186
Median Rent
$143,500
Median Home Value
Check the figures for this property
Cap Rate, Value Estimation, Potential NOI and more
View Realmo Analytics
Market
Vacancy Rate% for Office in Philadelphia, PA

Questions? Ask Rey
Realmo’s AI knows this listing — price, zoning, demand, history. Ask anything.





Frequently Asked Questions
What type of property is this?
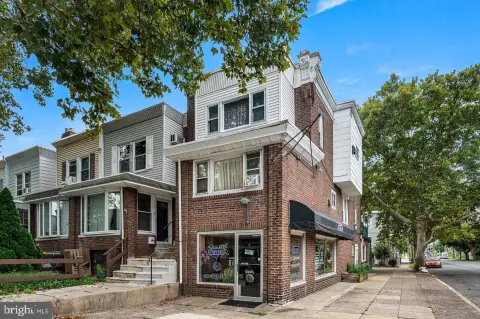
Mixed-use property - Ground-floor retail space pairs with a two-bedroom apartment, separate utilities, basement storage, and a rear driveway.
Where is this mixed-use property located?
The property is located at 5549 N 5TH Street Philadelphia, PA.
What is the asking price?
The asking price for this property is $419,900.
What are key features of this property?
This property features: 1,950‑square‑foot mixed‑use property with retail space and a two‑bedroom apartment; Commercial level includes glass frontage, LED lighting, shelving, built‑in sink, storage, and half bathroom; Two‑bedroom apartment with one full bathroom, kitchen, living room, and dining area


