Freestanding Office and Medical
For Sale
$2,275,000
5511 Princess Anne Rd, Virginia Beach, VA 23462
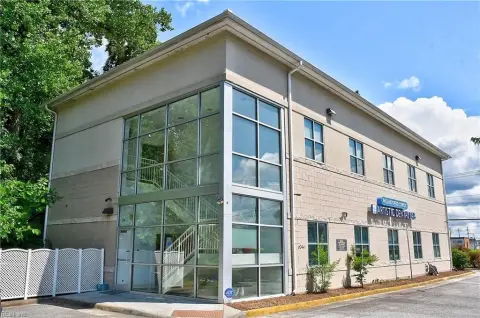
Two-story elevator-served office and medical building with 86 parking spaces and multiple suites on Princess Anne Road.
Property Size17,115 SF
Price / SF$132.92
Days on Market168
Property Features for 5511 Princess Anne Rd
General Information
Standard status
Active
Size
17,115 SF
Total Parking Spaces
86
Site & Location
Highway Access
Yes
Road Access
Yes
Building Details
Year Built
1987
Stories
2
Tenancy
Multi
Listing Agency:
RE/MAX Allegiance
Listed By:
Mark Rusnak · License #225031965
(757) 213-4505
Source:
Horakrealtygroup
Added: May 8
Changed: Oct 9
Last Checked: Oct 7 at 2:57PM
Displayed information is deemed reliable but is not guaranteed and should be independently verified. All listing content including descriptions, pricing, images are the copyrighted material of RE/MAX Allegiance

Ask AI about this property
Review the available facts, identify missing information and prepare questions for the agent.
Investment Insights
Based on property information with market context.
A two-story, elevator-served freestanding office and medical building designed to support a multi-tenant configuration. The property includes multiple suites, with landlord-covered common area maintenance and utilities including electric, water, and sewer (and gas in select units). Janitorial is also landlord-covered, while tenants handle in-suite services, telecom, and HVAC maintenance.
Located along Princess Anne Road in Virginia Beach, the building is positioned in a professional and medical corridor near Sentara Leigh Hospital. The asset provides ingress and egress from both traffic directions and includes signage exposure along a major arterial route.
The site offers 86 parking spaces across dual access lots, supporting convenient arrival and departure for employees, patients, and visitors. The overall setup supports either continued leasing activity or owner-occupancy with in-place income.
Located along Princess Anne Road in Virginia Beach, the building is positioned in a professional and medical corridor near Sentara Leigh Hospital. The asset provides ingress and egress from both traffic directions and includes signage exposure along a major arterial route.
The site offers 86 parking spaces across dual access lots, supporting convenient arrival and departure for employees, patients, and visitors. The overall setup supports either continued leasing activity or owner-occupancy with in-place income.
Key Highlights
- 17,185+ SF two‑story freestanding office and medical building built in 1987
- Multiple suites with stabilized tenancy and remaining vacancy for lease‑up or owner occupancy
- Elevator‑served layout with potential flexibility for multi‑tenant or single‑user use
Financial Insights
Estimated NOI and Cap Rate
NOI / Yr
$182,377
Cap Rate
8.02%
Suggested Prices Based on Cap Rates
Cap Rate 5%
$3,647,540
$3.6M
Cap Rate 7%
$2,605,386
$2.6M
Cap Rate 9%
$2,026,411
$2.0M
Market Conditions
NOI Build-Up for 17,115 SF
Gross rent
$328.6K $19.20/SF
− Vacancy
−$24.6K −$1.44/SF
EGI
$304.0K $17.76/SF
− OpEx
−$121.6K −$7.10/SF
NOI
$182.4K $10.66/SF
Area
ZIP 23462
Vacancy
7.50%
Lease Rate
$19.20 /SF/Yr
Expense Ratio
40.00%
Simulate Cap Rate and NOI
Suggested Prices Based on Cap Rates
Cap Rate 5%
$3,647,540
Cap Rate 7%
$2,605,386
Cap Rate 9%
$2,026,411
Alternative Uses
Best Use
Office B
$3.10M
$2.72M – $3.62M
NOI $217,305 @ 7.0% cap · market cap 9.55%
Second Best
Healthcare Medical
$2.61M
$2.28M – $3.04M
NOI $182,377 @ 7.0% cap · market cap 8.02%
Theoretical Best
Office A
$3.63M
$3.18M – $4.24M
NOI $254,441 @ 7.0% cap · market cap 11.18%
Zoning and permitted uses should be independently verified with authorities.
How Realmo checks its estimates
Property Analytics
Contact the owner directly
Get the owner's phone numbers and email
Open Analytics
Current Use
Lease Details
Multi-tenant
Tenancy
Yes
Highway access
Yes
Paved road access
Location Intelligence
Trade Area within ½ mile
559
Businesses Nearby
Explore this area
Business Placement
Demographics for 23462, VA
68,045
Population
29,729
Households
2.3
Avg Household Size
34
Median Age
31%
College-Educated
94%
High-School Grad
11.0 sq mi
ZIP Area
6,186
Density / Sq Mi
$69,680
Median Household Income
$43,613
Median Earnings
$1,652
Median Rent
$269,400
Median Home Value
Check the figures for this property
Cap Rate, Value Estimation, Potential NOI and more
View Realmo Analytics
Market
Vacancy Rate% for Office in South region





Frequently Asked Questions
What type of property is this?
Office unit - Two-story elevator-served office and medical building with 86 parking spaces and multiple suites on Princess Anne Road.
Where is this office unit located?
The property is located at 5511 Princess Anne Rd Virginia Beach, VA.
What is the asking price?
The asking price for this property is $2,275,000.
What are key features of this property?
This property features: 17,185+ SF two‑story freestanding office and medical building built in 1987; Multiple suites with stabilized tenancy and remaining vacancy for lease‑up or owner occupancy; Elevator‑served layout with potential flexibility for multi‑tenant or single‑user use