Flexible Flex Space with Roller
For Sale
$1,500,000
3259 Virginia Beach Boulevard, Virginia Beach, VA 23452
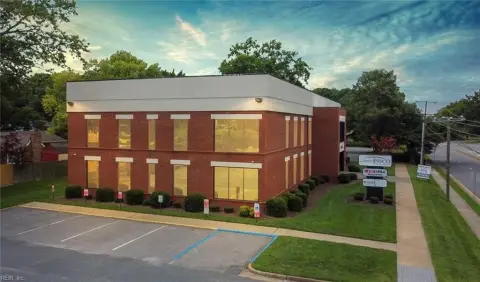
Flexible layout with separate entrances, rear service access, and fenced outdoor storage.
Property Size6,125 SF
Price / SF$244.90
Days on Market48
Property Features for 3259 Virginia Beach Boulevard
General Information
Standard status
Active
Size
6,125 SF
Total Parking Spaces
21
Site & Location
Road Access
Yes
Fenced Yard
Yes
Outdoor Storage
Yes
Amenities
large roller door
fenced outdoor storage area
outstanding signage opportunities
Building Details
Year Built
1960
Buildings
1
Listing Agency:
Atkinson Realty
Listed By:
Clay Atkinson
(757) 285-7055
Source:
Vineyardhomesva
Added: Sep 6
Changed: Oct 10
Last Checked: Oct 7 at 1:06PM
Displayed information is deemed reliable but is not guaranteed and should be independently verified. All listing content including descriptions, pricing, images are the copyrighted material of Atkinson Realty

Ask AI about this property
Review the available facts, identify missing information and prepare questions for the agent.
Investment Insights
Based on property information with market context.
Built in 1960, this 6,125-square-foot flex property offers a versatile commercial layout with front entry access and a rear roller door. The building can be arranged as two separate units, each with its own entrance, supporting owner-user occupancy, multiple businesses, or divided operations. The configuration is suited to retail, showroom, medical or professional office, and mechanical service uses.
The property is located at 3259 Virginia Beach Blvd in Virginia Beach, with visibility from Virginia Beach Blvd and signage opportunities. A fenced outdoor storage area extends the functional space, while 21 parking spaces support on-site access for occupants and visitors. The rear service access and adaptable floor plan provide practical options for businesses requiring storage, customer-facing space, or operational flexibility.
The property is located at 3259 Virginia Beach Blvd in Virginia Beach, with visibility from Virginia Beach Blvd and signage opportunities. A fenced outdoor storage area extends the functional space, while 21 parking spaces support on-site access for occupants and visitors. The rear service access and adaptable floor plan provide practical options for businesses requiring storage, customer-facing space, or operational flexibility.
Key Highlights
- 6,125 SF flex property built in 1960
- Layout can be divided into two units with separate front entrances
- Rear roller door provides service and loading access
Financial Insights
Estimated NOI and Cap Rate
NOI / Yr
$86,789
Cap Rate
5.79%
Suggested Prices Based on Cap Rates
Cap Rate 5%
$1,735,780
$1.7M
Cap Rate 7%
$1,239,843
$1.2M
Cap Rate 9%
$964,322
$964.3K
Market Conditions
NOI Build-Up for 6,125 SF
Gross rent
$141.1K $23.04/SF
− Vacancy
−$25.4K −$4.15/SF
EGI
$115.7K $18.89/SF
− OpEx
−$28.9K −$4.72/SF
NOI
$86.8K $14.17/SF
Area
ZIP 23452
Vacancy
18.00%
Lease Rate
$23.04 /SF/Yr
Expense Ratio
25.00%
Simulate Cap Rate and NOI
Suggested Prices Based on Cap Rates
Cap Rate 5%
$1,735,780
Cap Rate 7%
$1,239,843
Cap Rate 9%
$964,322
Alternative Uses
Best Use
Office B
$1.24M
$1.08M – $1.45M
NOI $86,789 @ 7.0% cap · market cap 5.79%
Second Best
Retail
$916.3K
$801.8K – $1.07M
NOI $64,143 @ 7.0% cap · market cap 4.28%
Theoretical Best
Office A
$1.59M
$1.39M – $1.85M
NOI $111,132 @ 7.0% cap · market cap 7.41%
Zoning and permitted uses should be independently verified with authorities.
How Realmo checks its estimates
Property Analytics
Who owns this building?
See the owner, sales and loan history
Open Analytics
Current Use
Lease Details
Yes
Fenced yard
Yes
Paved road access
Location Intelligence
Trade Area within ½ mile
1,125
Businesses Nearby
Balanced
Demand for This Use
Explore this area
Business Placement
Demographics for 23452, VA
59,076
Population
23,455
Households
2.5
Avg Household Size
37
Median Age
35%
College-Educated
95%
High-School Grad
15.1 sq mi
ZIP Area
3,912
Density / Sq Mi
$77,327
Median Household Income
$44,009
Median Earnings
$1,571
Median Rent
$324,000
Median Home Value
Check the figures for this property
Cap Rate, Value Estimation, Potential NOI and more
View Realmo Analytics
Market
Vacancy Rate% for Office in South region




Similar Off Market Nearby
- Traditions Catering & Events — 3636 Virginia Beach Blvd #108, Virginia Beach, VA 23452
- Traditions Catering — 3636 Virginia Beach Blvd #108, Virginia Beach, VA 23452
- Cattalani's — 3322 Virginia Beach Blvd, Virginia Beach, VA 23452
- Ellen's Cuisines — 3322 Virginia Beach Blvd #101A, Virginia Beach, VA 23452
- Hadassah's Cuisine — 3322 Virginia Beach Blvd #101A, Virginia Beach, VA 23452
Frequently Asked Questions
What type of property is this?
Flex space - Flexible layout with separate entrances, rear service access, and fenced outdoor storage.
Where is this flex space located?
The property is located at 3259 Virginia Beach Boulevard Virginia Beach, VA.
What is the asking price?
The asking price for this property is $1,500,000.
What are key features of this property?
This property features: 6,125 SF flex property built in 1960; Layout can be divided into two units with separate front entrances; Rear roller door provides service and loading access