Two-Family Residential Income
For Sale
$469,999
55 Lexington Ave, North Providence, RI 02904
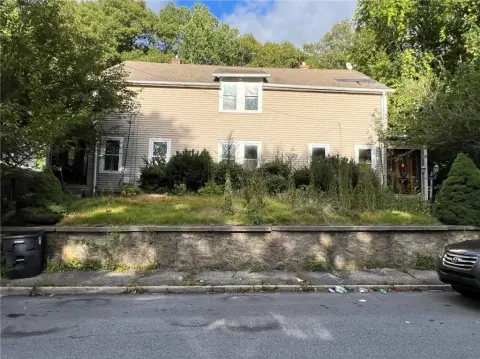
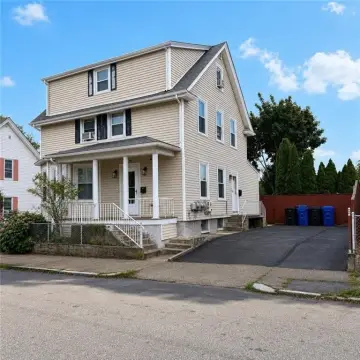
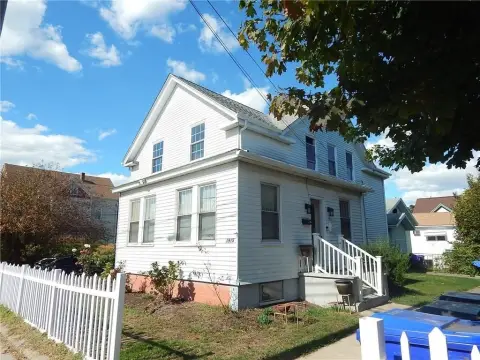
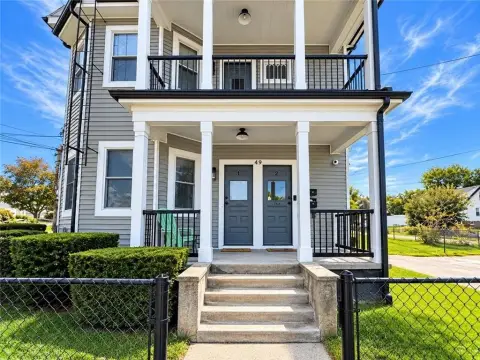
Well-maintained two-family home with two vacant units at closing, gas stoves, and town water and sewer.
Property Size2,501 SF
Price / SF$187.92
Days on Market98
Property Features for 55 Lexington Ave
General Information
Standard status
Active
Size
2,501 SF
Property subtype
Multi-Family
Additional Details
Utilities to Site
Yes
Multifamily Units
2
Amenities
yard
front porch
storage shed
driveway
Building Details
Year Built
1900
Tenancy
Multi
Listing Agency:
RE/MAX Town & Country
Listed By:
Blanchet Group
(401) 335-3344
Source:
Alpernandmesenbourg
Added: Jul 21
Changed: Oct 25
Last Checked: Oct 24 at 7:01PM
Displayed information is deemed reliable but is not guaranteed and should be independently verified. All listing content including descriptions, pricing, images are the copyrighted material of RE/MAX Town & Country

Ask AI about this property
Review the available facts, identify missing information and prepare questions for the agent.
Investment Insights
Based on property information with market context.
This well-maintained two-family home offers a flexible setup for either owner-occupancy or rental use, with both units vacant at closing. The first-floor unit includes a spacious eat-in kitchen with a gas stove, a living room with hardwood flooring and a built-in A/C unit, a full bath, and a bedroom with double closet storage and a second built-in A/C unit. The second-floor unit features an eat-in kitchen with a gas stove, a full bath, a dining room/living room that may serve as a second bedroom, and a bedroom. New carpeting is noted in the living areas, along with a built-in A/C unit in the living room, and there is an exterior staircase and deck.
The property sits on a large lot with a welcoming front porch, a storage shed, and a long driveway providing off-street parking. Updates include a roof approximately 6 years old and new gutters with gutter guards installed about 2 years ago. The home is connected to town water and sewer, and tenants pay their own utilities.
The property sits on a large lot with a welcoming front porch, a storage shed, and a long driveway providing off-street parking. Updates include a roof approximately 6 years old and new gutters with gutter guards installed about 2 years ago. The home is connected to town water and sewer, and tenants pay their own utilities.
Key Highlights
- Two‑family home with both units vacant at closing for owner occupancy or rental income
- Year built 1900; each unit features an eat‑in kitchen with gas stove
- First‑floor living room has hardwood flooring and built‑in A/C; second built‑in A/C in the bedroom
Financial Insights
Estimated NOI and Cap Rate
NOI / Yr
$41,643
Cap Rate
8.86%
Suggested Prices Based on Cap Rates
Cap Rate 5%
$832,860
$832.9K
Cap Rate 7%
$594,900
$594.9K
Cap Rate 9%
$462,700
$462.7K
Market Conditions
NOI Build-Up for 2,501 SF
Gross rent
$63.6K $25.44/SF
− Vacancy
−$4.1K −$1.65/SF
EGI
$59.5K $23.79/SF
− OpEx
−$17.8K −$7.14/SF
NOI
$41.6K $16.65/SF
Area
Providence County, RI
Vacancy
6.50%
Lease Rate
$25.44 /SF/Yr
Expense Ratio
30.00%
Simulate Cap Rate and NOI
Suggested Prices Based on Cap Rates
Cap Rate 5%
$832,860
Cap Rate 7%
$594,900
Cap Rate 9%
$462,700
Alternative Uses
Best Use
Multifamily LT 5
$594.9K
$520.5K – $694.1K
NOI $41,643 @ 7.0% cap · market cap 8.86%
Second Best
Apartment 5plus
$472.1K
$413.1K – $550.8K
NOI $33,050 @ 7.0% cap · market cap 7.03%
Theoretical Best
—
—
same as Best Use
Zoning and permitted uses should be independently verified with authorities.
How Realmo checks its estimates
Property Analytics
Contact the owner directly
Get the owner's phone numbers and email
Open Analytics
Lease Details
2
Residential units
Multi-tenant
Tenancy
Yes
Utilities to site
Location Intelligence
Trade Area within ½ mile
762
Businesses Nearby
Explore this area
Business Placement
Demographics for 02904, RI
31,542
Population
14,483
Households
2.2
Avg Household Size
41
Median Age
32%
College-Educated
88%
High-School Grad
5.2 sq mi
ZIP Area
6,066
Density / Sq Mi
$64,637
Median Household Income
$47,040
Median Earnings
$1,217
Median Rent
$302,200
Median Home Value
Check the figures for this property
Cap Rate, Value Estimation, Potential NOI and more
View Realmo Analytics
Market
Vacancy Rate% for Multifamily in Northeast region







Frequently Asked Questions
What type of property is this?
Duplex - Well-maintained two-family home with two vacant units at closing, gas stoves, and town water and sewer.
Where is this duplex located?
The property is located at 55 Lexington Ave North Providence, RI.
What is the asking price?
The asking price for this property is $469,999.
What are key features of this property?
This property features: Two‑family home with both units vacant at closing for owner occupancy or rental income; Year built 1900; each unit features an eat‑in kitchen with gas stove; First‑floor living room has hardwood flooring and built‑in A/C; second built‑in A/C in the bedroom



