Three-Story Office
For Sale
Contact for pricing
55 Ionia Ave NW, Grand Rapids, MI 49503
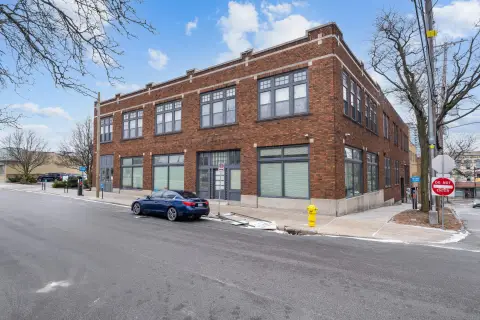
Modern office condominium with open work areas, private offices, conference rooms, and a prominent corner entrance.
Property Size25,782 SF
Price / SF$120.24
Days on Market171
Property Features for 55 Ionia Ave NW
General Information
Standard status
Active
Size
25,782 SF
Property subtype
Office
Zoning
CC
Investment Type
Owner/User
Additional Details
Office Units
1
Building Details
Year Renovated
2015
Buildings
1
Stories
3
Listing Agency:
NAI Wisinski of West Michigan - Grand Rapids
Listed By:
Douglas Taatjes · License #MI 6502343179
(616) 292-1828
Source:
Crexi
Added: Apr 30
Changed: Oct 12
Last Checked: Oct 16 at 8:20AM
Displayed information is deemed reliable but is not guaranteed and should be independently verified. All listing content including descriptions, pricing, images are the copyrighted material of NAI Wisinski of West Michigan - Grand Rapids

Ask AI about this property
Review the available facts, identify missing information and prepare questions for the agent.
Investment Insights
Based on property information with market context.
This 25,782 SF office condominium spans three stories and includes a ground-floor entrance with two-story arched windows. The upper levels feature a contemporary office buildout with an entry lounge, gathering area, open office, private offices, and conference rooms. A lower-level bank vault may also be included, offering additional space for training, lounge, break-area, or meeting use.
The property occupies the corner of Monroe Center and Ionia Avenue in Downtown Grand Rapids, within the Monroe Center retail corridor. Surrounding uses include restaurants, hotels, Class A office buildings, retailers, Rosa Parks Circle, and the Grand Rapids Art Museum. The property was redeveloped in 2015 and carries CC zoning.
The property occupies the corner of Monroe Center and Ionia Avenue in Downtown Grand Rapids, within the Monroe Center retail corridor. Surrounding uses include restaurants, hotels, Class A office buildings, retailers, Rosa Parks Circle, and the Grand Rapids Art Museum. The property was redeveloped in 2015 and carries CC zoning.
Key Highlights
- 25,782 SF office condominium across three stories
- Corner position at Monroe Center and Ionia Avenue in Downtown Grand Rapids
- Two‑story arched windows accompany the main‑floor entrance
Financial Insights
Estimated NOI and Cap Rate
NOI / Yr
$240,971
Cap Rate
7.77%
Suggested Prices Based on Cap Rates
Cap Rate 5%
$4,819,420
$4.8M
Cap Rate 7%
$3,442,443
$3.4M
Cap Rate 9%
$2,677,456
$2.7M
Market Conditions
NOI Build-Up for 25,782 SF
Gross rent
$414.6K $16.08/SF
− Vacancy
−$93.3K −$3.62/SF
EGI
$321.3K $12.46/SF
− OpEx
−$80.3K −$3.12/SF
NOI
$241.0K $9.35/SF
Area
Grand Rapids, MI
Vacancy
22.50%
Lease Rate
$16.08 /SF/Yr
Expense Ratio
25.00%
Simulate Cap Rate and NOI
Suggested Prices Based on Cap Rates
Cap Rate 5%
$4,819,420
Cap Rate 7%
$3,442,443
Cap Rate 9%
$2,677,456
Alternative Uses
Best Use
Office B
$3.44M
$3.01M – $4.02M
NOI $240,971 @ 7.0% cap · market cap 7.77%
Second Best
—
—
no second resolved use
Theoretical Best
Specialty Retail
$5.98M
$5.24M – $6.98M
NOI $418,829 @ 7.0% cap · market cap 13.51%
Zoning and permitted uses should be independently verified with authorities.
How Realmo checks its estimates
Property Analytics
Unlock full access to Insights
Subscribe to Realmo Intelligence
Open Analytics
Current Use
Lease Details
1
Office units
Location Intelligence
Trade Area within ½ mile
7,314
Businesses Nearby
Explore this area
Business Placement
Demographics for 49503, MI
39,344
Population
19,017
Households
2.1
Avg Household Size
30
Median Age
44%
College-Educated
88%
High-School Grad
7.3 sq mi
ZIP Area
5,390
Density / Sq Mi
$61,734
Median Household Income
$36,694
Median Earnings
$1,207
Median Rent
$224,100
Median Home Value
Check the figures for this property
Cap Rate, Value Estimation, Potential NOI and more
View Realmo Analytics
Market
Vacancy Rate% for Office in Midwest region






Frequently Asked Questions
What type of property is this?
Office units - Modern office condominium with open work areas, private offices, conference rooms, and a prominent corner entrance.
Where is this office units located?
The property is located at 55 Ionia Ave NW Grand Rapids, MI.
What is the asking price?
The asking price for this property is $3,100,000.
What are key features of this property?
This property features: 25,782 SF office condominium across three stories; Corner position at Monroe Center and Ionia Avenue in Downtown Grand Rapids; Two‑story arched windows accompany the main‑floor entrance


