Flexible Mixed-Use
For Sale
$699,000
546 Carpenter Ln, Philadelphia, PA 19119
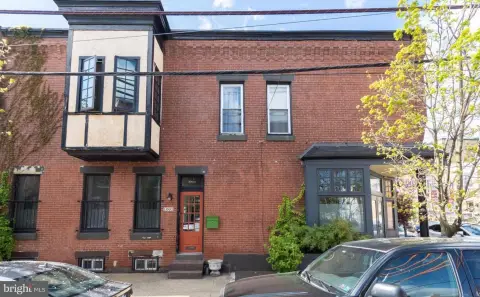
Separately deeded commercial parcel with open interior space, CMX-2 zoning, basement access, and rooftop ventilation equipment.
Property Size1,900 SF
Lot Size0.04 Acres
Price / SF$367.89
Days on Market49
Property Features for 546 Carpenter Ln
General Information
Standard status
Active
Size
1,900 SF
Lot size
0.04 Acres
Zoning
CMX-2
Amenities
half bathroom
basement access
sidewalk steel cellar entrance
loading zone
rooftop industrial ventilation equipment
Building Details
Year Built
1925
Buildings
1
Listing Agency:
BHHS Fox & Roach The Harper at Rittenhouse Square
Listed By:
Marc A. Hammarberg · License #AB067991
(215) 790-5501
Source:
Bethsamberg
Added: Aug 30
Changed: Oct 4
Last Checked: Oct 7 at 1:56PM
Displayed information is deemed reliable but is not guaranteed and should be independently verified. All listing content including descriptions, pricing, images are the copyrighted material of BHHS Fox & Roach The Harper at Rittenhouse Square

Ask AI about this property
Review the available facts, identify missing information and prepare questions for the agent.
Investment Insights
Based on property information with market context.
546 Carpenter Lane is a separately deeded mixed-use parcel encompassing approximately 1,900 square feet. The building offers an open interior layout with approximately 11-foot ceilings, one half bathroom, basement access, and a dedicated sidewalk steel cellar entrance. Rooftop industrial ventilation equipment remains in place, and a newly installed torch-down modified bitumen roof is among the recent improvements.
The property is zoned CMX-2 Mixed Use and is positioned within a neighborhood commercial setting across from Weavers Way Co-op, with access to the Germantown Avenue retail and dining corridor. Approximately 22.5 feet of designated loading zone fronts the property. Although connected to 548 Carpenter Lane through interior openings and shared basement, rear yard, and roof structures, 546 Carpenter Lane is offered as its own parcel. Future commercial, mixed-use, or redevelopment applications are subject to applicable approvals.
The property is zoned CMX-2 Mixed Use and is positioned within a neighborhood commercial setting across from Weavers Way Co-op, with access to the Germantown Avenue retail and dining corridor. Approximately 22.5 feet of designated loading zone fronts the property. Although connected to 548 Carpenter Lane through interior openings and shared basement, rear yard, and roof structures, 546 Carpenter Lane is offered as its own parcel. Future commercial, mixed-use, or redevelopment applications are subject to applicable approvals.
Key Highlights
- Approximately 1,900 square feet on a separately deeded parcel
- CMX‑2 Mixed Use zoning
- Open floor plan with approximately 11‑foot ceilings
Financial Insights
Estimated NOI and Cap Rate
NOI / Yr
$22,572
Cap Rate
3.23%
Suggested Prices Based on Cap Rates
Cap Rate 5%
$451,440
$451.4K
Cap Rate 7%
$322,457
$322.5K
Cap Rate 9%
$250,800
$250.8K
Market Conditions
NOI Build-Up for 1,900 SF
Gross rent
$41.0K $21.60/SF
− Vacancy
−$4.9K −$2.59/SF
EGI
$36.1K $19.01/SF
− OpEx
−$13.5K −$7.13/SF
NOI
$22.6K $11.88/SF
Area
Philadelphia, PA
Vacancy
12.00%
Lease Rate
$21.60 /SF/Yr
Expense Ratio
37.50%
Simulate Cap Rate and NOI
Suggested Prices Based on Cap Rates
Cap Rate 5%
$451,440
Cap Rate 7%
$322,457
Cap Rate 9%
$250,800
Alternative Uses
Best Use
Mixed Use
$322.5K
$282.2K – $376.2K
NOI $22,572 @ 7.0% cap · market cap 3.23%
Second Best
Retail
$306.8K
$268.4K – $357.9K
NOI $21,474 @ 7.0% cap · market cap 3.07%
Theoretical Best
Multifamily LT 5
$463.2K
$405.3K – $540.4K
NOI $32,423 @ 7.0% cap · market cap 4.64%
Zoning and permitted uses should be independently verified with authorities.
How Realmo checks its estimates
Property Analytics
Unlock full access to Insights
Subscribe to Realmo Intelligence
Open Analytics
Current Use
Location Intelligence
Trade Area within ½ mile
707
Businesses Nearby
9k
Monthly Visits Nearby
Explore this area
Business Placement
Foot Traffic Nearby
Shops & Services 100%
Family Dollar
Shops & Services
8,550 visits/mo
0.4 miles
Demographics for 19119, PA
27,265
Population
13,909
Households
2
Avg Household Size
44
Median Age
55%
College-Educated
96%
High-School Grad
3.4 sq mi
ZIP Area
8,019
Density / Sq Mi
$81,609
Median Household Income
$54,598
Median Earnings
$1,291
Median Rent
$326,600
Median Home Value
Check the figures for this property
Cap Rate, Value Estimation, Potential NOI and more
View Realmo Analytics
Market
Vacancy Rate% for Retail in Philadelphia, PA





Frequently Asked Questions
What type of property is this?
Mixed-use property - Separately deeded commercial parcel with open interior space, CMX-2 zoning, basement access, and rooftop ventilation equipment.
Where is this mixed-use property located?
The property is located at 546 Carpenter Ln Philadelphia, PA.
What is the asking price?
The asking price for this property is $699,000.
What are key features of this property?
This property features: Approximately 1,900 square feet on a separately deeded parcel; CMX‑2 Mixed Use zoning; Open floor plan with approximately 11‑foot ceilings