Turnkey New Construction
5405 Park Lawn Drive Chubbuck, ID 83202
For Sale
$709,900
MULTI_FAMILY - Chubbuck, ID
Property Size4,400 SF
Lot Size0.15 Acres
Price / SF$161.34
Days on Market49
Property Features for 5405 Park Lawn Drive
General Information
Property type
Residential Multi Family
Property subtype
Other
Property condition
Under Construction
Bedrooms
12
Bathrooms
4
Rooms
Bedroom 6, Bedroom 7, Bedroom 8, Bedroom 9, Bedroom 11, Bedroom 10, Bathroom 3, Bathroom 4, Bedroom 3, Bedroom 2, Bathroom 1, Bathroom 2, Bedroom 4, Bedroom 1, Bedroom 5, Bedroom 12
Parking features
Off Street
Basement
Crawl Space
Appliances
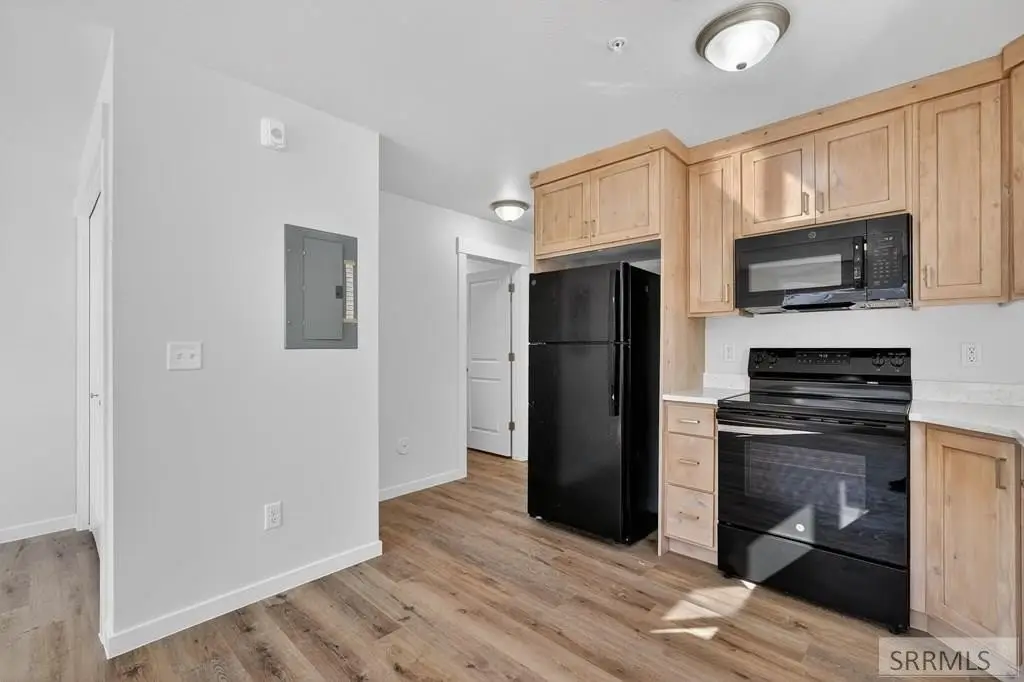
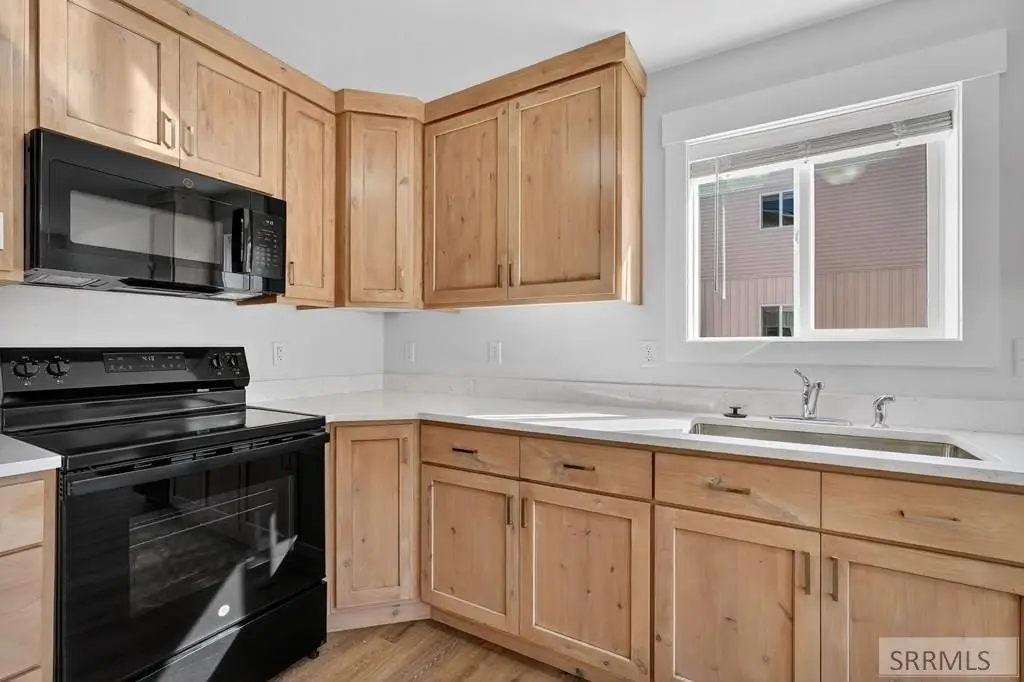
Separate Water Heaters, Dishwasher, Microwave, Refrigerator, Oven, Stove
Standard status
Active
APN
RPRCLP2000600
Size
4,400 SF
Lot size
0.15 Acres
Taxes and HOA fees
Tax Year
2025
Tax Description
LOT 6 BLOCK 1 LEGACY PARK DIVISION 2
Tax Annual Amount
0
Utilities
Sewer type
Public Sewer
Heating system
Electric (Heating)
Cooling system
Wall/Window Unit(s), Window Unit(s)
Water source
Public
Building Details
Year built
2026
Number of units
4
Building materials
Stone, Vinyl Siding
Listing Agency:
RE/MAX Country Real Estate
(208) 234-4444
Listed By:
Chris Robinson · License #SP28325
(208) 234-4444
Added: Jun 10
Changed: Jun 30
Last Checked: Jul 28 at 5:06AM
MLS# 2186979
Copyright © 2026 Snake River Regional MLS. All rights reserved. All information provided by the listing agent/broker is deemed reliable but is not guaranteed and should be independently verified.
Investment Insights
Based on property information with market context.
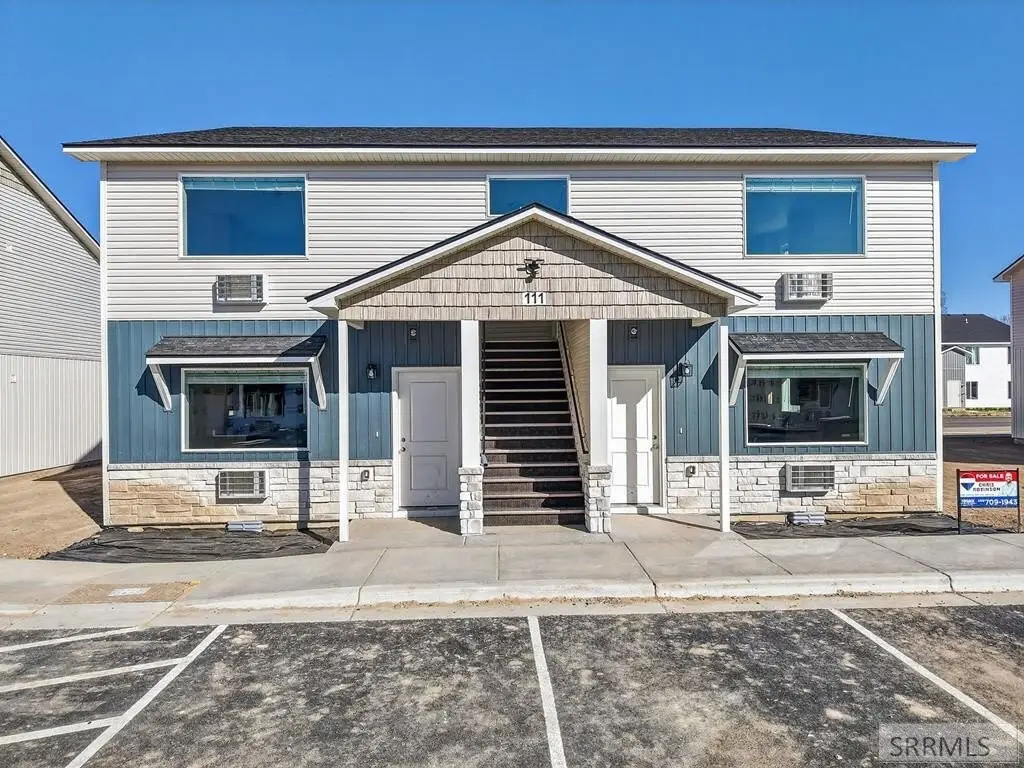
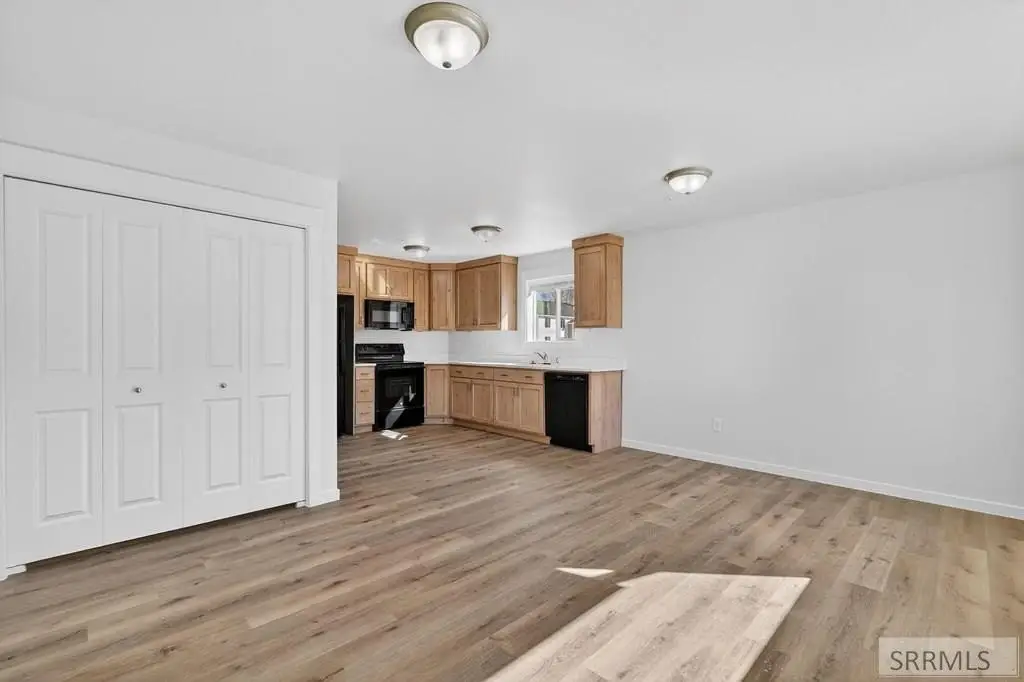
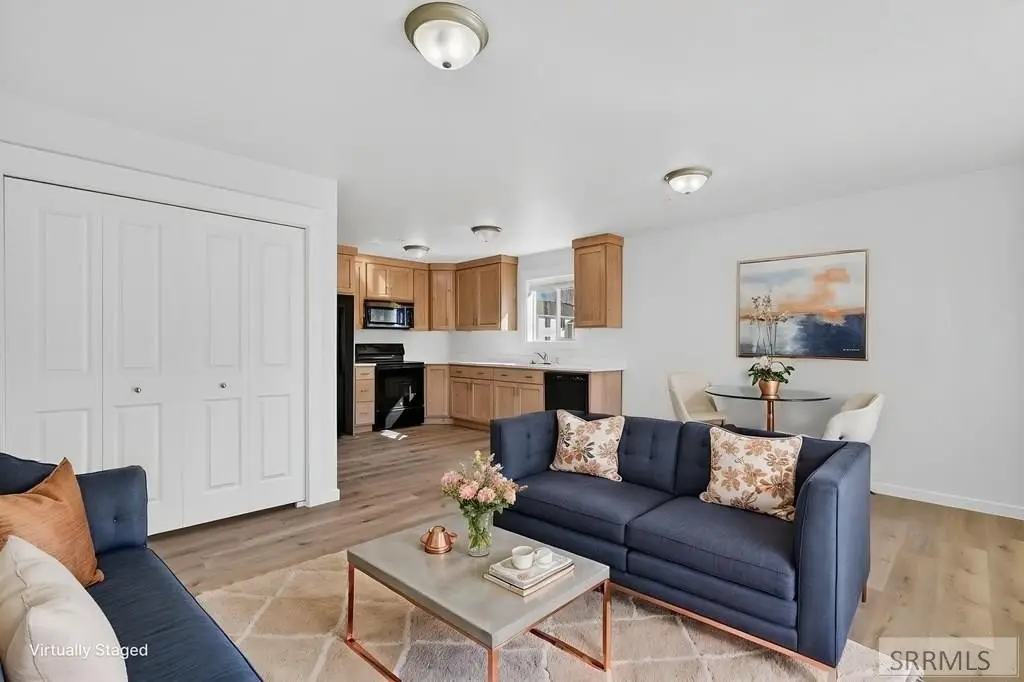
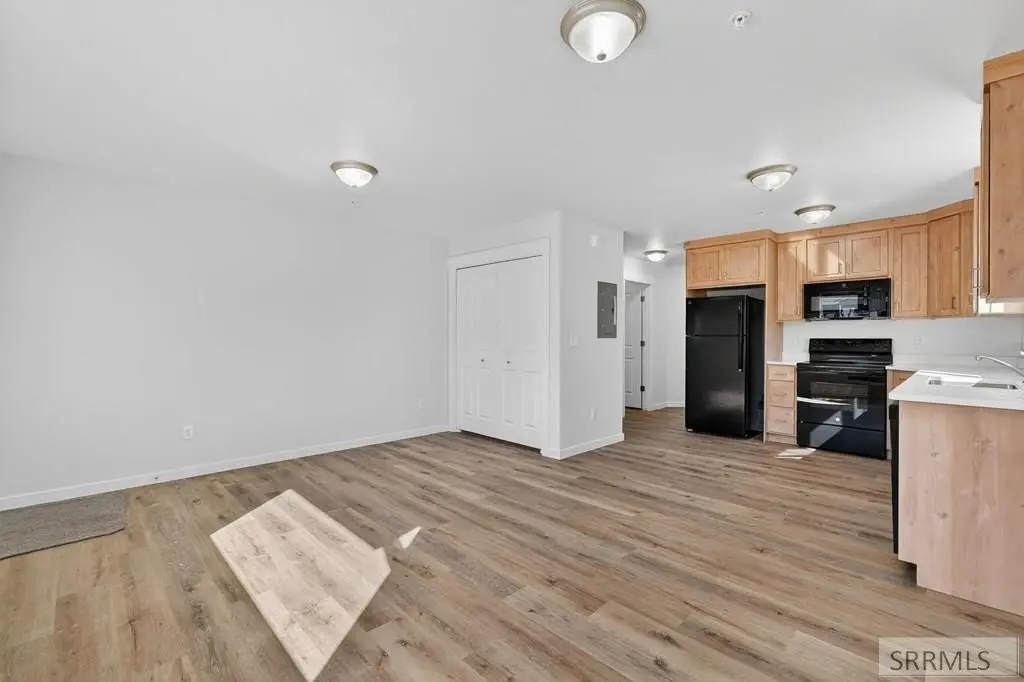
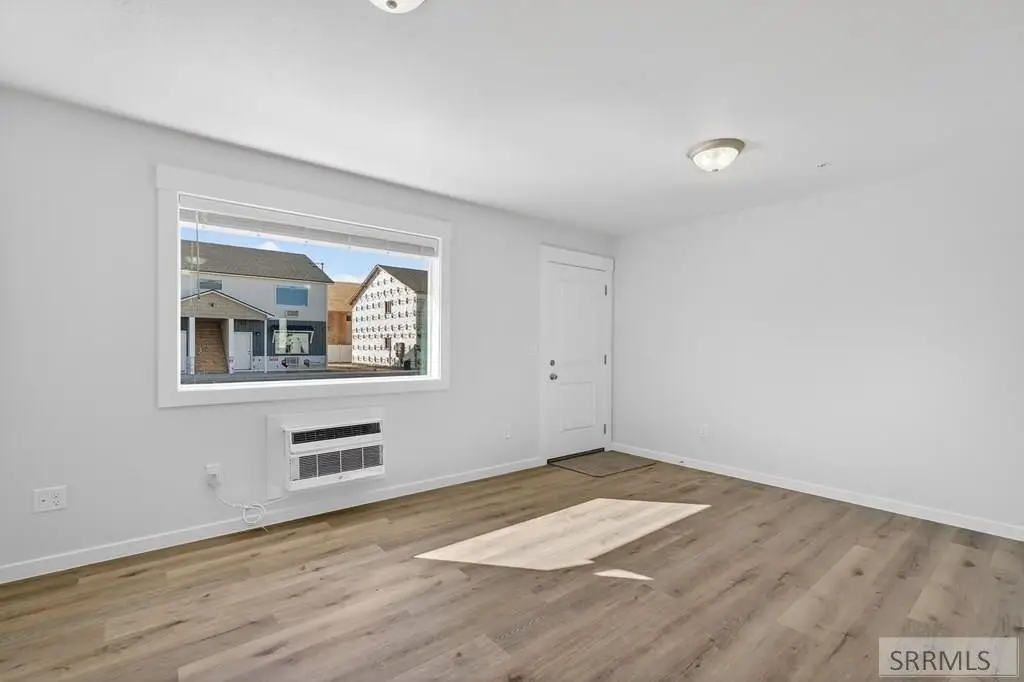
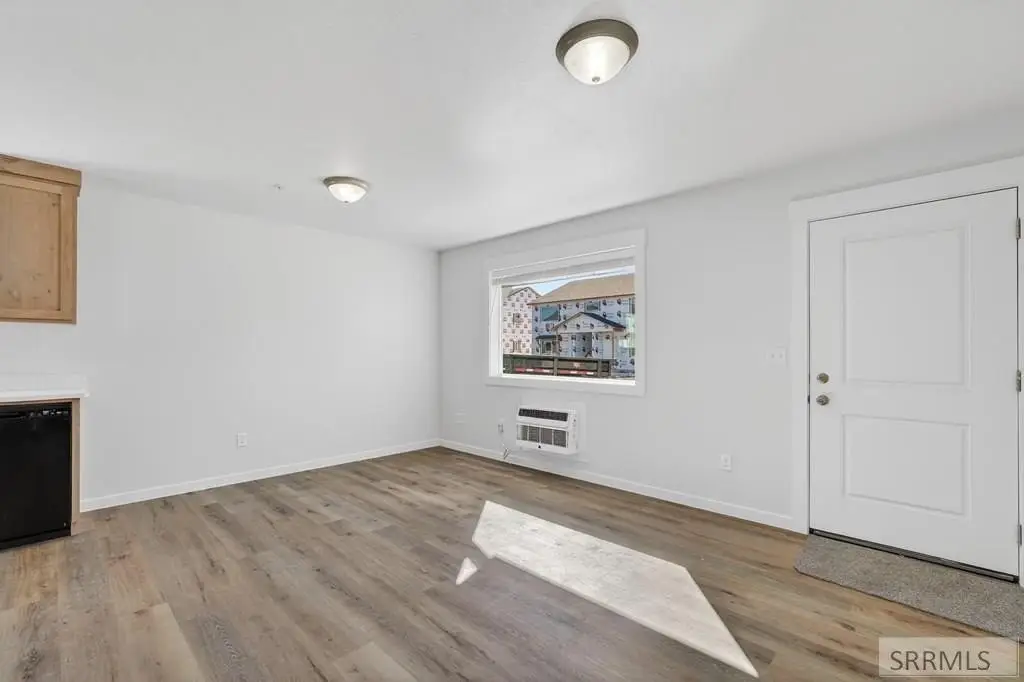
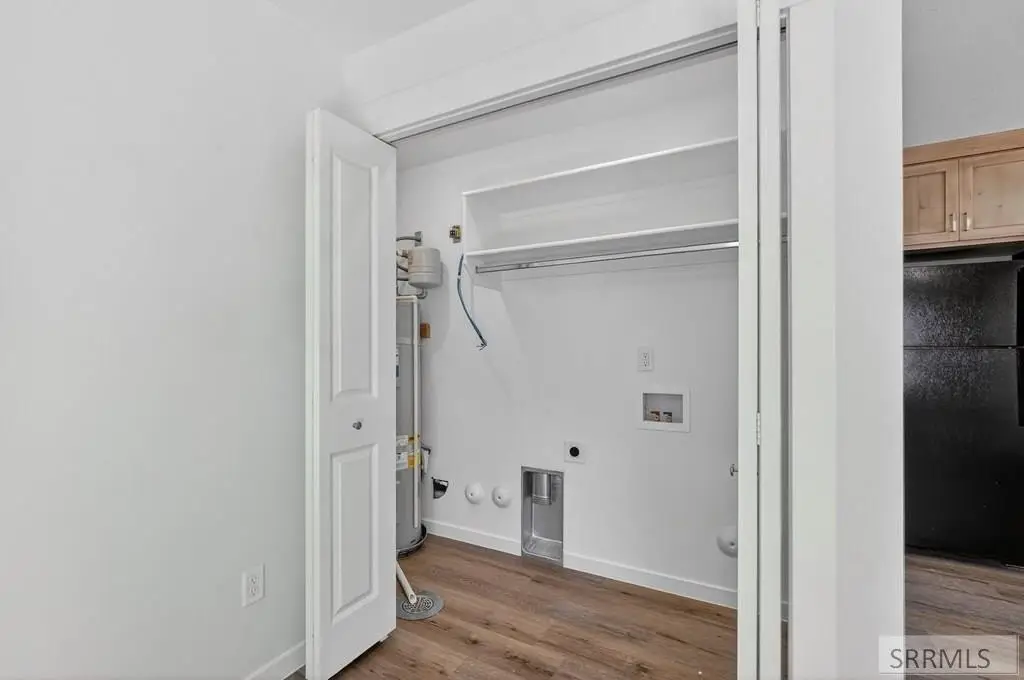
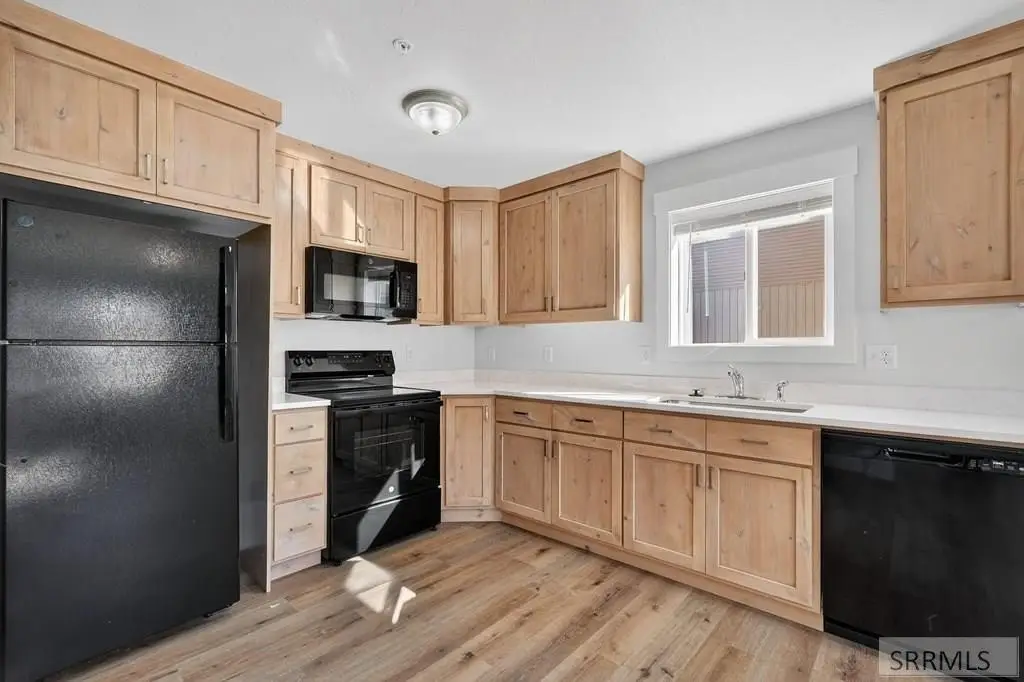
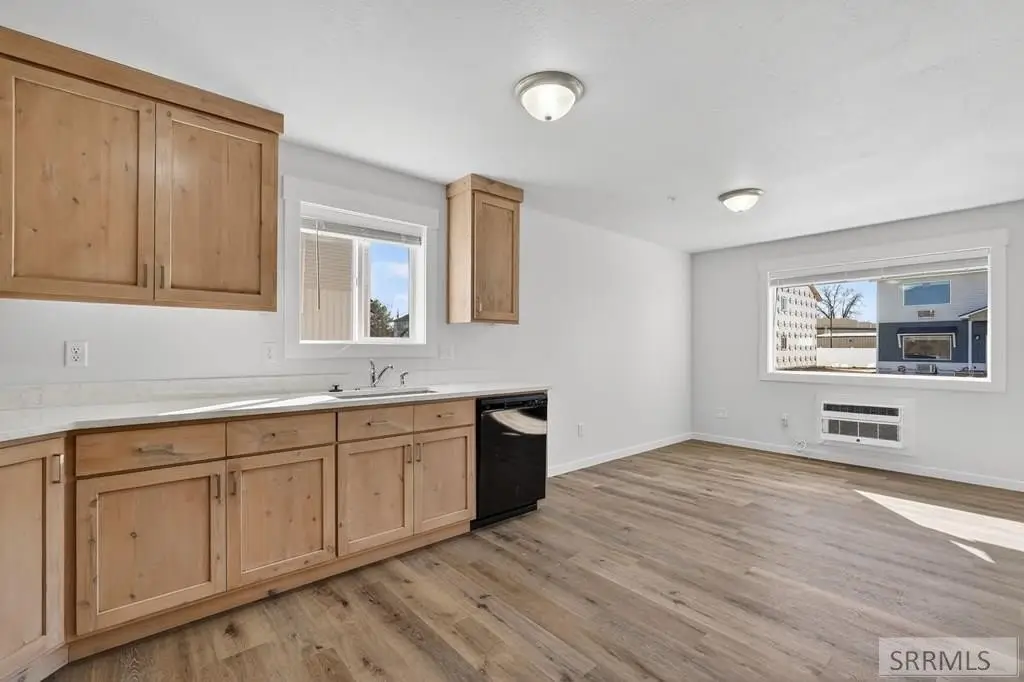
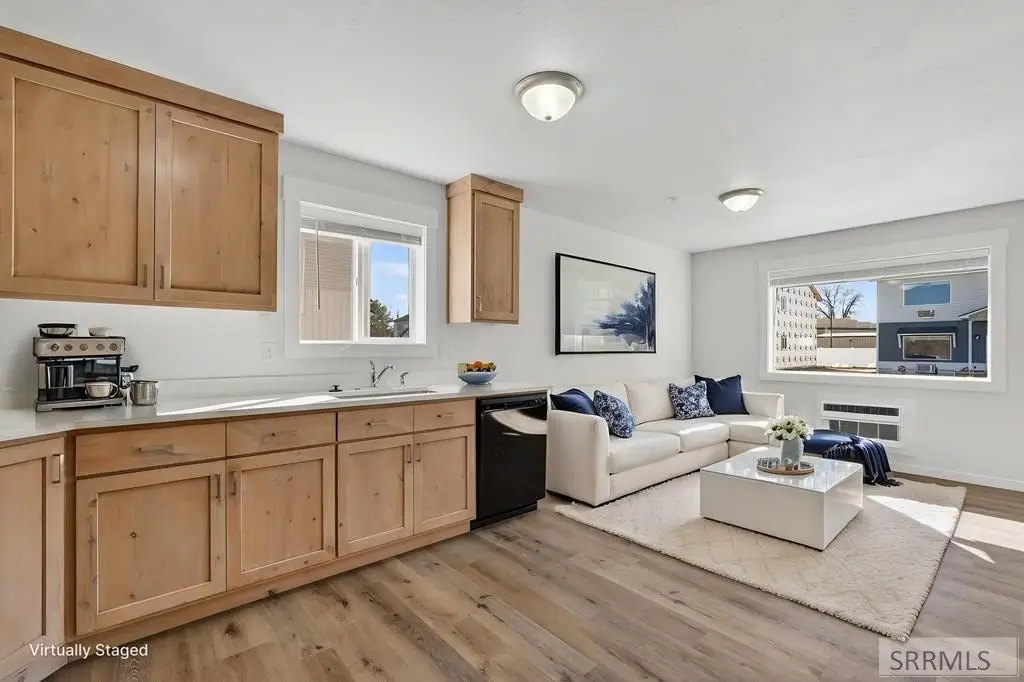
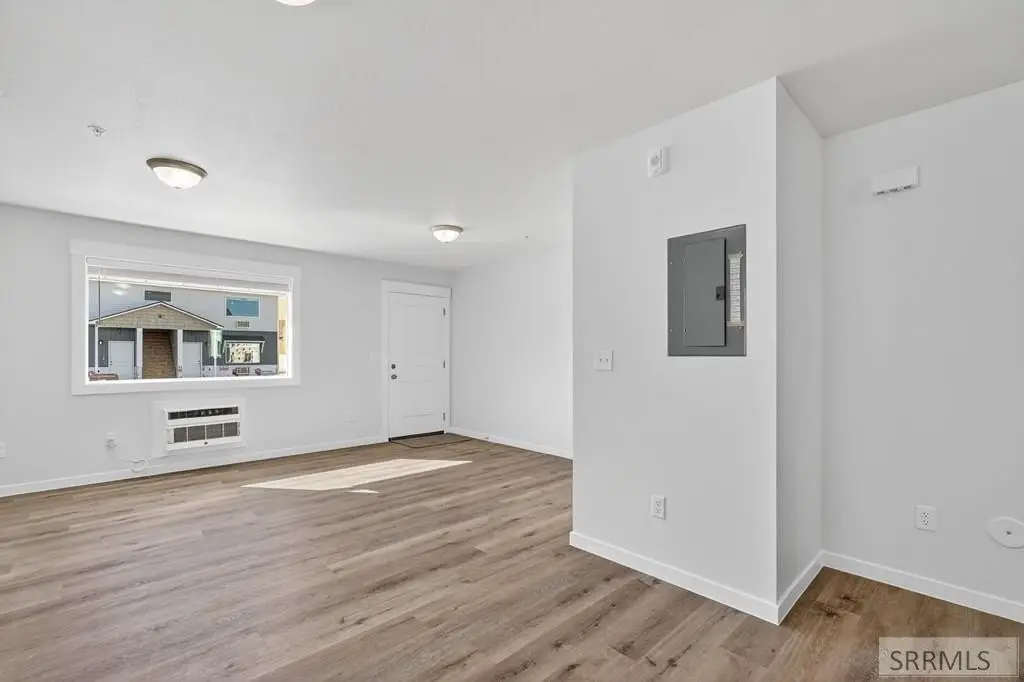
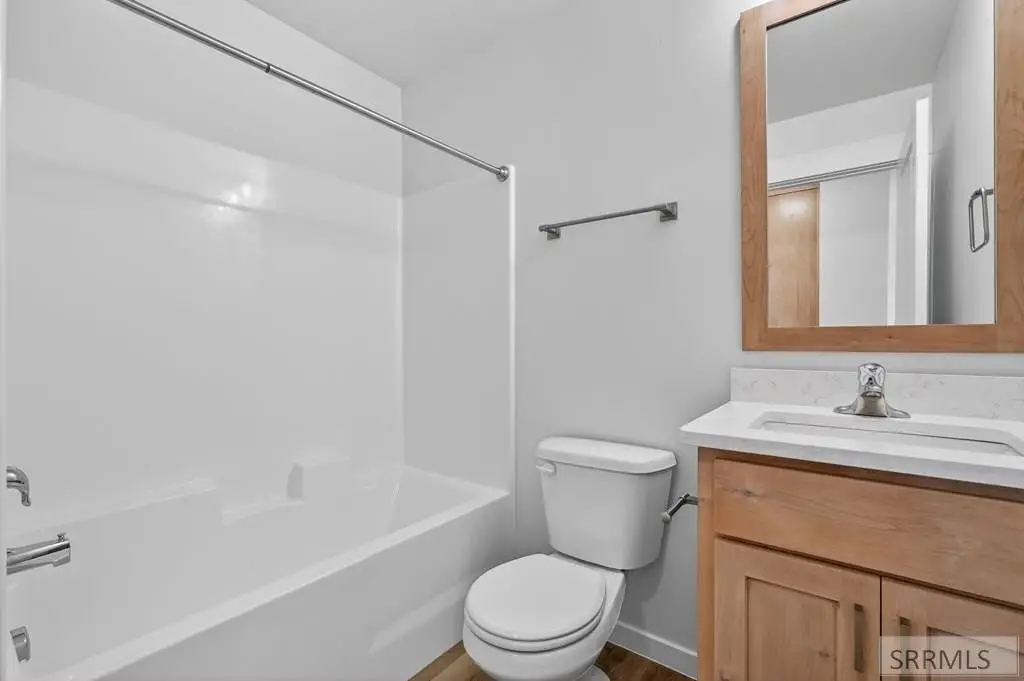
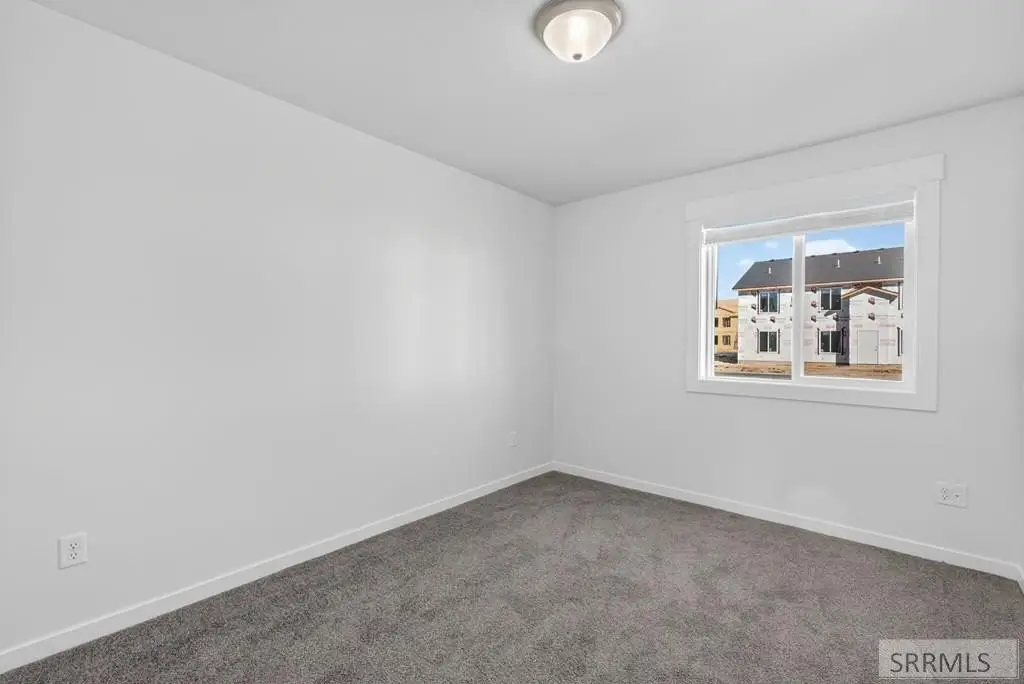
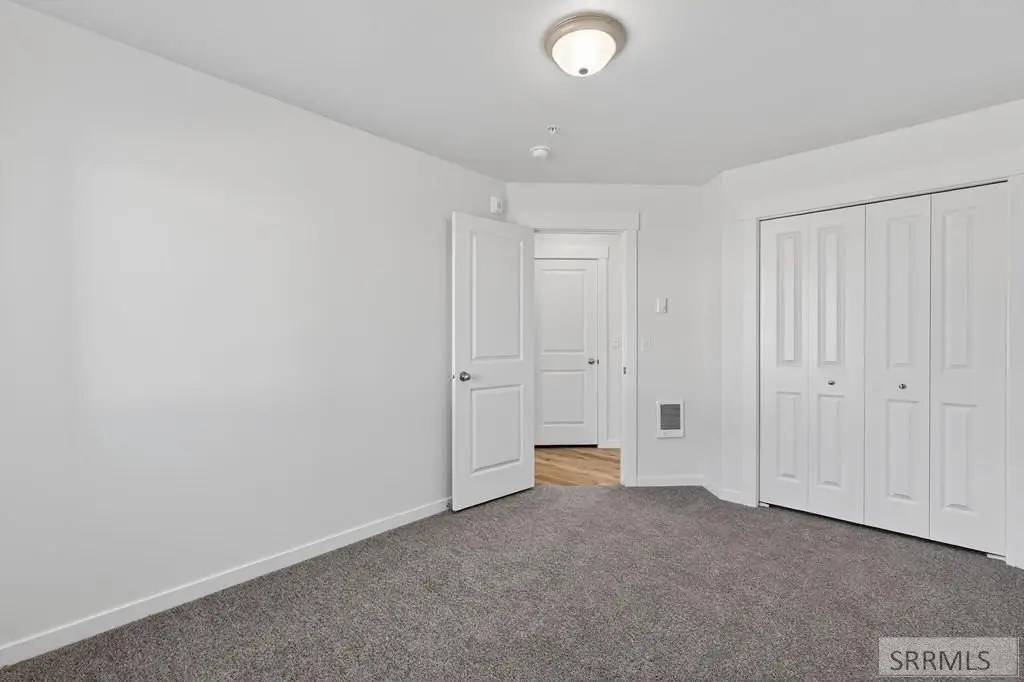
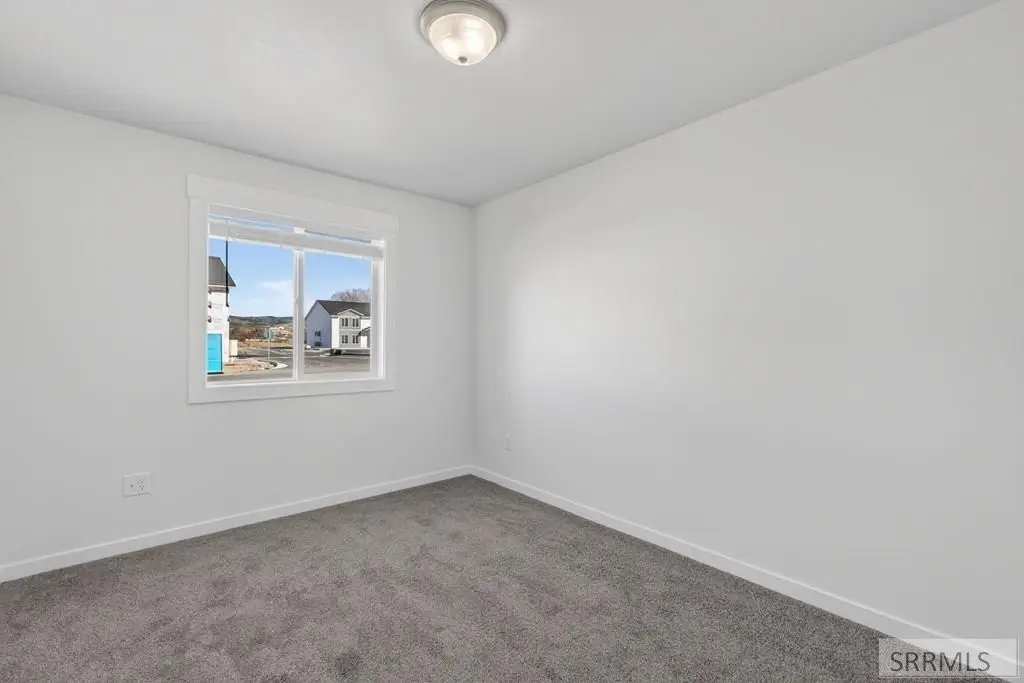
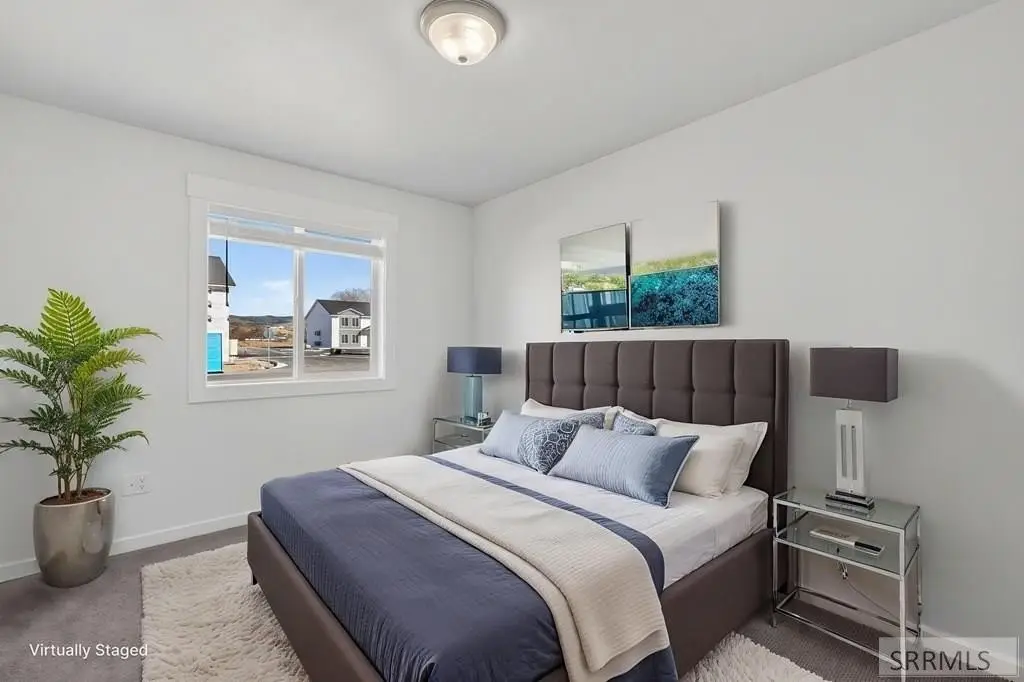
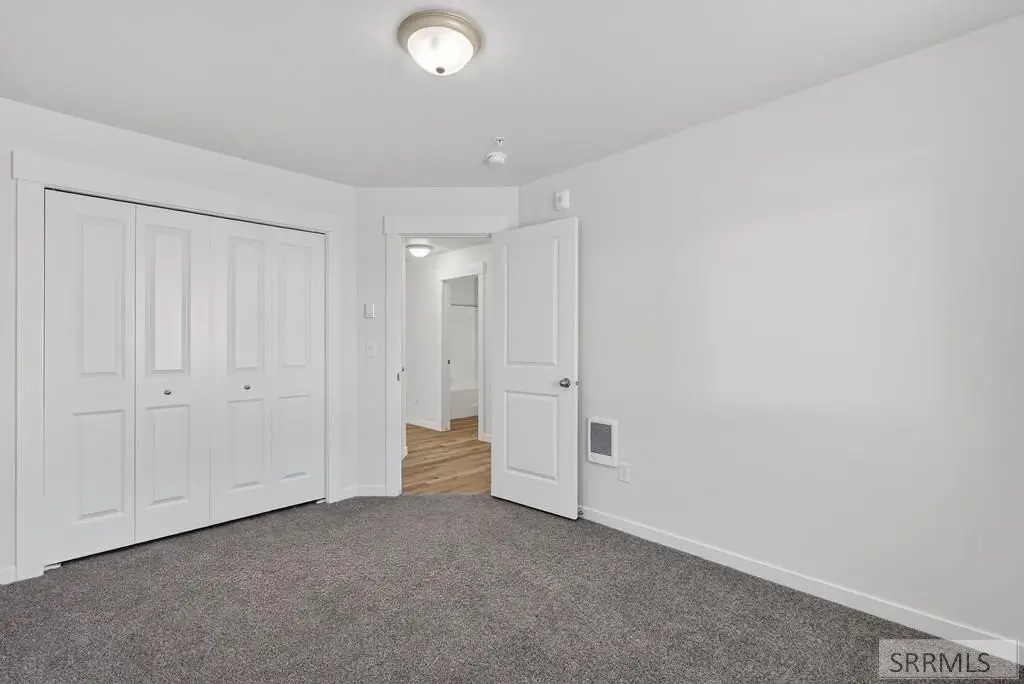
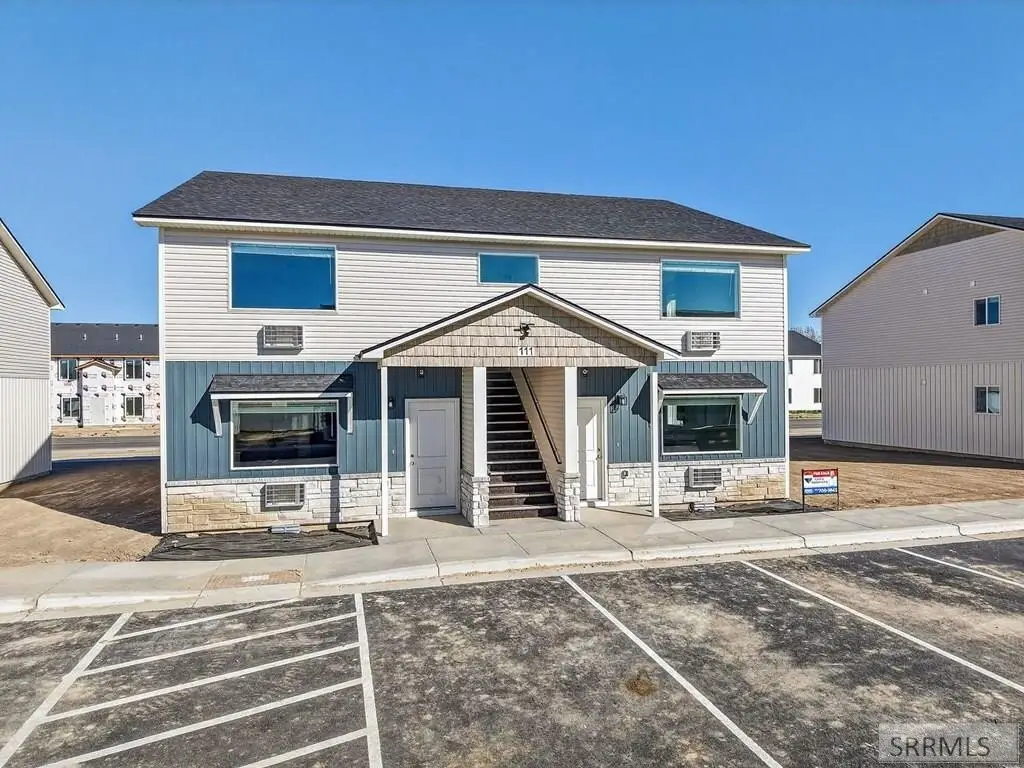
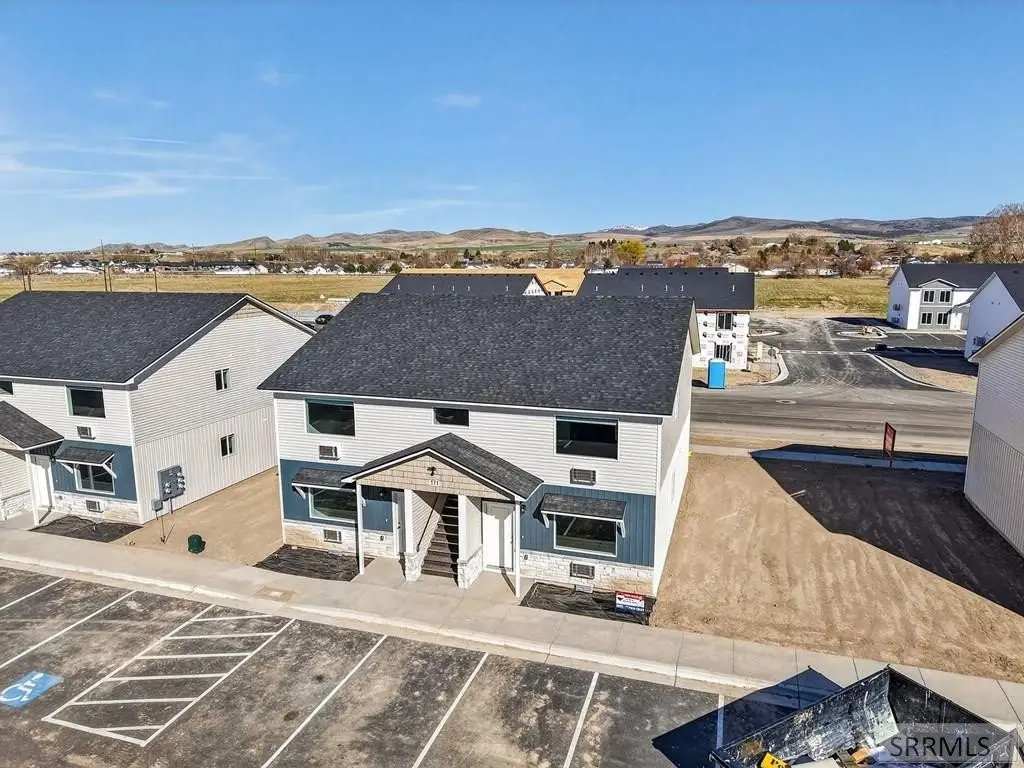
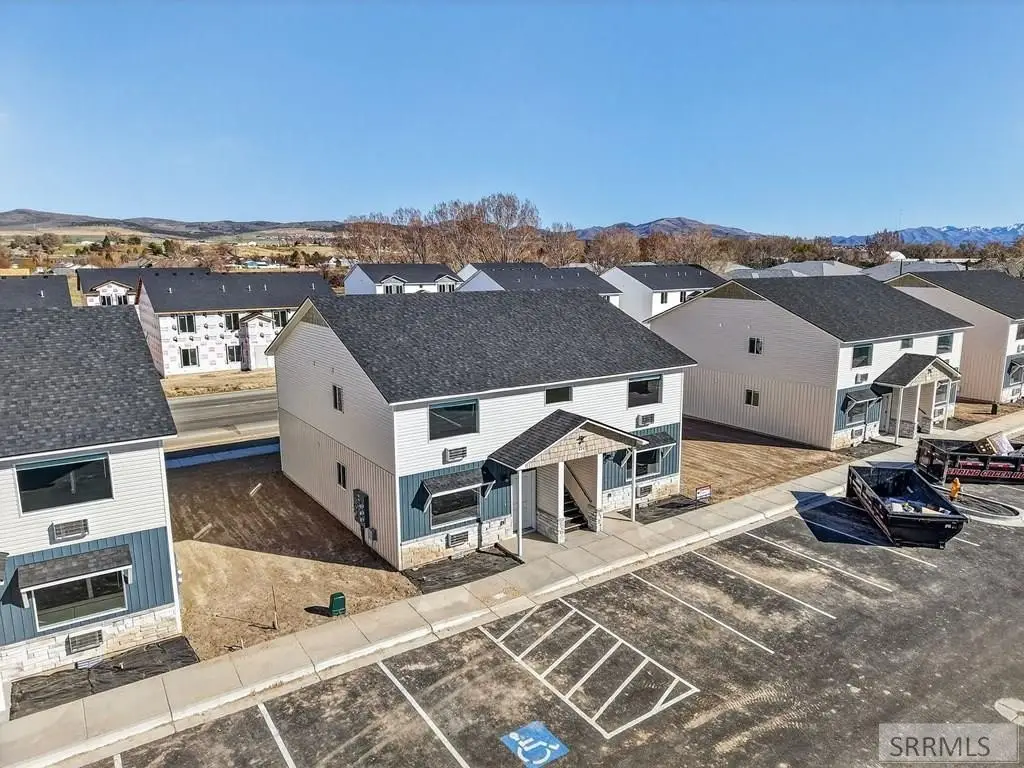
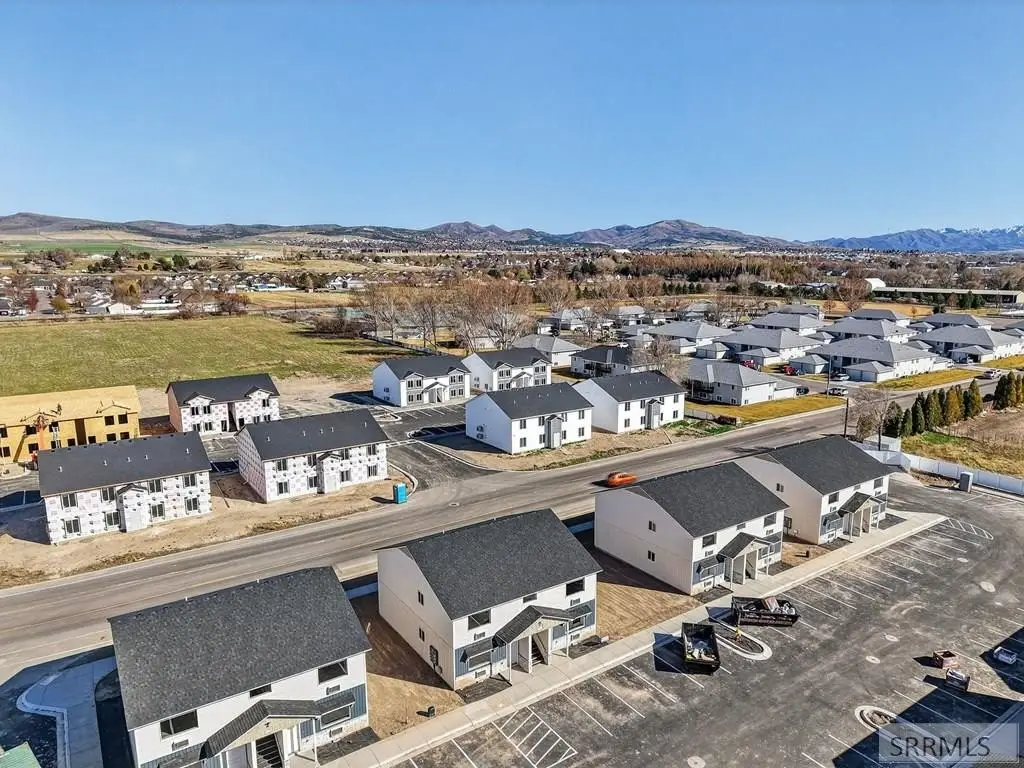
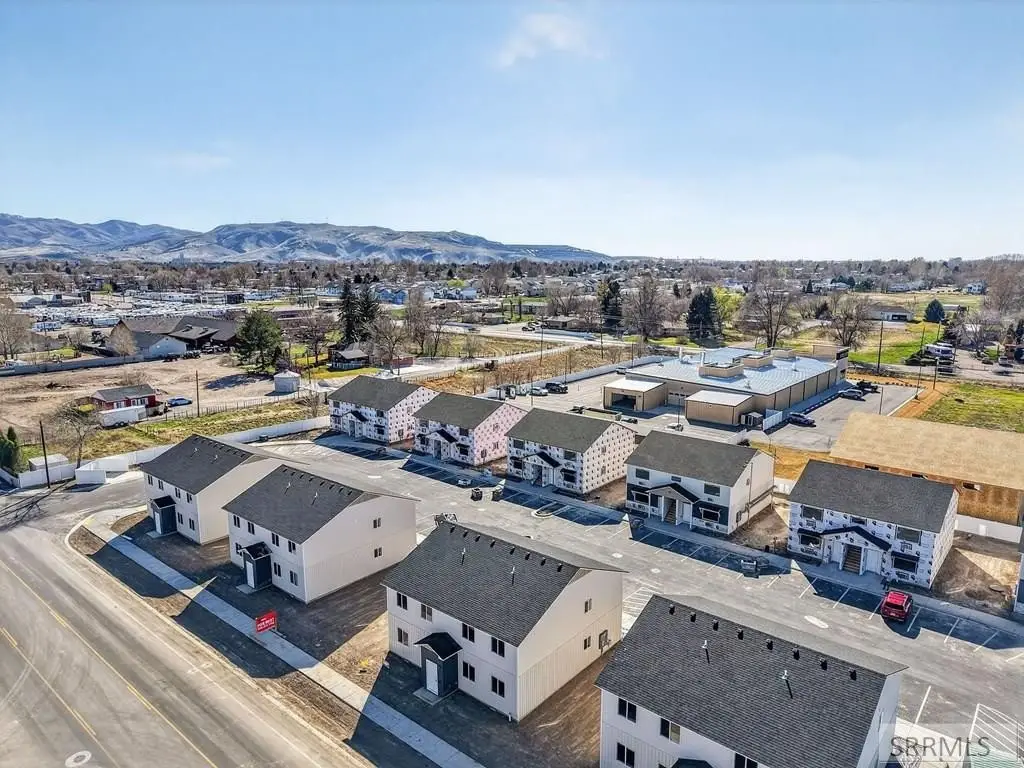
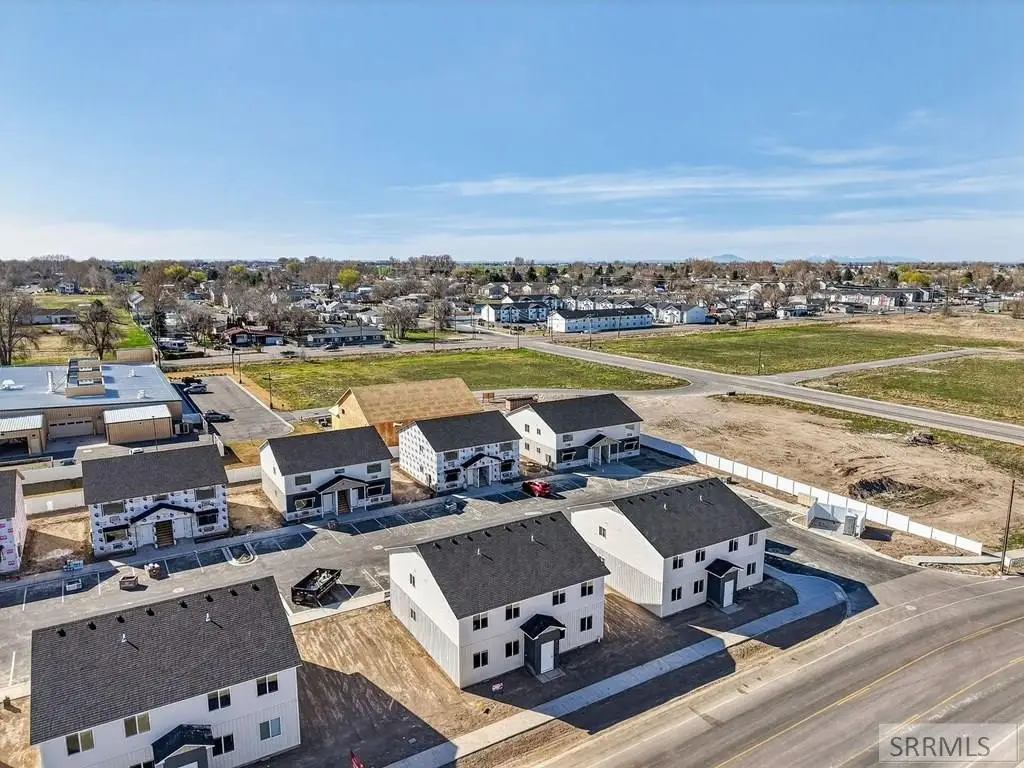
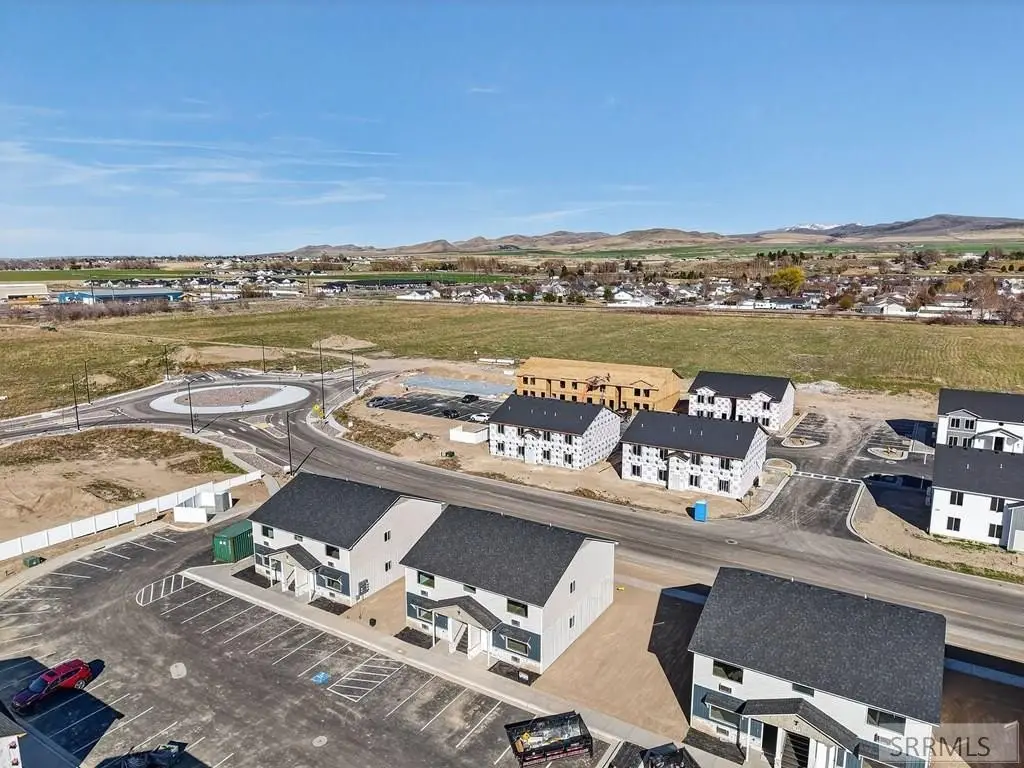
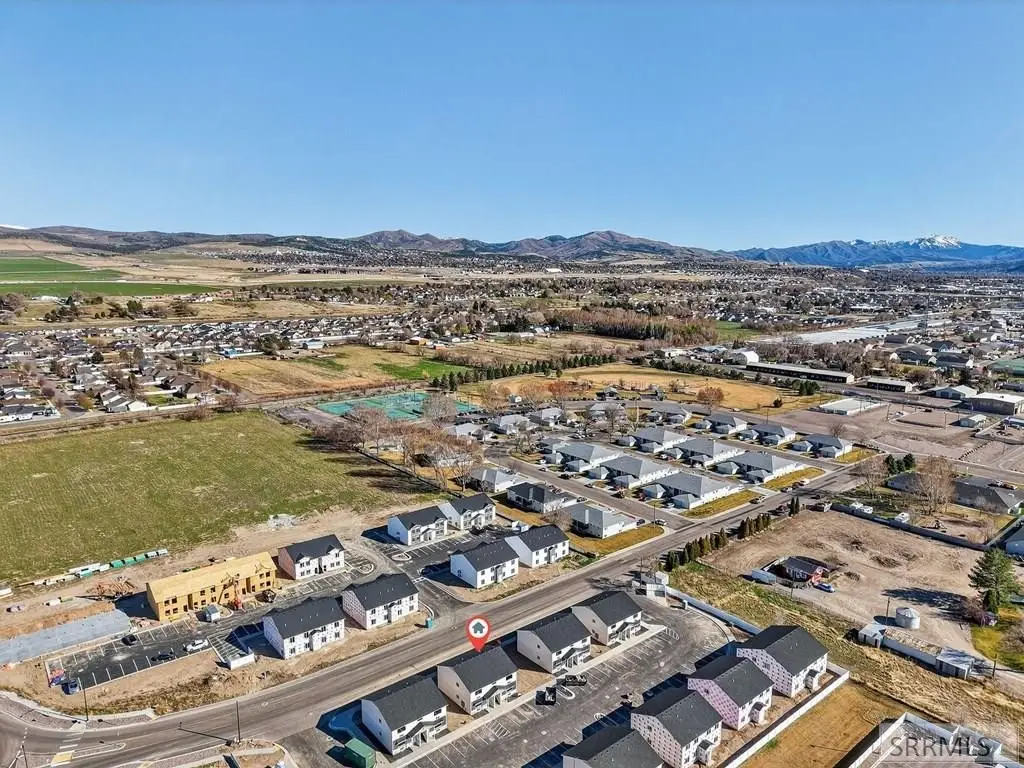
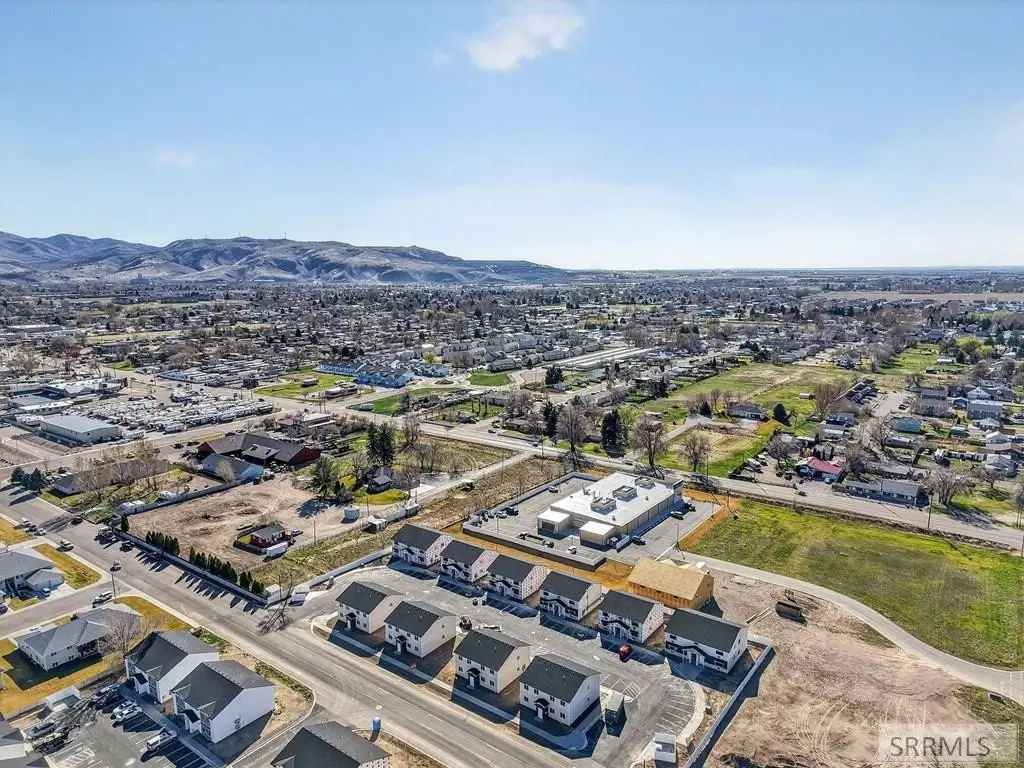
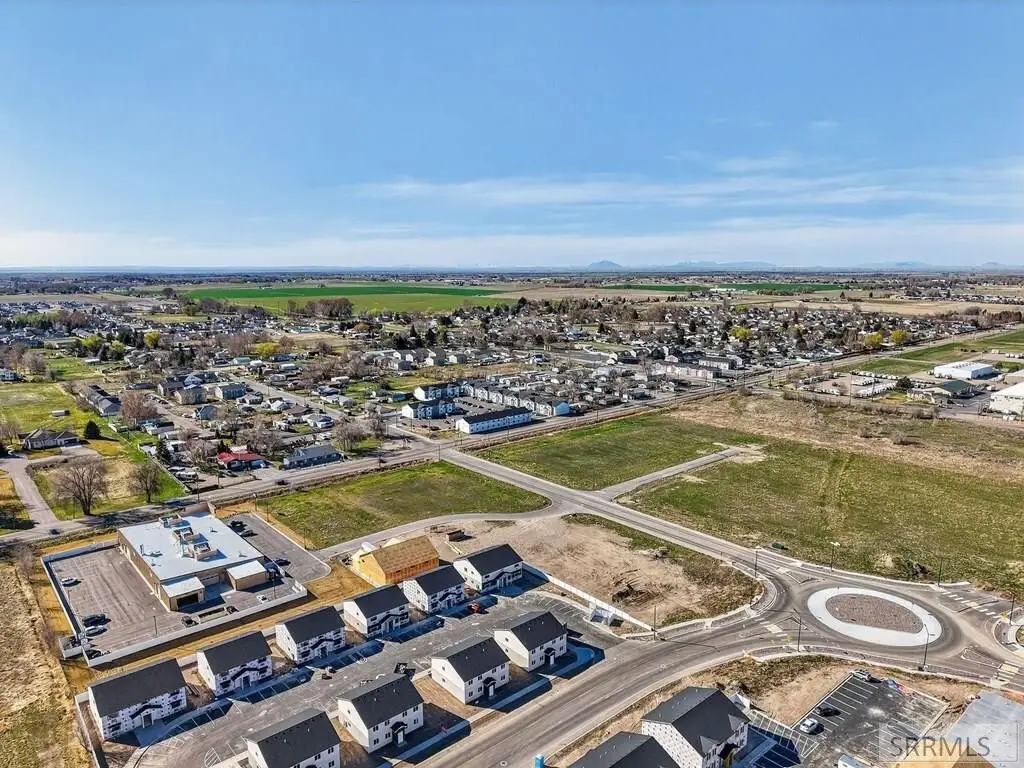
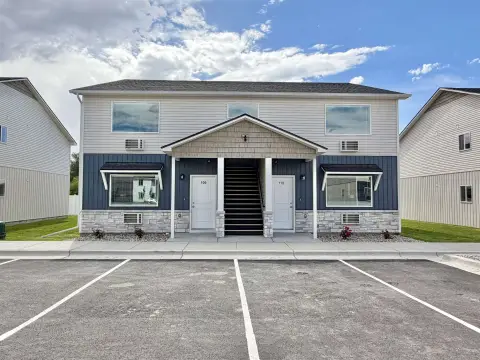
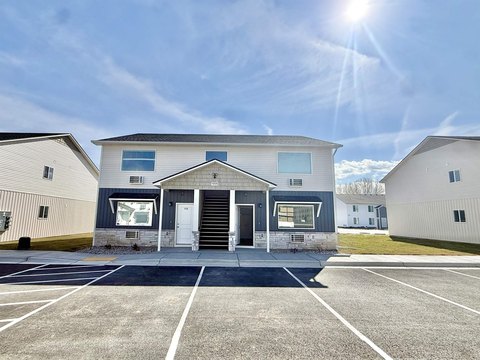
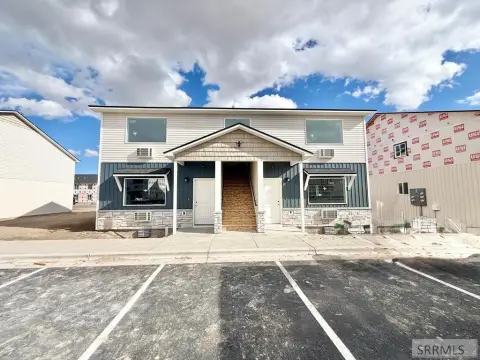
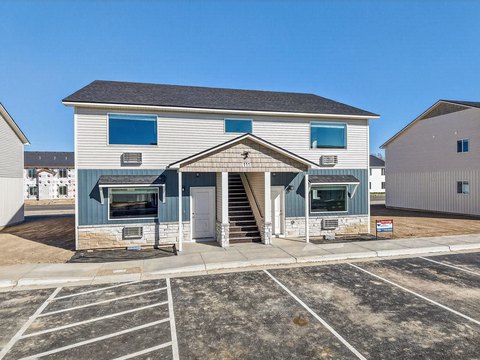
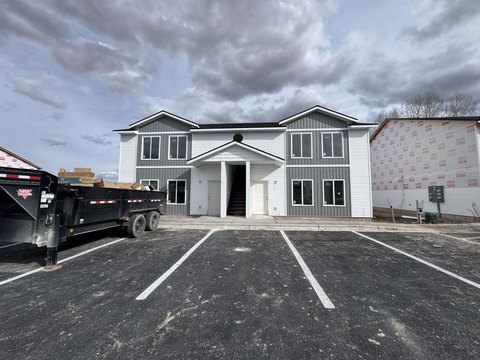
This turnkey newly constructed 4-plex offers four units, each with a 3-bedroom layout. Interiors include granite countertops and LVP flooring, supported by durable vinyl siding exterior construction. Climate control is provided with PTAC heating and air in the living room. A fire suppression system is in place, and appliances are included except for washer and dryer.
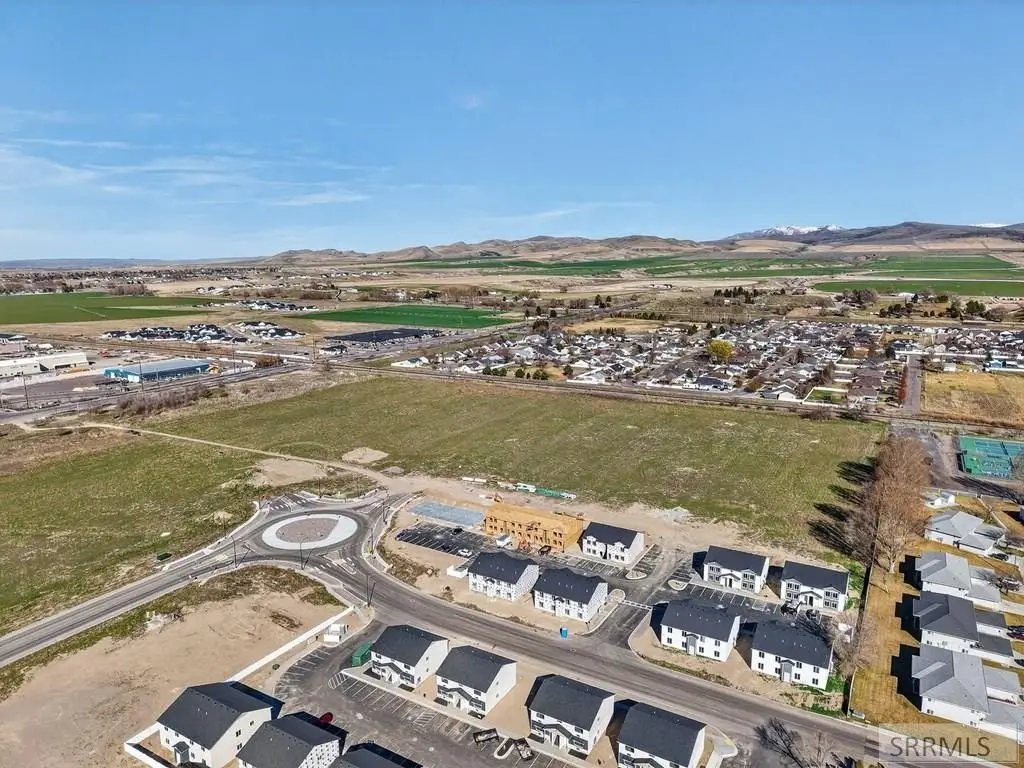
The property is located at 5405 Park Lawn Drive in Chubbuck, Idaho (Bannock County). Professional property management is already in place, supporting an easier transition for an owner looking to maintain day-to-day oversight from the start.
As a residential income property, the building is positioned for tenants seeking updated, low-maintenance living within a newer construction environment. The finished units and included appliances help reduce move-in friction, while the management structure can support continuity after acquisition.
The property is located at 5405 Park Lawn Drive in Chubbuck, Idaho (Bannock County). Professional property management is already in place, supporting an easier transition for an owner looking to maintain day-to-day oversight from the start.
As a residential income property, the building is positioned for tenants seeking updated, low-maintenance living within a newer construction environment. The finished units and included appliances help reduce move-in friction, while the management structure can support continuity after acquisition.
Key Highlights
- Under construction; year built 2026 new‑construction 4‑plex with 4 separate units
- Each unit features a 3‑bedroom layout with appliances included except washer/dryer
- Electric heating and wall/window AC units provided, including PTAC heating and AC in the living room
Financial Insights For Multifamily LT 5
Simulate Cap Rate and NOI
NOI Build-Up
- Vacancy
- income lost from leasable area expected to sit empty during the year — subtracted from gross rent.
- EGI (Effective Gross Income)
- gross rent minus vacancy losses — the realistic income before paying operating costs.
- OpEx (Operating Expenses)
- recurring costs to operate the property (property tax, insurance, utilities, maintenance, management) — excludes financing and capital improvements.
- NOI (Net Operating Income)
- income a property generates after operating costs but before financing and taxes.
| Component | $ | $/SF |
|---|---|---|
| Gross rent | $44.9k | $10.20 |
| − Vacancy | −$2.5k | −$0.56 |
| EGI | $42.4k | $9.64 |
| − OpEx | −$12.7k | −$2.89 |
| NOI | $29.7k | $6.75 |
4,400 SF · lease $10.20/SF/yr · vacancy 5.50% · expense 30.00%
Alternative Uses
Best Use
Multifamily LT 5
$424.1K
$371.1K – $494.8K
NOI $29,688 @ 7.0% cap · market cap 4.18%
Second Best
Apartment 5plus
$394.9K
$345.6K – $460.8K
NOI $27,646 @ 7.0% cap · market cap 3.89%
Theoretical Best
Office A
$729.1K
$638.0K – $850.6K
NOI $51,036 @ 7.0% cap · market cap 7.19%
Zoning and permitted uses should be independently verified with authorities.
Property Analytics
Property Profile
Location Intelligence
Current Use


Frequently Asked Questions
What type of property is this?
Quadplex - Newly built 4-plex with four 3-bedroom units, modern finishes, and in-unit PTAC heating and air.
Where is this quadplex located?
The property is located at 5405 Park Lawn Drive Chubbuck, ID.
What is the asking price?
The asking price for this property is $709,900.
What are key features of this property?
This property features: Under construction; year built 2026 new‑construction 4‑plex with 4 separate units; Each unit features a 3‑bedroom layout with appliances included except washer/dryer; Electric heating and wall/window AC units provided, including PTAC heating and AC in the living room