Updated Dental/Medical Office
For Sale
Contact for pricing
5307 W Devon Ave, Chicago, IL 60646
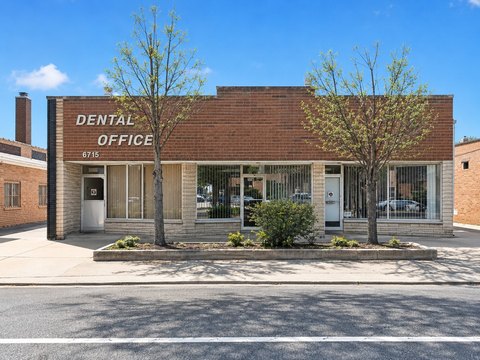
Recently updated office building set up for medical or professional services, with a large reception and multiple exam or office rooms.
Property Size2,100 SF
Price / SF$199.52
Days on Market149
Property Features for 5307 W Devon Ave
General Information
Standard status
Active
Size
2,100 SF
Class
C
Property subtype
Office, Retail
Zoning
B3-1
Investment Type
Owner/User
Additional Details
Highway Access
Yes
Office Units
5
Building Details
Year Built
1958
Stories
1
Tenancy
Single
Listing Agency:
Remax Legends
Listed By:
Edgar R Guerrero · License #IL 874979
Source:
Crexi
Added: May 27
Changed: Oct 1
Last Checked: Oct 20 at 6:31PM
Displayed information is deemed reliable but is not guaranteed and should be independently verified. All listing content including descriptions, pricing, images are the copyrighted material of Remax Legends

Ask AI about this property
Review the available facts, identify missing information and prepare questions for the agent.
Investment Insights
Based on property information with market context.
This recently updated 2,100-square-foot office building was used as a dental office and is well suited for medical, dental, or other professional uses. The interior features a large reception area, space for approximately five offices, and about 4.5 bathrooms. Improvements include LED lighting, a sound surround system, newly painted walls, and a kitchen. Additional space is available in a finished basement.
The property is located in downtown Edgebrook at 5307 W Devon Ave. It has lots of street parking for clients and visitors. The surrounding area includes local businesses, restaurants, the Edgebrook Library, and the Metra strip along Devon/Lehigh, with nearby access to Highway exits for I-90 and the 94 Expressways.
For tenants or owners looking for a move-in ready professional environment, the layout supports patient or client flow with a prominent reception area and multiple private offices. The kitchen and finished basement provide added flexibility for staff use, storage, or additional operating space, while the street parking helps accommodate walk-in and appointment-based traffic.
The property is located in downtown Edgebrook at 5307 W Devon Ave. It has lots of street parking for clients and visitors. The surrounding area includes local businesses, restaurants, the Edgebrook Library, and the Metra strip along Devon/Lehigh, with nearby access to Highway exits for I-90 and the 94 Expressways.
For tenants or owners looking for a move-in ready professional environment, the layout supports patient or client flow with a prominent reception area and multiple private offices. The kitchen and finished basement provide added flexibility for staff use, storage, or additional operating space, while the street parking helps accommodate walk-in and appointment-based traffic.
Key Highlights
- Approximately 2,100 SF office building in a downtown Edgebrook location (built 1958)
- Recently updated, previously used as a dental office with a layout suited to medical/dental or professional services
- Large reception area plus 5 offices and a finished basement
Financial Insights
Estimated NOI and Cap Rate
NOI / Yr
$27,821
Cap Rate
6.64%
Suggested Prices Based on Cap Rates
Cap Rate 5%
$556,420
$556.4K
Cap Rate 7%
$397,443
$397.4K
Cap Rate 9%
$309,122
$309.1K
Market Conditions
NOI Build-Up for 2,100 SF
Gross rent
$50.4K $24.00/SF
− Vacancy
−$4.0K −$1.92/SF
EGI
$46.4K $22.08/SF
− OpEx
−$18.5K −$8.83/SF
NOI
$27.8K $13.25/SF
Area
Chicago, IL
Vacancy
8.00%
Lease Rate
$24.00 /SF/Yr
Expense Ratio
40.00%
Simulate Cap Rate and NOI
Suggested Prices Based on Cap Rates
Cap Rate 5%
$556,420
Cap Rate 7%
$397,443
Cap Rate 9%
$309,122
Alternative Uses
Best Use
Office B
$643.7K
$563.2K – $751.0K
NOI $45,058 @ 7.0% cap · market cap 10.75%
Second Best
Healthcare Medical
$397.4K
$347.8K – $463.7K
NOI $27,821 @ 7.0% cap · market cap 6.64%
Theoretical Best
Office A
$990.1K
$866.4K – $1.16M
NOI $69,310 @ 7.0% cap · market cap 16.54%
Zoning and permitted uses should be independently verified with authorities.
How Realmo checks its estimates
Property Analytics
Who owns this building?
See the owner, sales and loan history
Open Analytics
Current Use
Lease Details
5
Office units
Yes
Highway access
Location Intelligence
Trade Area within ½ mile
1,104
Businesses Nearby
Under-served
Demand for This Use
Explore this area
Business Placement
Demographics for 60646, IL
28,383
Population
11,636
Households
2.4
Avg Household Size
44
Median Age
58%
College-Educated
95%
High-School Grad
4.4 sq mi
ZIP Area
6,451
Density / Sq Mi
$111,115
Median Household Income
$66,105
Median Earnings
$1,241
Median Rent
$493,600
Median Home Value
Check the figures for this property
Cap Rate, Value Estimation, Potential NOI and more
View Realmo Analytics
Market
Vacancy Rate% for Office in Chicago, IL



Similar Off Market Nearby
- Chicago Cat Clinic — 5301 W Devon Ave, Chicago, IL 60646
- Lincolnwood Animal Hospital — 6431 N Cicero Ave, Lincolnwood, IL 60712
Frequently Asked Questions
What type of property is this?
Medical Office Space - Recently updated office building set up for medical or professional services, with a large reception and multiple exam or office rooms.
Where is this medical office space located?
The property is located at 5307 W Devon Ave Chicago, IL.
What is the asking price?
The asking price for this property is $419,000.
What are key features of this property?
This property features: Approximately 2,100 SF office building in a downtown Edgebrook location (built 1958); Recently updated, previously used as a dental office with a layout suited to medical/dental or professional services; Large reception area plus 5 offices and a finished basement


