Renovated Residential Income
For Sale
$279,900
53 INVERNESS CIRCLE, Marlton, NJ 08053
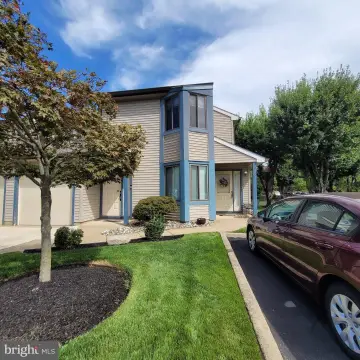
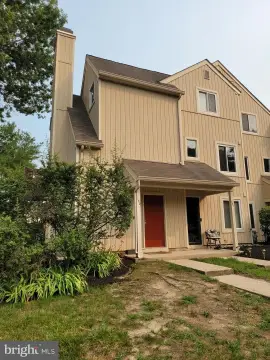
Renovated two-bedroom home with an open living plan, sunroom, private porch, and gas heat.
Property Size1,028 SF
Days on Market50
Property Features for 53 INVERNESS CIRCLE
General Information
Standard status
Active
Size
1,028 SF
Property subtype
Unit/Flat/Apartment
Site & Location
Highway Access
Yes
Utilities to Site
Yes
Additional Details
Multifamily Units
1
Taxes and HOA fees
Annual Taxes
$5,746
Amenities
water activities
community pool
tennis
basketball
volleyball
baseball fields
golf course
Building Details
Building Size
1,028 SF
Year Built
1993
Listing Agency:
BHHS Fox & Roach-Medford
Listed By:
Don G Birnbohm · License #340029
(609) 923-4407
Source:
Brucerealty
Added: Sep 7
Changed: Oct 25
Last Checked: Oct 25 at 12:07AM
Displayed information is deemed reliable but is not guaranteed and should be independently verified. All listing content including descriptions, pricing, images are the copyrighted material of BHHS Fox & Roach-Medford

Ask AI about this property
Review the available facts, identify missing information and prepare questions for the agent.
Investment Insights
Based on property information with market context.
This 1993 residential income property has undergone a top-to-bottom renovation and offers two bedrooms, an open main living area, and a sunroom currently used as a dining space. Improvements include luxury vinyl plank flooring, replacement windows, Plantation Shutters, a private porch with Sunshade, and a kitchen with quartz countertops, subway tile backsplash, updated cabinetry hardware, stainless-steel appliances, gas cooking, and a breakfast bar. The home uses gas heat, and a one-year warranty on all mechanicals, including the HVAC, is provided.
The property is located in the Inverness Greene neighborhood within the Kings Grant Lake Community in Marlton. Community amenities include beaches, kayaking and fishing lakes, a pool, tennis, basketball, volleyball, baseball fields, and leisure privileges at the semi-private 18-hole golf course, The Links. Shopping and dining at The Promenade at Sagemore and other retail centers are nearby, with access to Routes 70 and 73, I-295, and the NJ Turnpike.
The property is located in the Inverness Greene neighborhood within the Kings Grant Lake Community in Marlton. Community amenities include beaches, kayaking and fishing lakes, a pool, tennis, basketball, volleyball, baseball fields, and leisure privileges at the semi-private 18-hole golf course, The Links. Shopping and dining at The Promenade at Sagemore and other retail centers are nearby, with access to Routes 70 and 73, I-295, and the NJ Turnpike.
Key Highlights
- Two‑bedroom residential income property built in 1993
- Top‑to‑bottom renovation with luxury vinyl plank flooring and replacement windows
- Kitchen with quartz surfaces, stainless‑steel appliances, gas cooking, and breakfast bar
Financial Insights
Estimated NOI and Cap Rate
NOI / Yr
$10,440
Cap Rate
3.73%
Suggested Prices Based on Cap Rates
Cap Rate 5%
$208,800
$208.8K
Cap Rate 7%
$149,143
$149.1K
Cap Rate 9%
$116,000
$116.0K
Market Conditions
NOI Build-Up for 1,028 SF
Gross rent
$20.1K $19.56/SF
− Vacancy
−$1.1K −$1.10/SF
EGI
$19.0K $18.46/SF
− OpEx
−$8.5K −$8.31/SF
NOI
$10.4K $10.16/SF
Area
Camden County, NJ
Vacancy
5.60%
Lease Rate
$19.56 /SF/Yr
Expense Ratio
45.00%
Simulate Cap Rate and NOI
Suggested Prices Based on Cap Rates
Cap Rate 5%
$208,800
Cap Rate 7%
$149,143
Cap Rate 9%
$116,000
Alternative Uses
Best Use
Apartment 5plus
$149.1K
$130.5K – $174.0K
NOI $10,440 @ 7.0% cap · market cap 3.73%
Second Best
—
—
no second resolved use
Theoretical Best
Office A
$260.7K
$228.1K – $304.1K
NOI $18,246 @ 7.0% cap · market cap 6.52%
Zoning and permitted uses should be independently verified with authorities.
How Realmo checks its estimates
Property Analytics
Contact the owner directly
Get the owner's phone numbers and email
Open Analytics
Lease Details
1
Residential units
Yes
Highway access
Yes
Utilities to site
Location Intelligence
Trade Area within ½ mile
82
Businesses Nearby
Explore this area
Business Placement
Demographics for 08053, NJ
46,826
Population
20,090
Households
2.3
Avg Household Size
43
Median Age
53%
College-Educated
98%
High-School Grad
29.2 sq mi
ZIP Area
1,604
Density / Sq Mi
$116,745
Median Household Income
$67,439
Median Earnings
$1,939
Median Rent
$368,100
Median Home Value
Check the figures for this property
Cap Rate, Value Estimation, Potential NOI and more
View Realmo Analytics





Frequently Asked Questions
What type of property is this?
Residential income property - Renovated two-bedroom home with an open living plan, sunroom, private porch, and gas heat.
Where is this residential income property located?
The property is located at 53 INVERNESS CIRCLE Marlton, NJ.
What is the asking price?
The asking price for this property is $279,900.
What are key features of this property?
This property features: Two‑bedroom residential income property built in 1993; Top‑to‑bottom renovation with luxury vinyl plank flooring and replacement windows; Kitchen with quartz surfaces, stainless‑steel appliances, gas cooking, and breakfast bar


