Renovated Residential Income

For Sale
$230,000
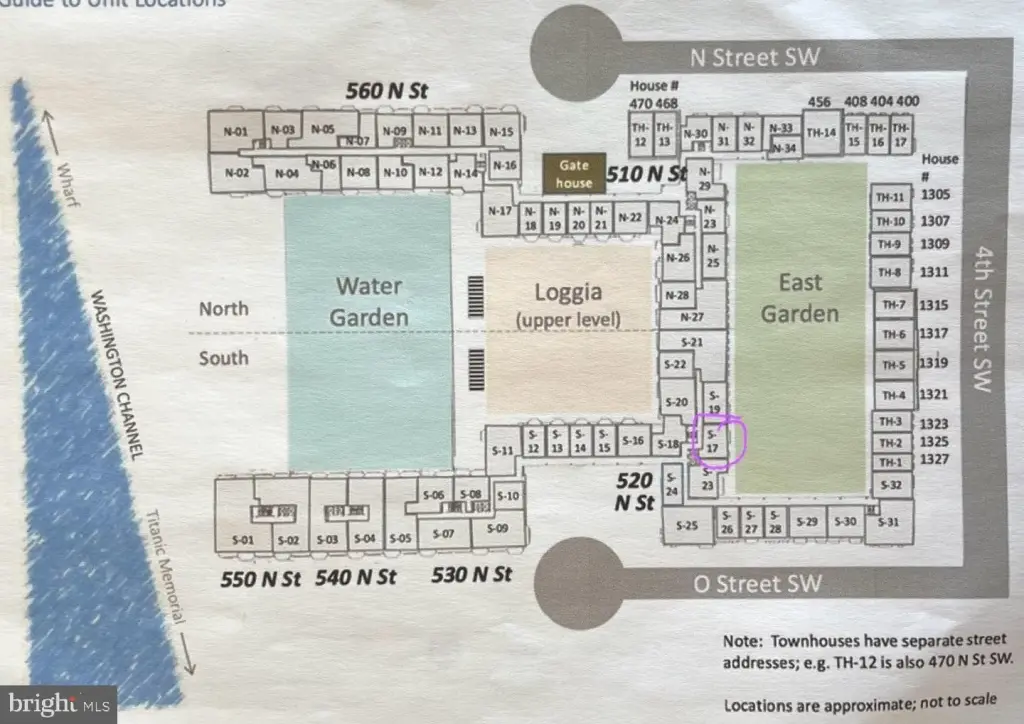
520 N ST SW #S317, Washington, DC 20024
WASHINGTON, DC
Property Size645 SF
Price / SF$356.59
Days on Market64
Property Features for 520 N ST SW #S317
General Information
Property type
Residential Multi Family
Property subtype
Other
Bedrooms
1
Bathrooms
1
Full bathrooms
1
Rooms
Bedroom 1
Subdivision
WATERFRONT SW RLA
Elementary school district
DISTRICT OF COLUMBIA PUBLIC SCHOOLS
Middle school district
DISTRICT OF COLUMBIA PUBLIC SCHOOLS
High school district
DISTRICT OF COLUMBIA PUBLIC SCHOOLS
Standard status
Active
Amenities
24/7 Security Gate
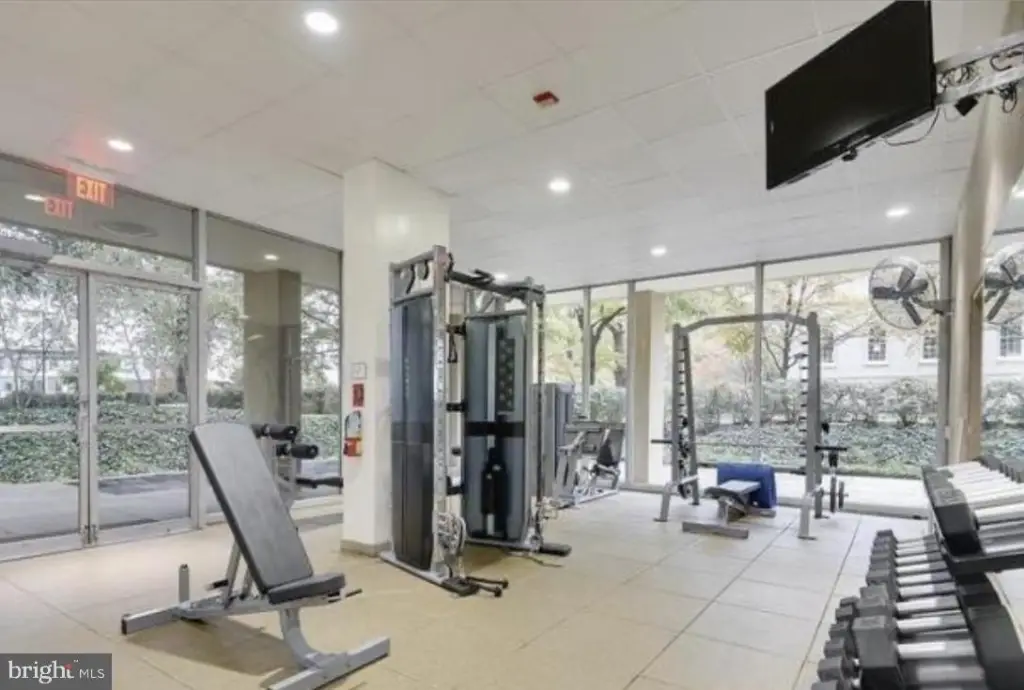
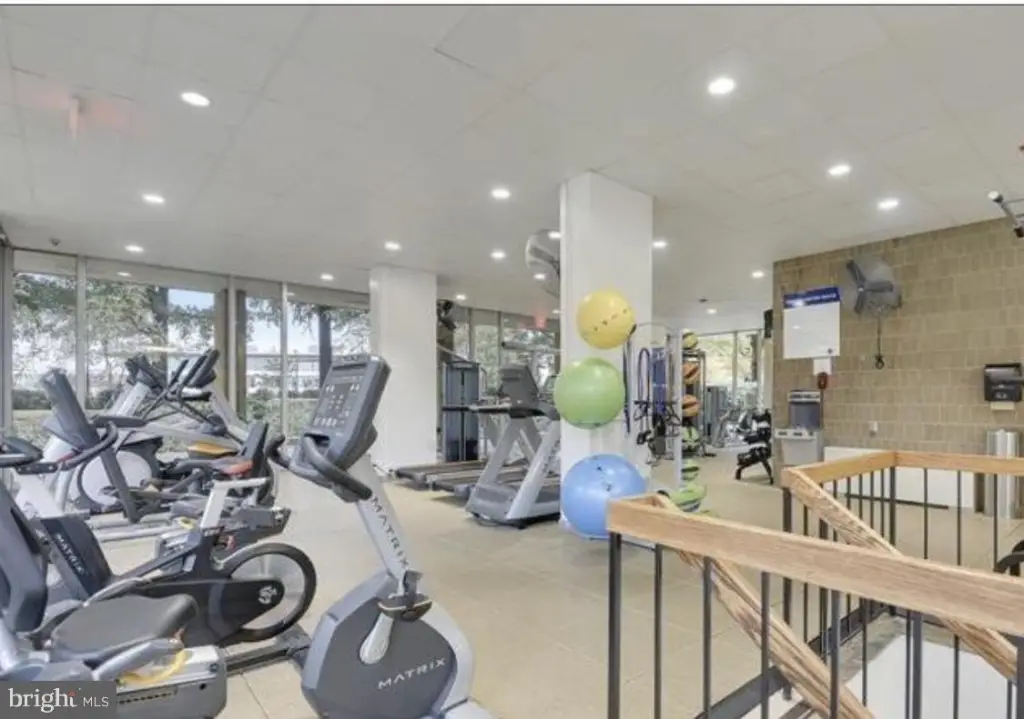
Glass Enclosed Gym
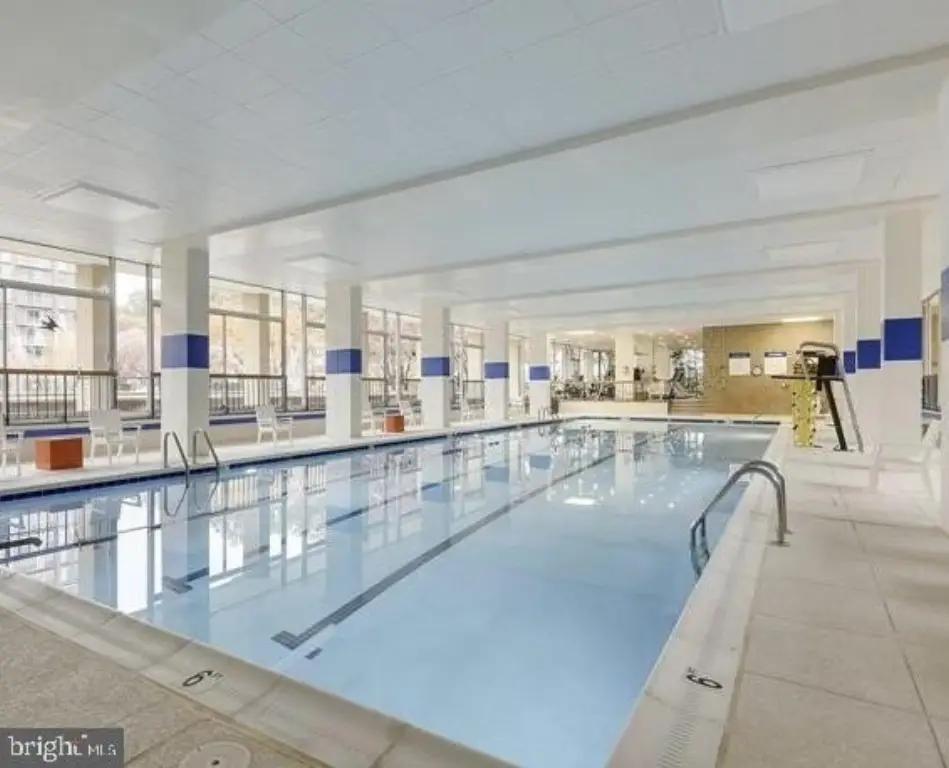
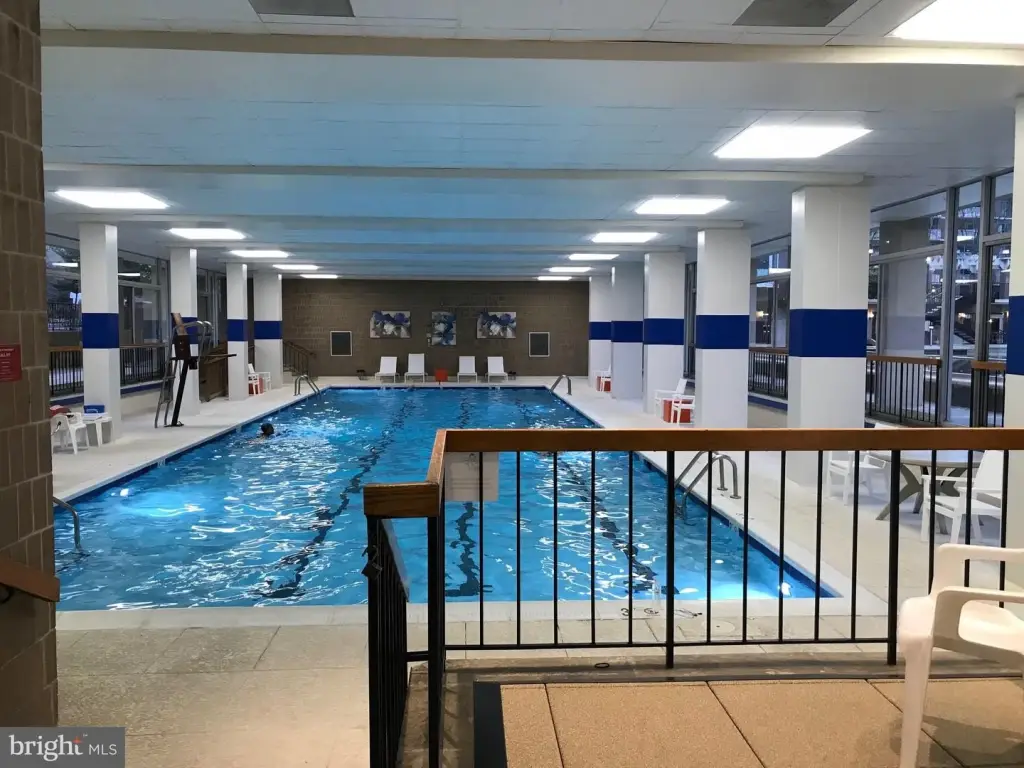
Indoor Pool
Rooftop Terrace
EV Chargers
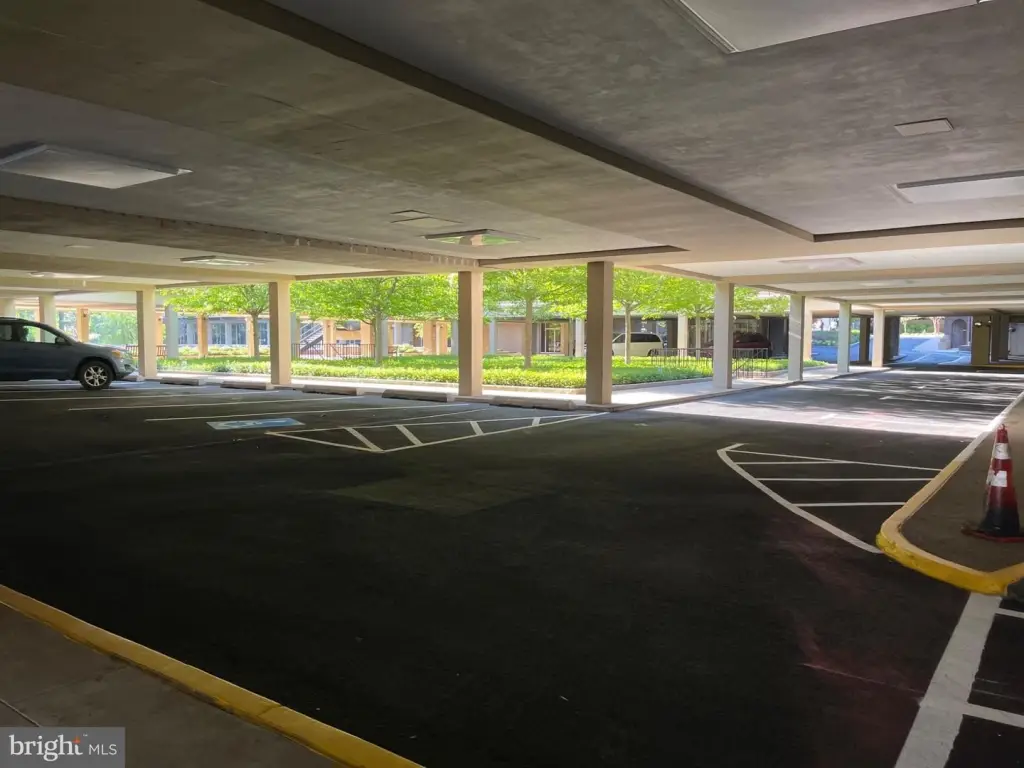
Guest Parking
Building Details
Year built
1966
Listing Agency:
Chevy Chase Circle
(202) 966-1400
Listed By:
Nancy Pulley
Added: Aug 17
Changed: Aug 19
Last Checked: Oct 19 at 6:06AM
MLS# DCDC2278826
Copyright © 2026 Long & Foster Real Estate. All rights reserved. All information provided by the listing agent/broker is deemed reliable but is not guaranteed and should be independently verified.

Ask AI about this property
Review the available facts, identify missing information and prepare questions for the agent.
Investment Insights
Based on property information with market context.
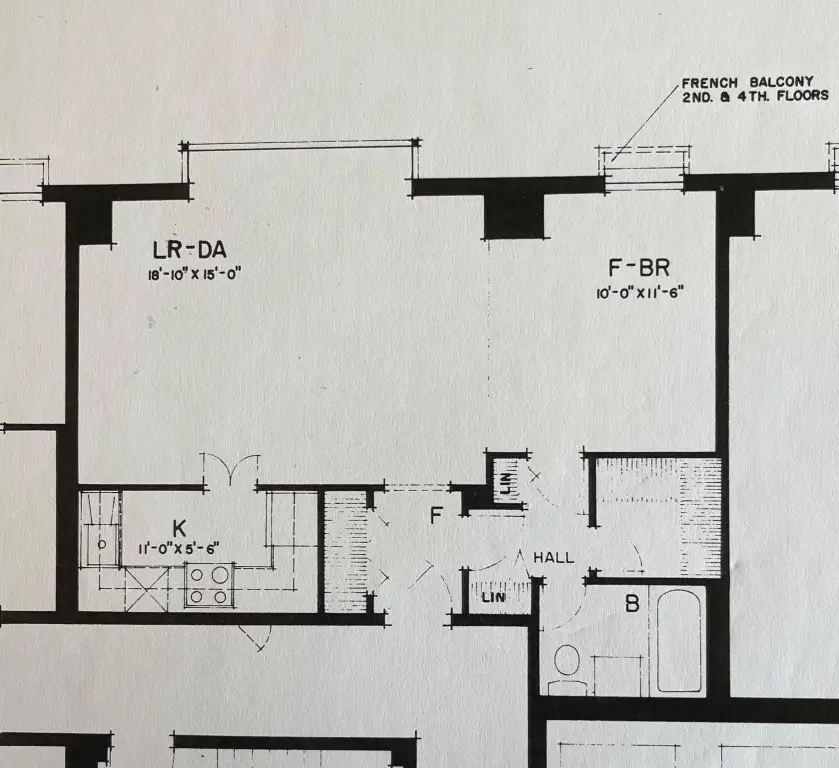
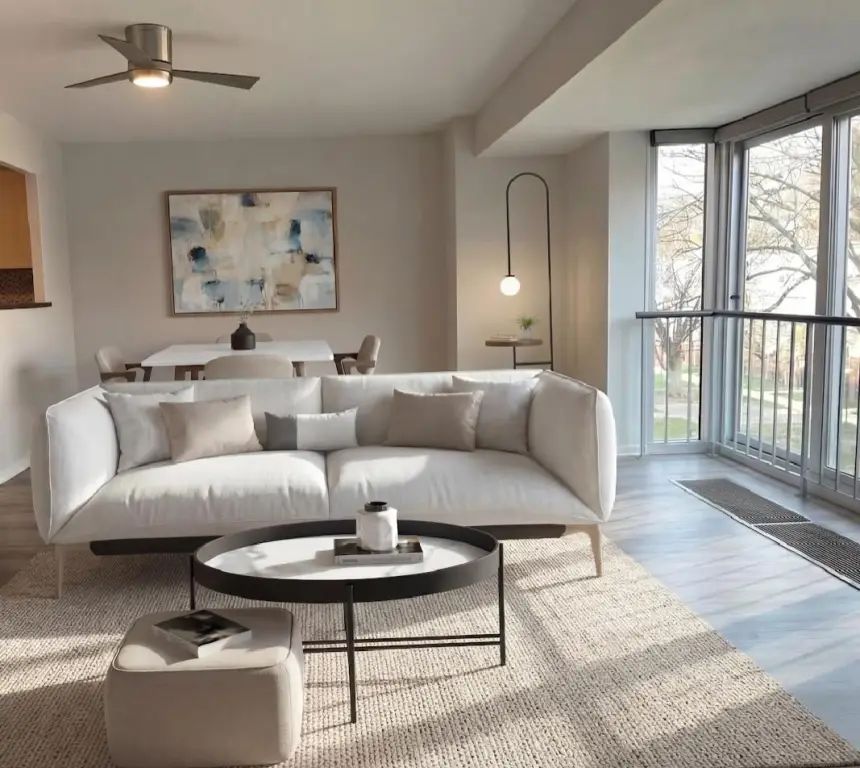
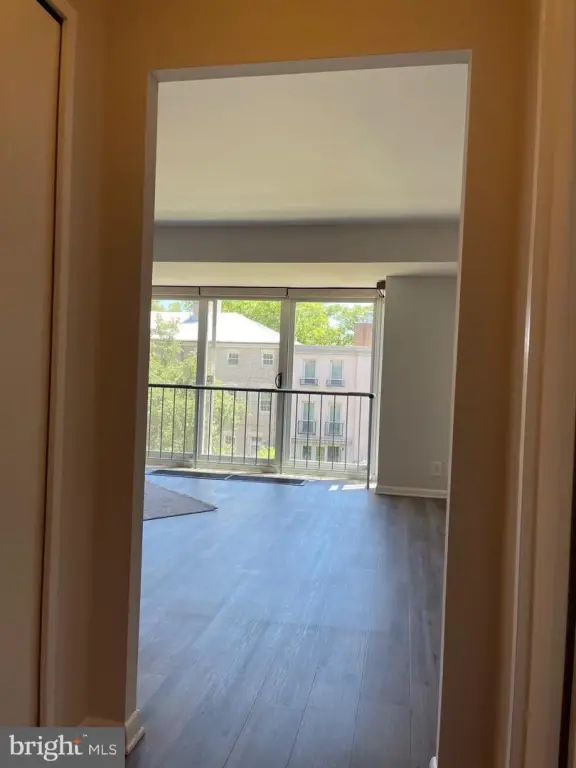
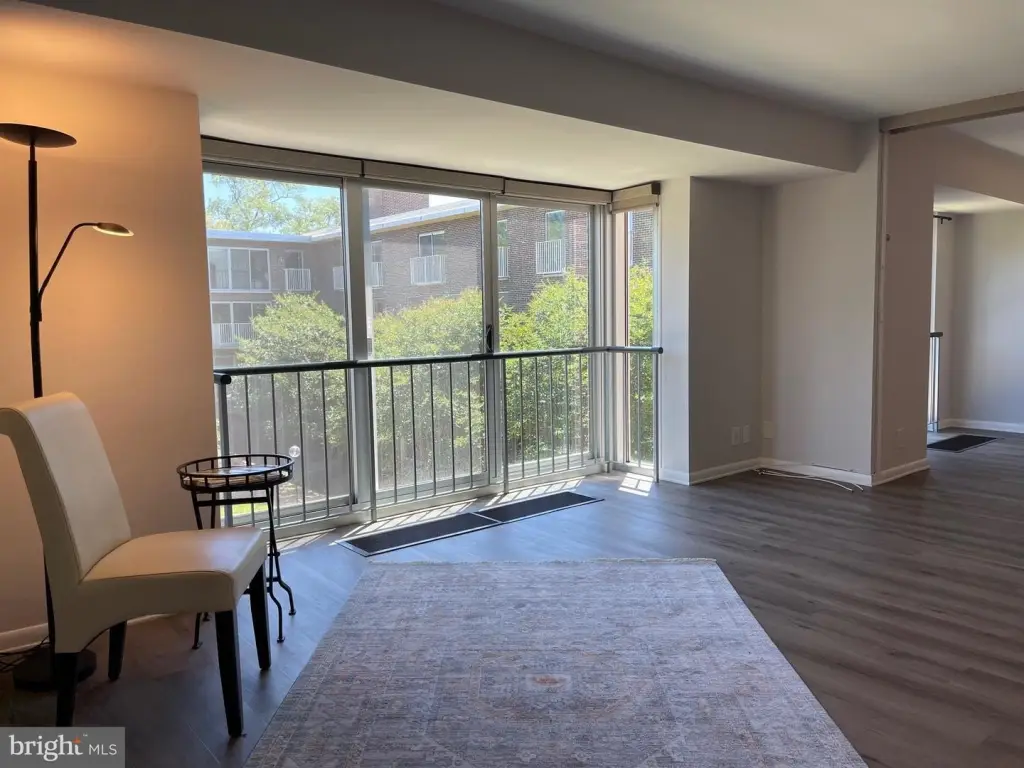
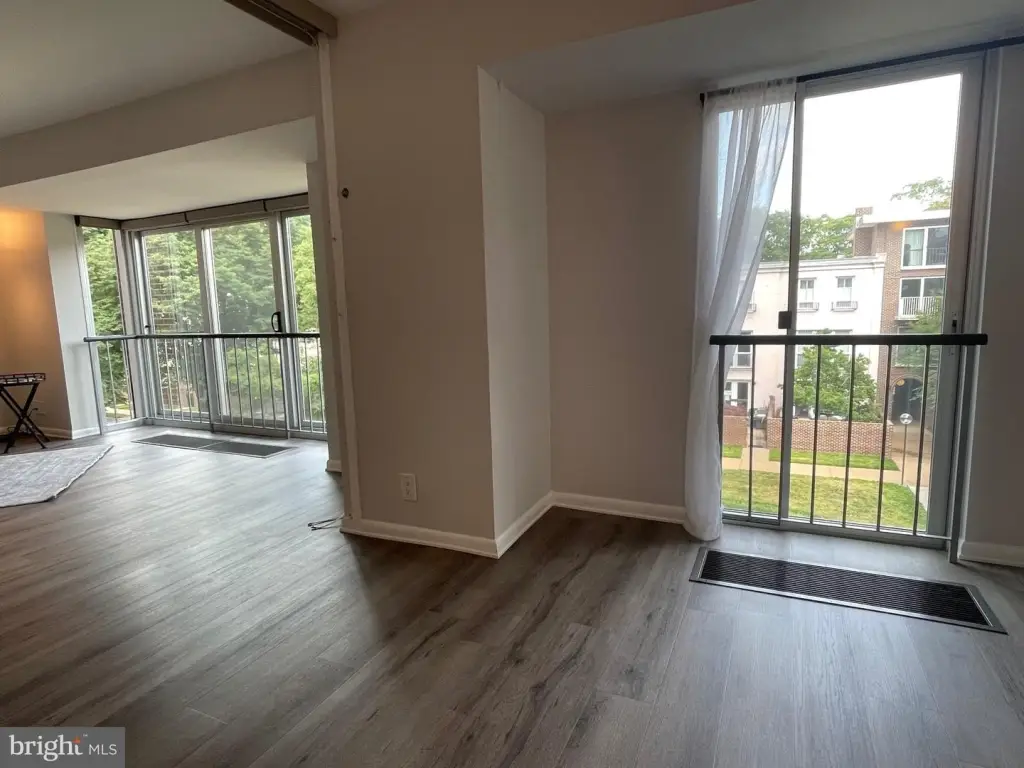
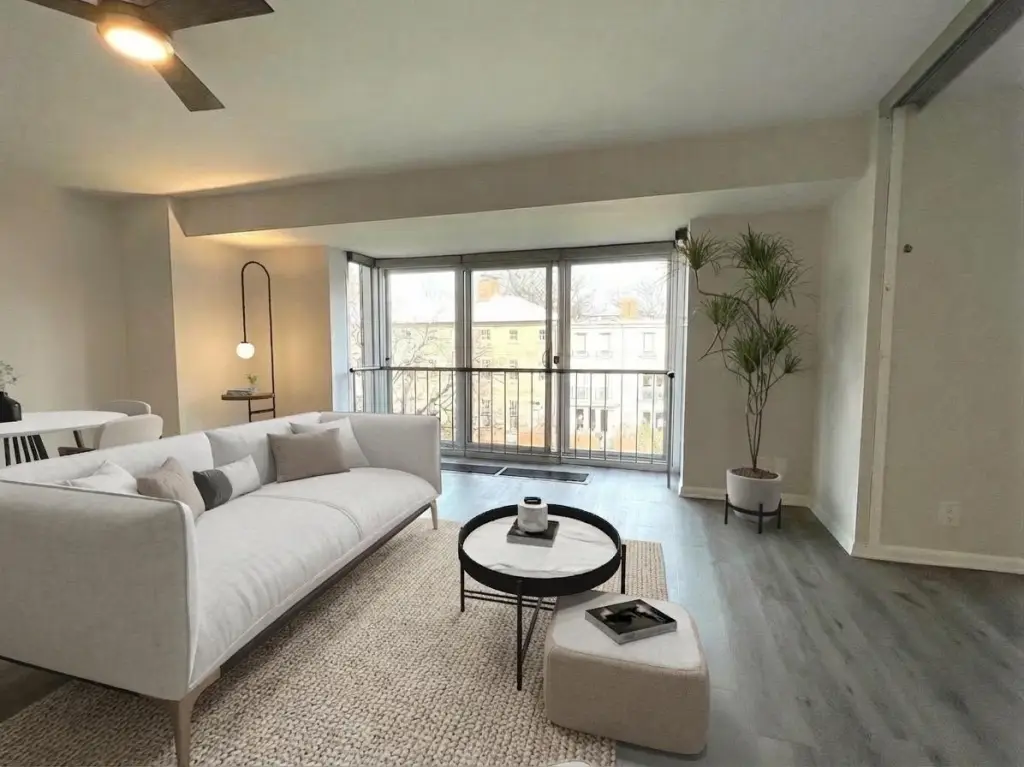
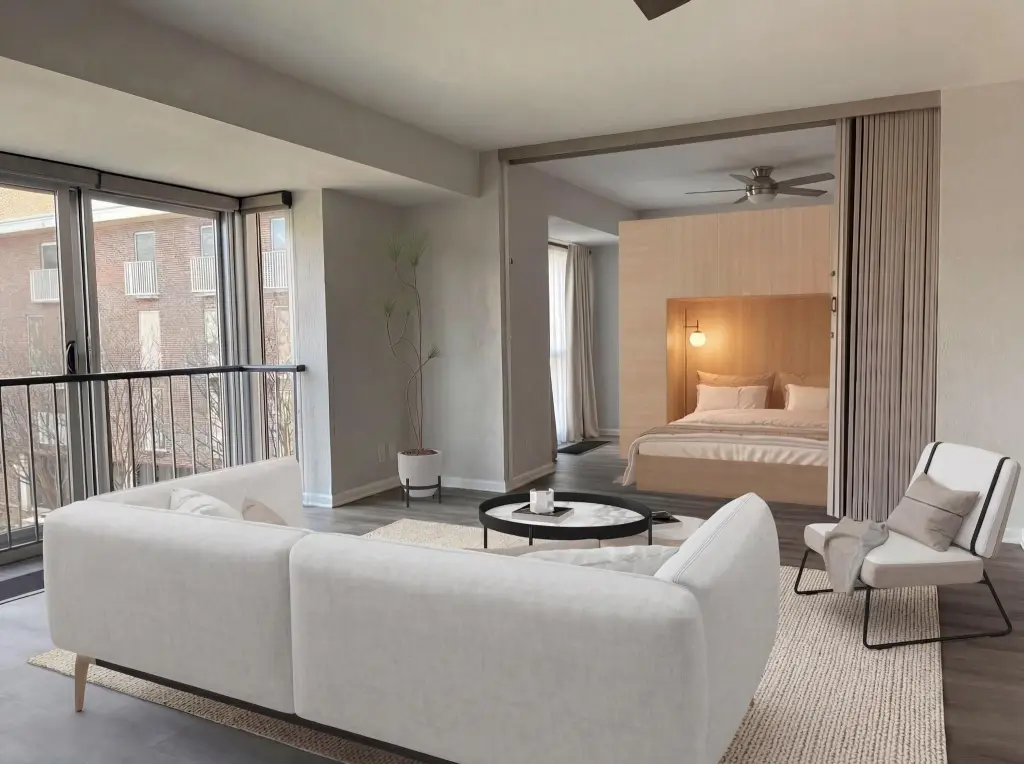
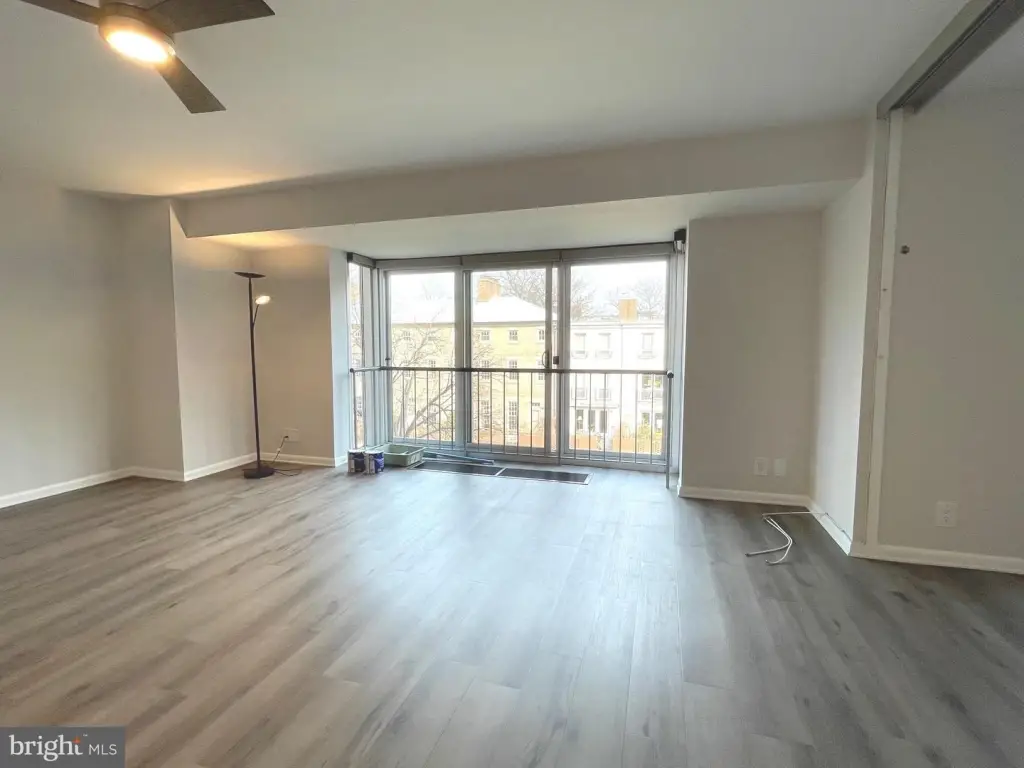
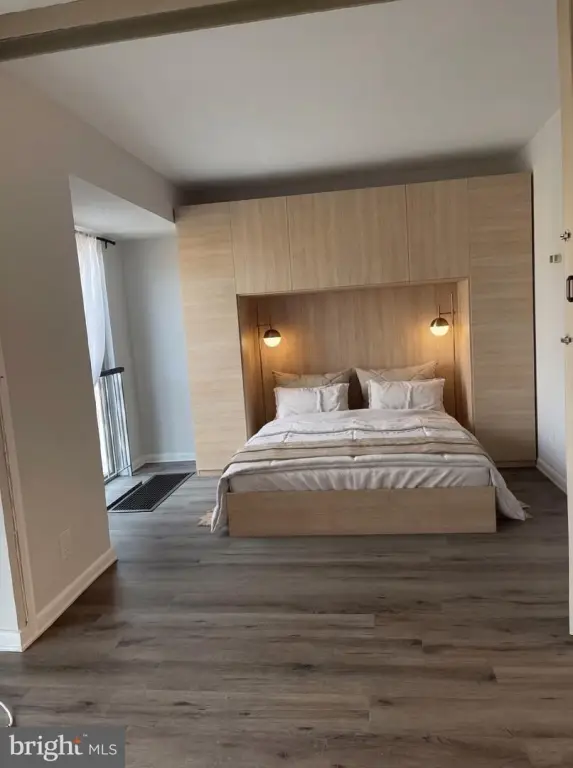
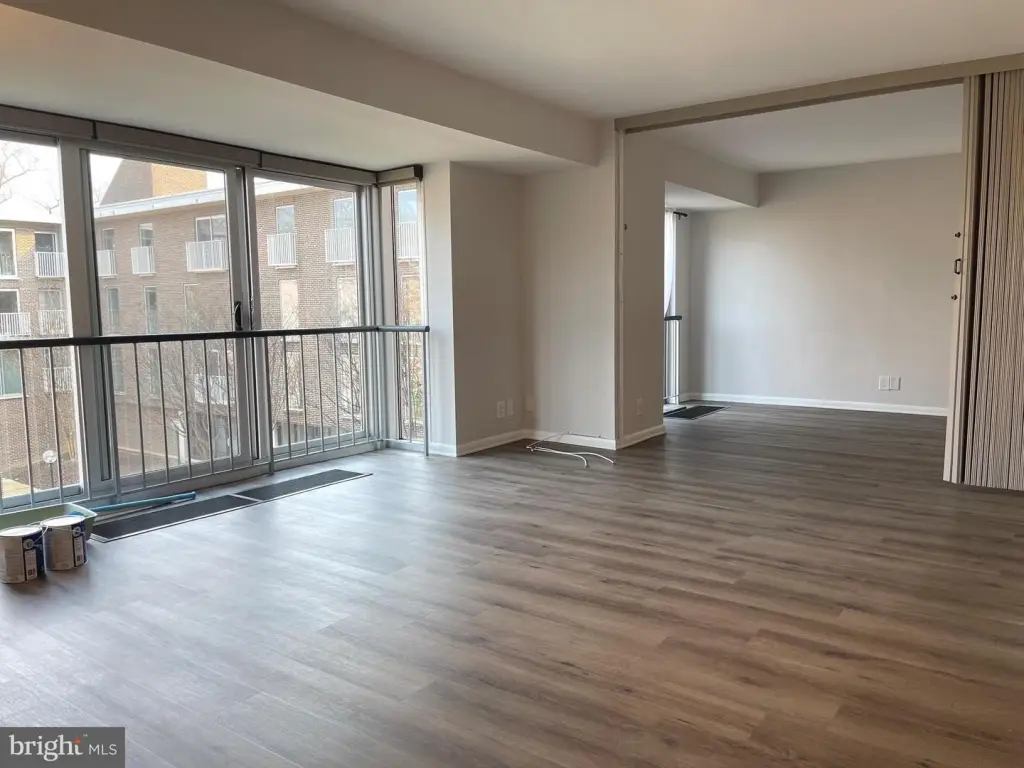
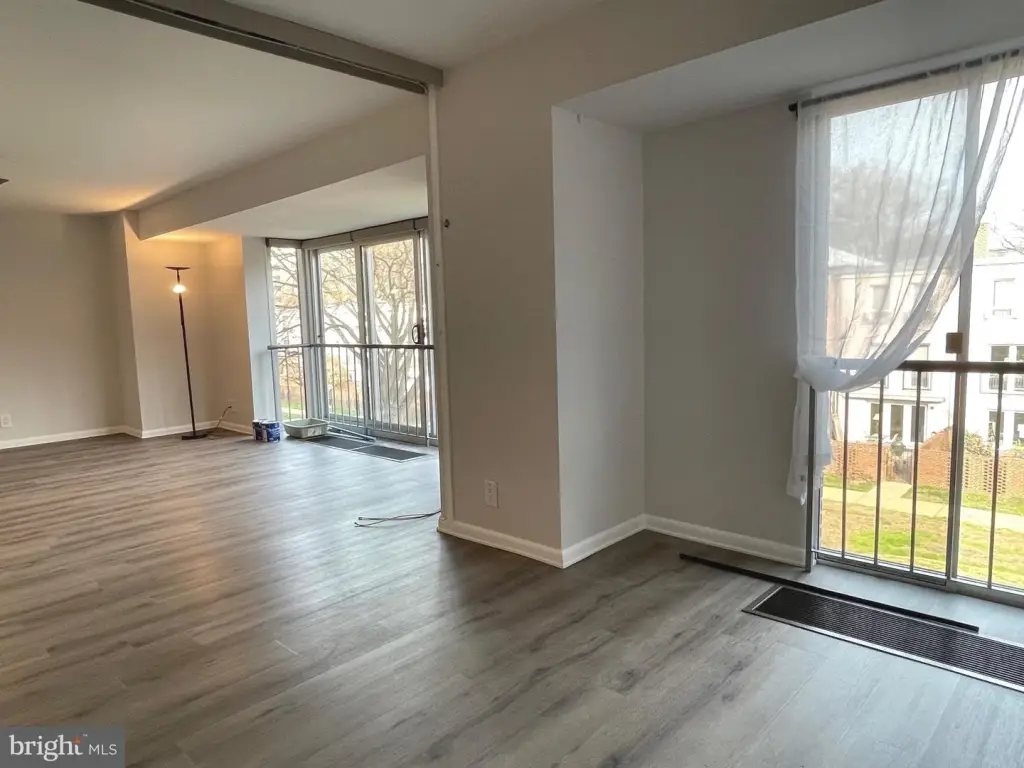
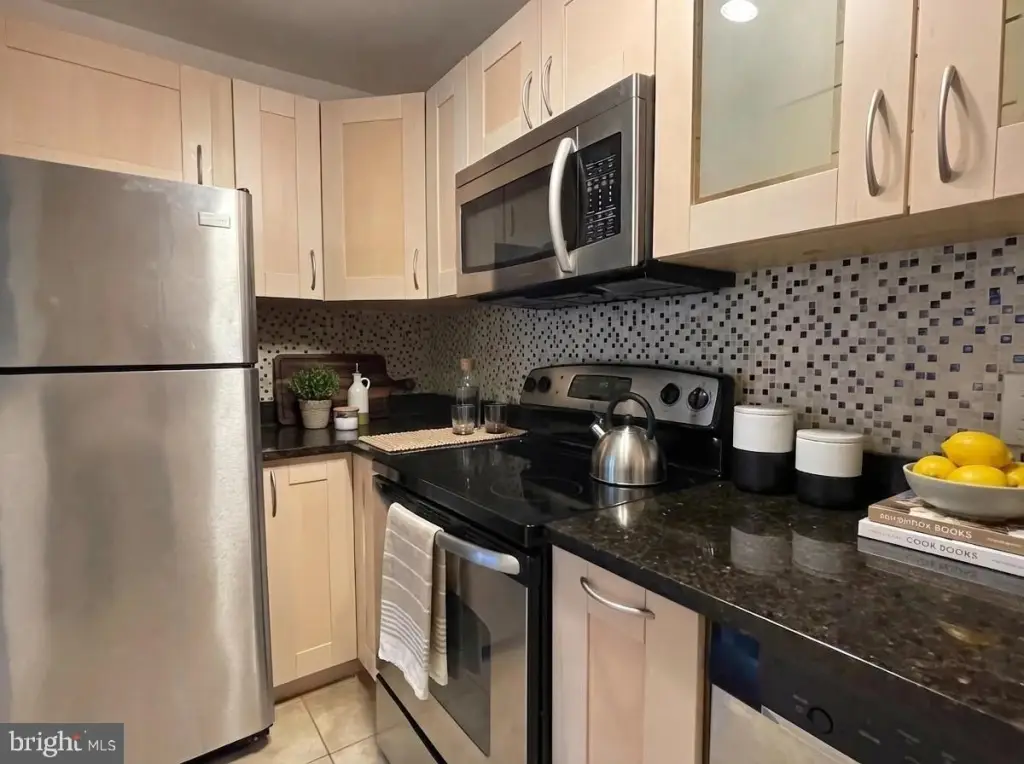
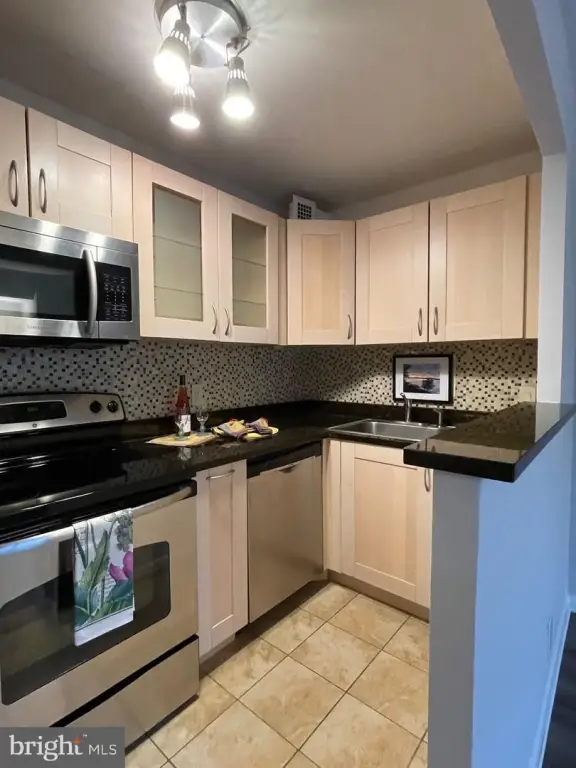
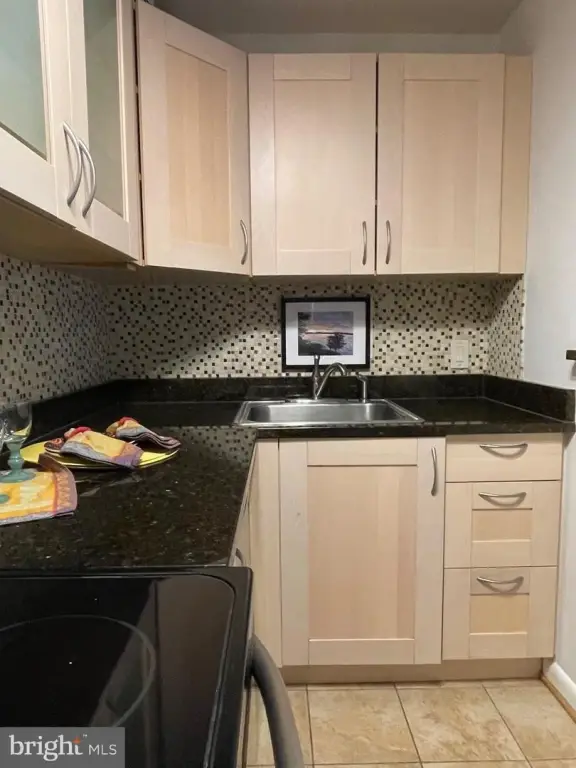
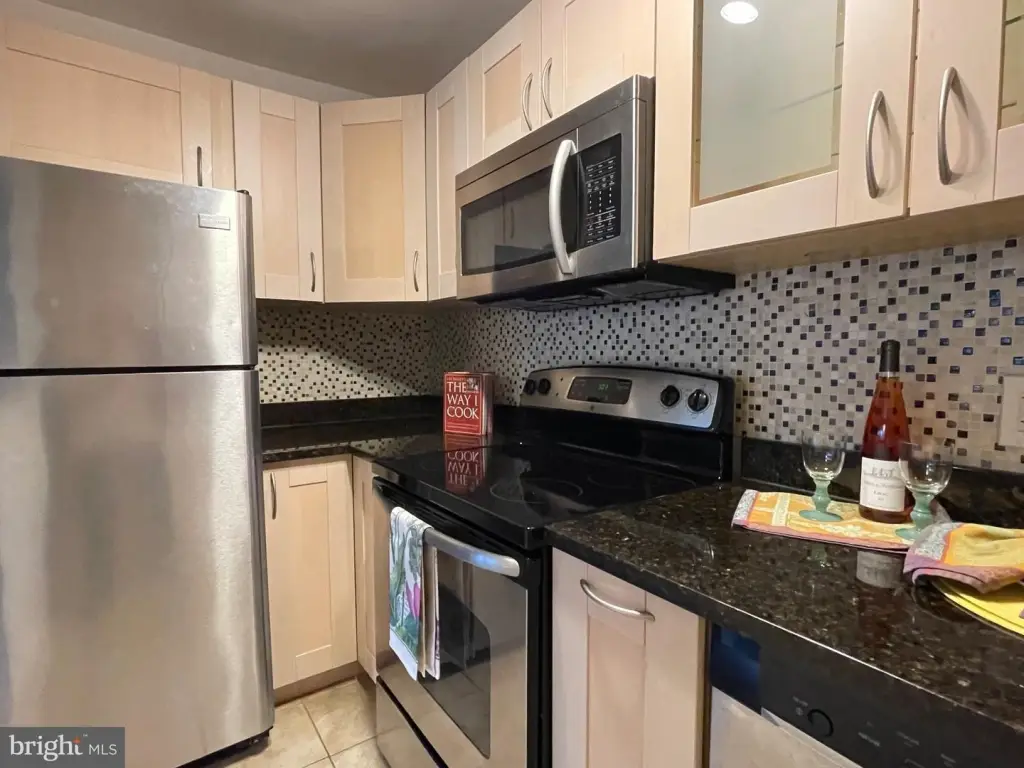
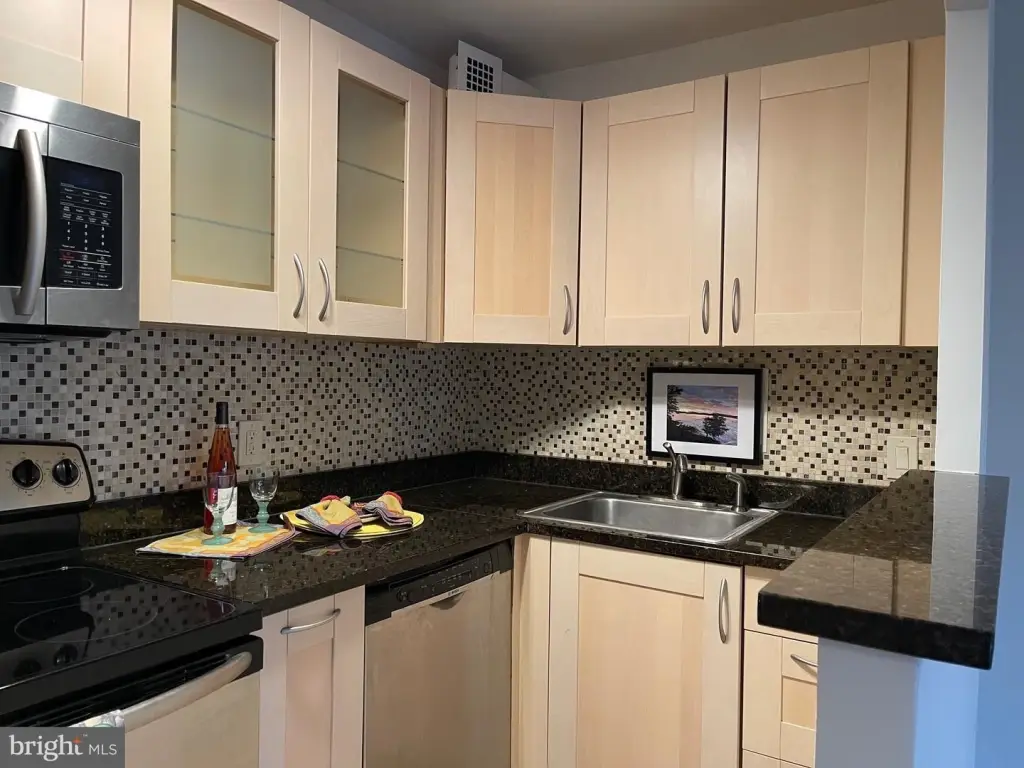
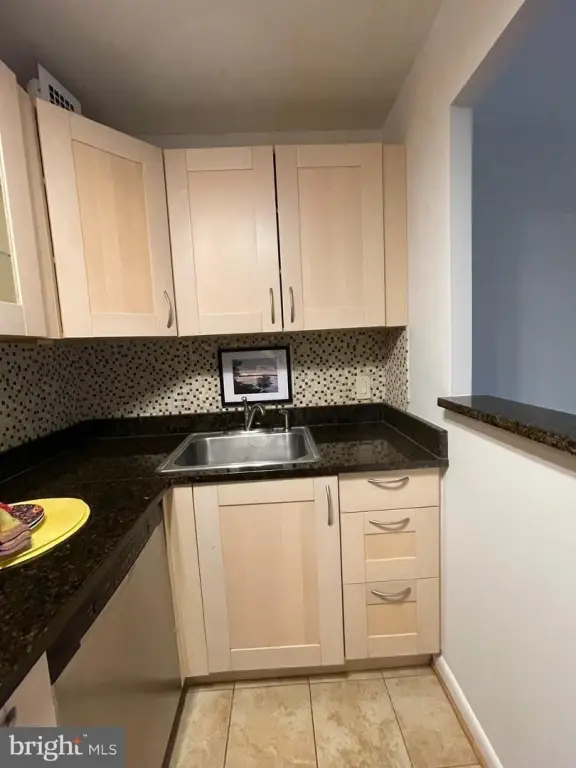
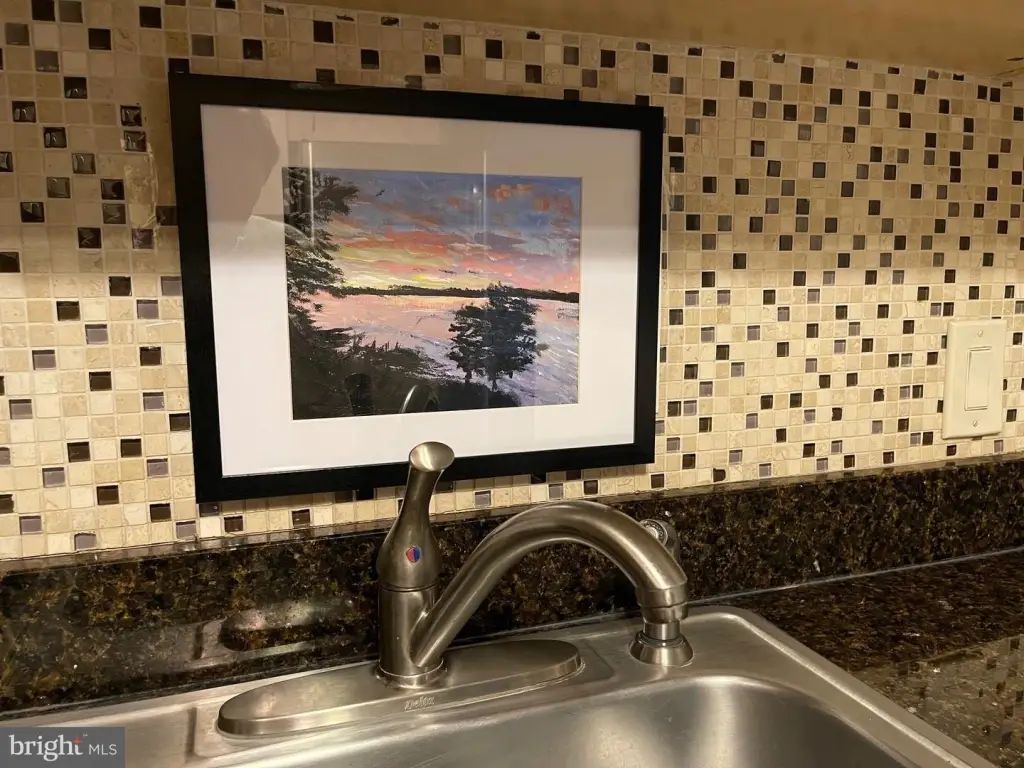
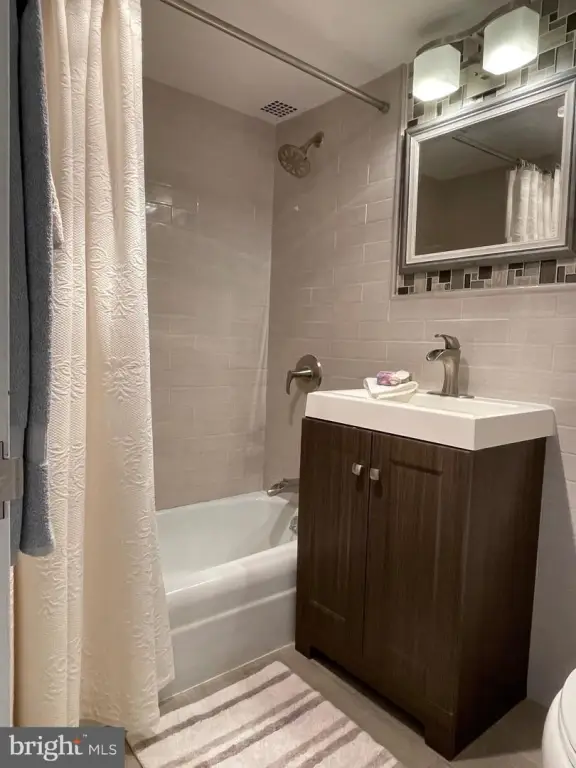
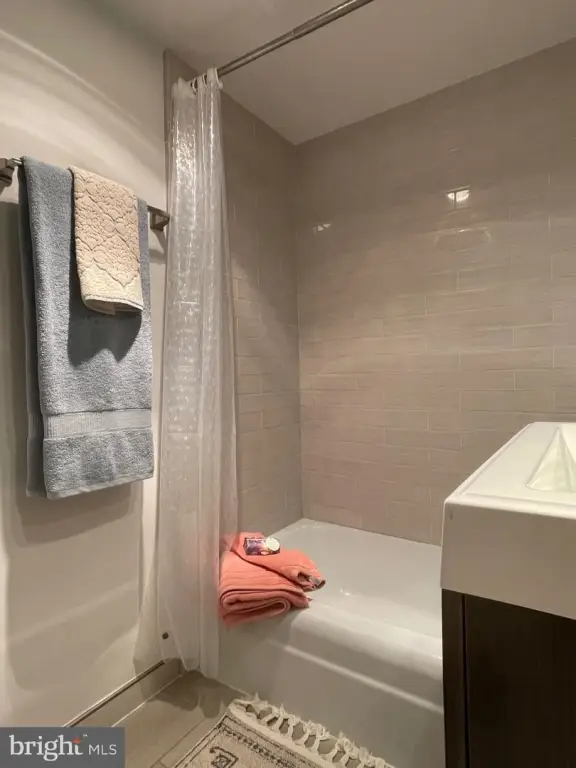
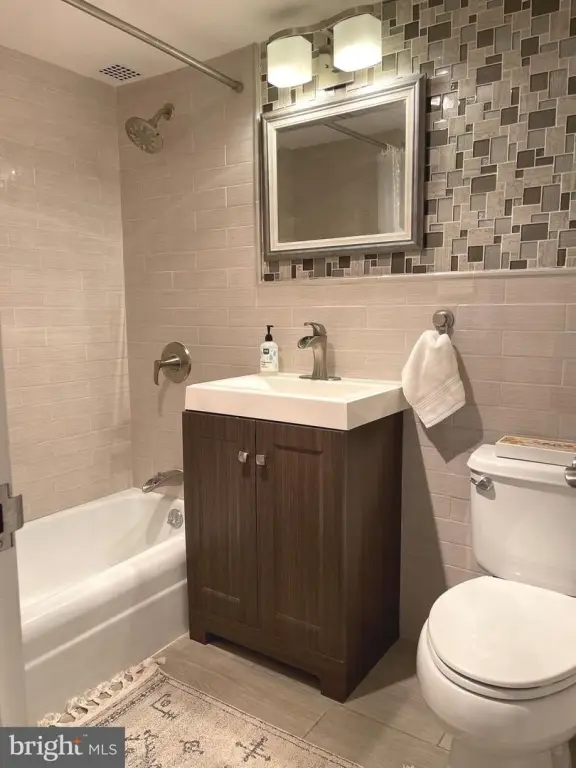
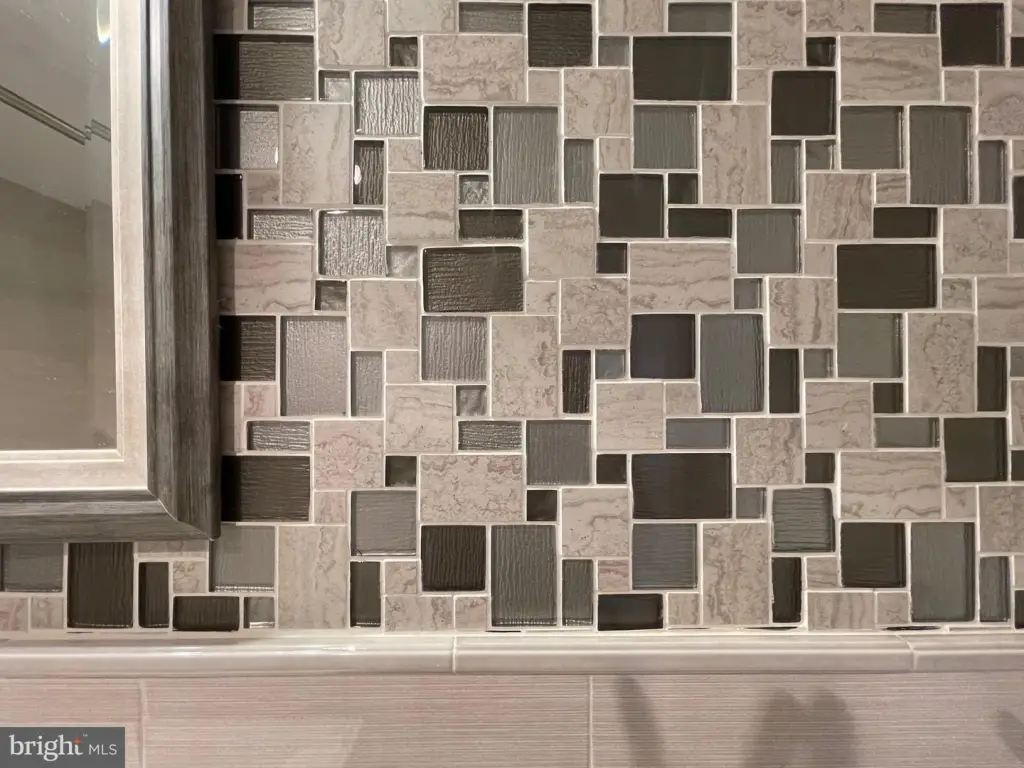
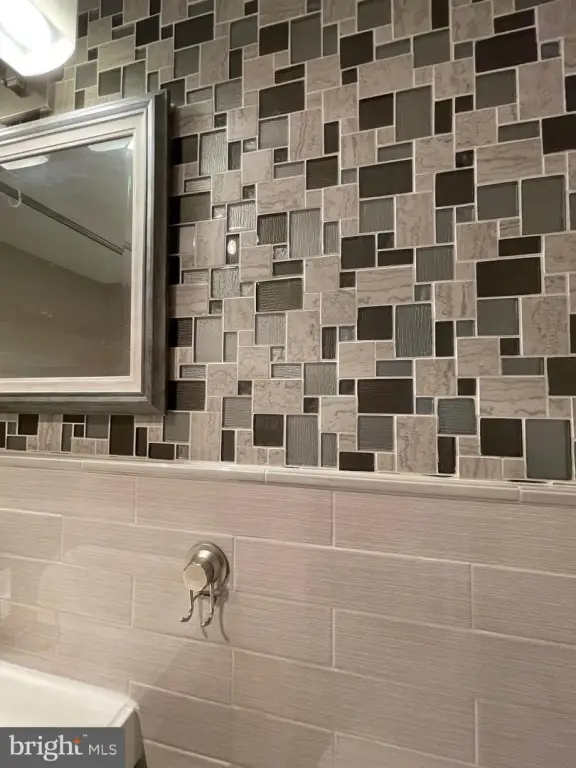
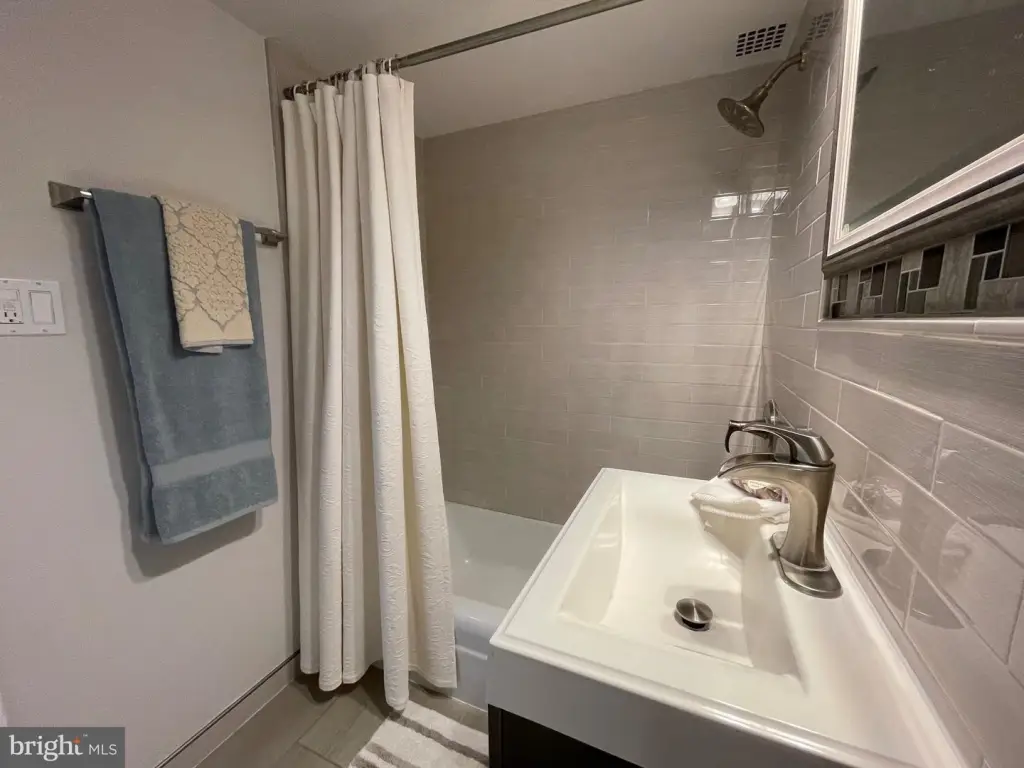
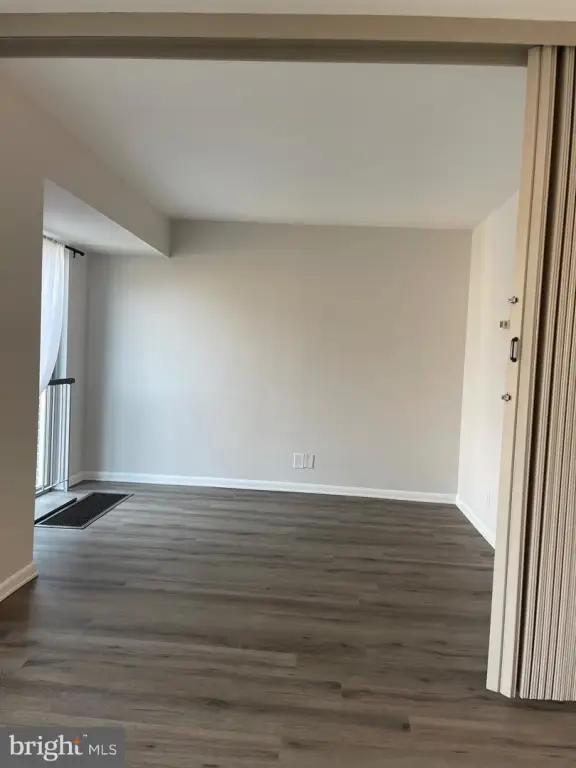
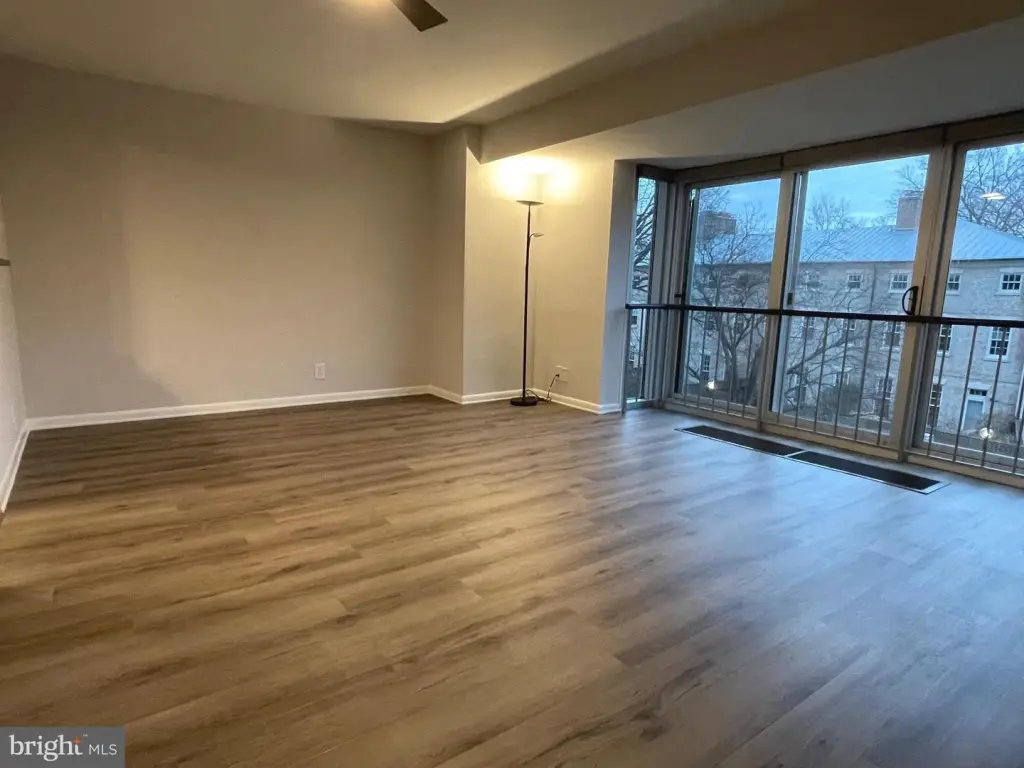
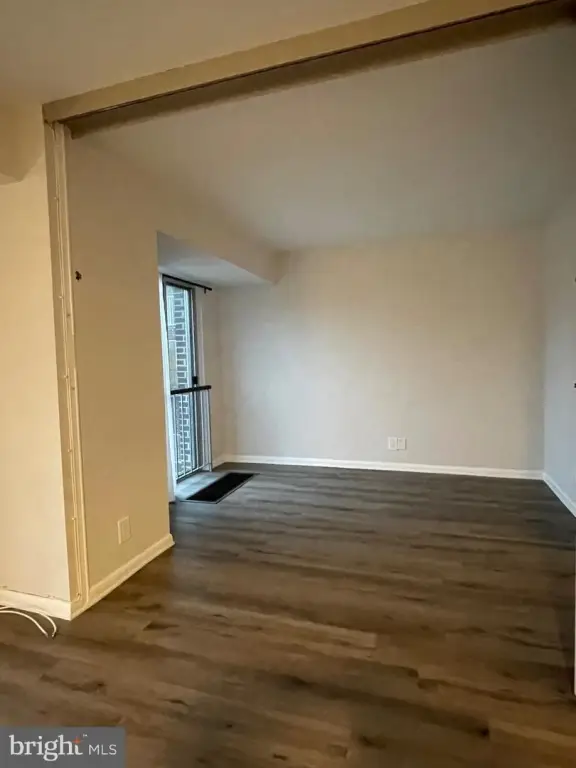
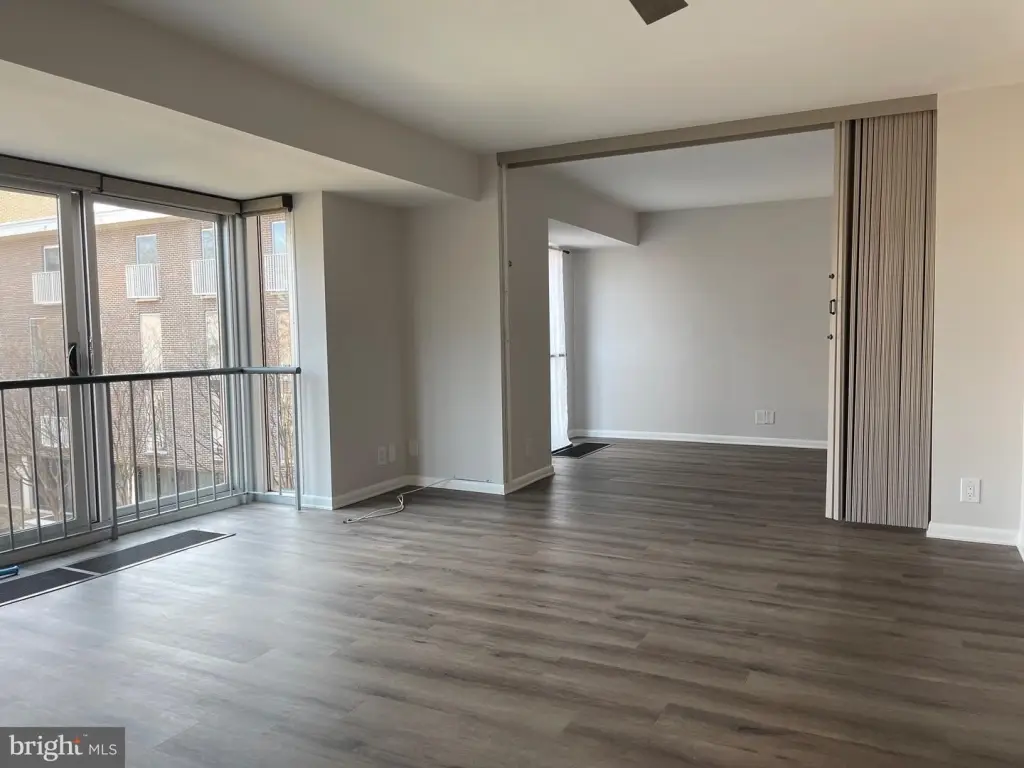
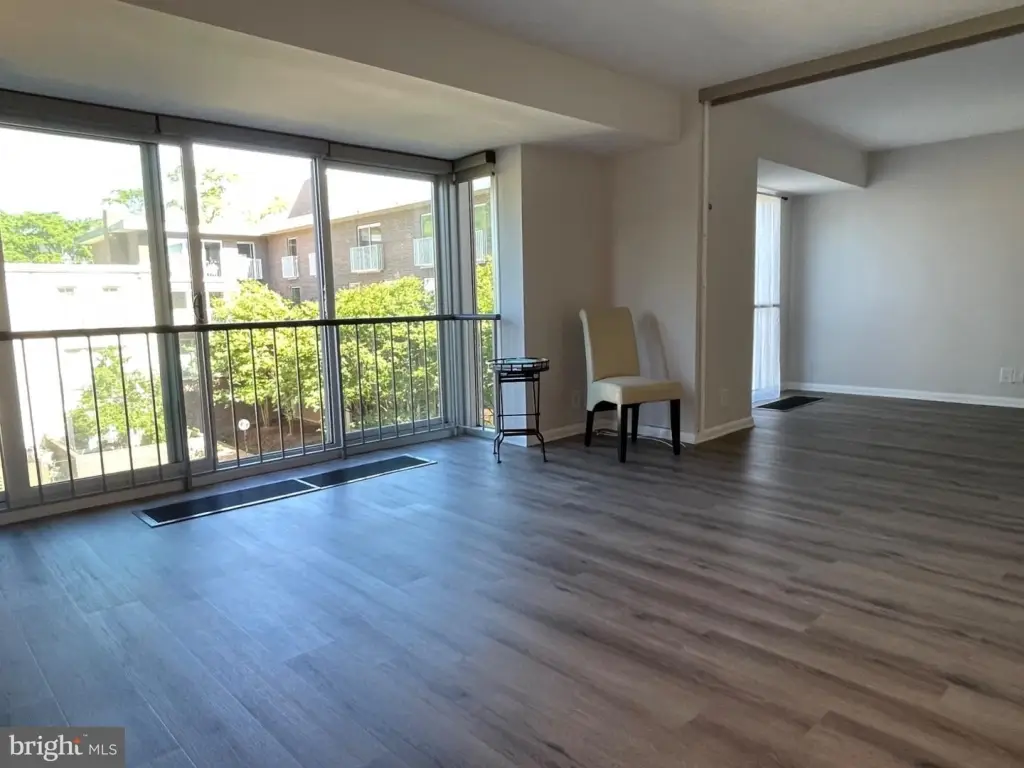
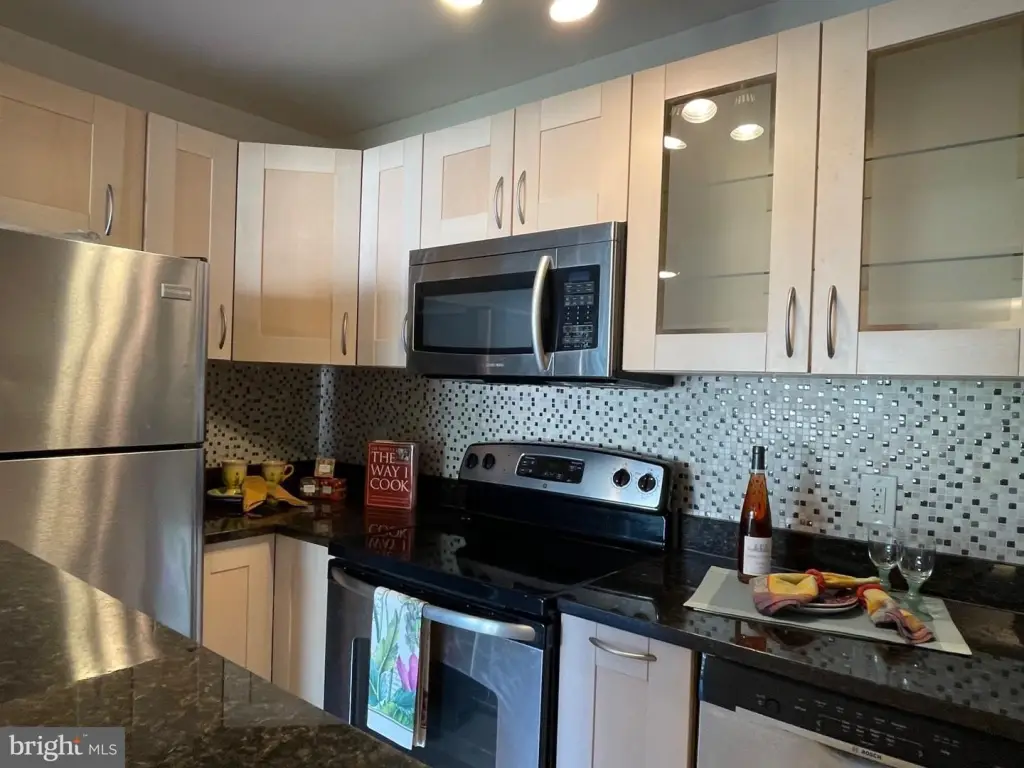
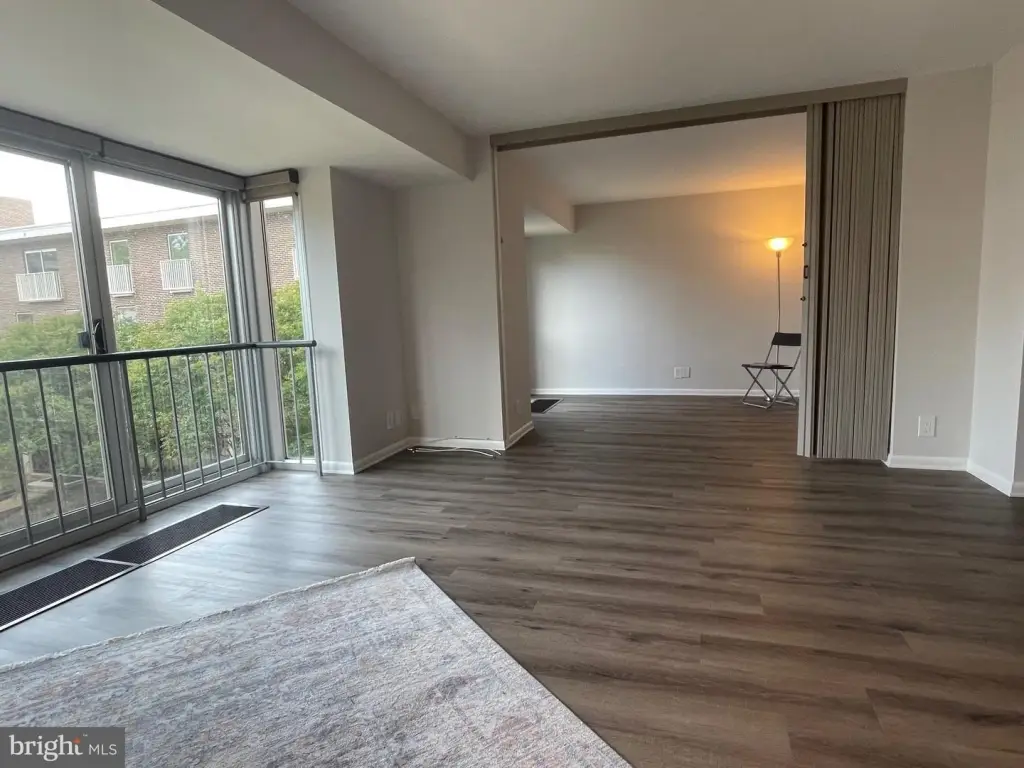
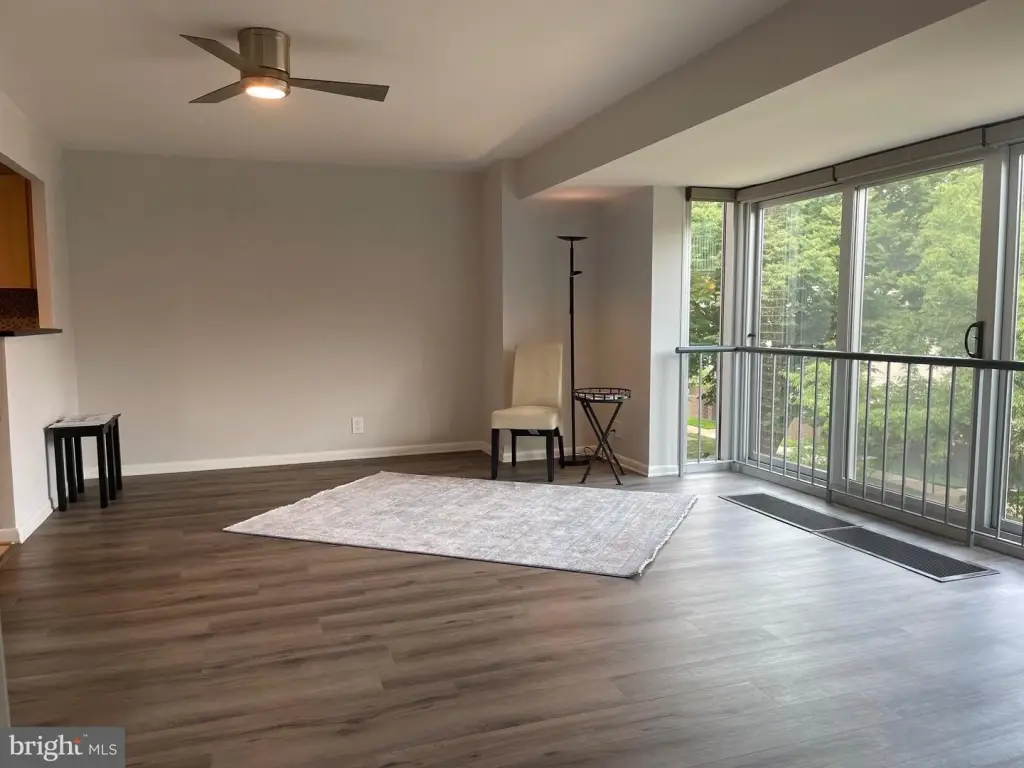
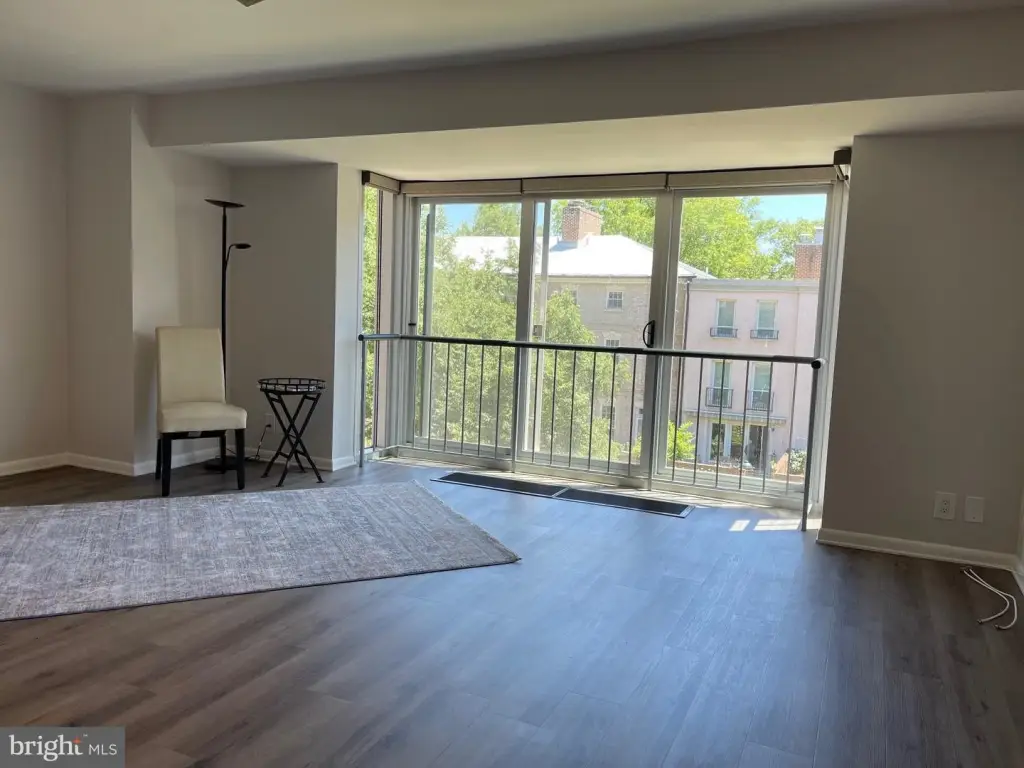
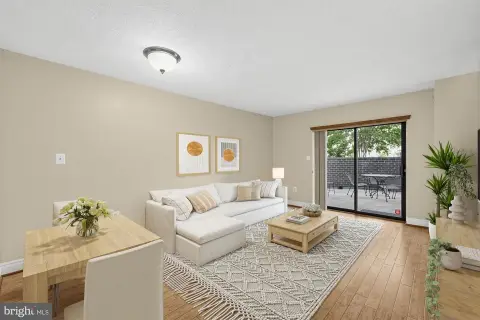
This residential income property is a 645-square-foot junior one-bedroom residence with a separate 11x10 bedroom that can remain private or open to the living room. The interior has been renovated and offers flexibility for a daytime office arrangement with a Murphy Bed.
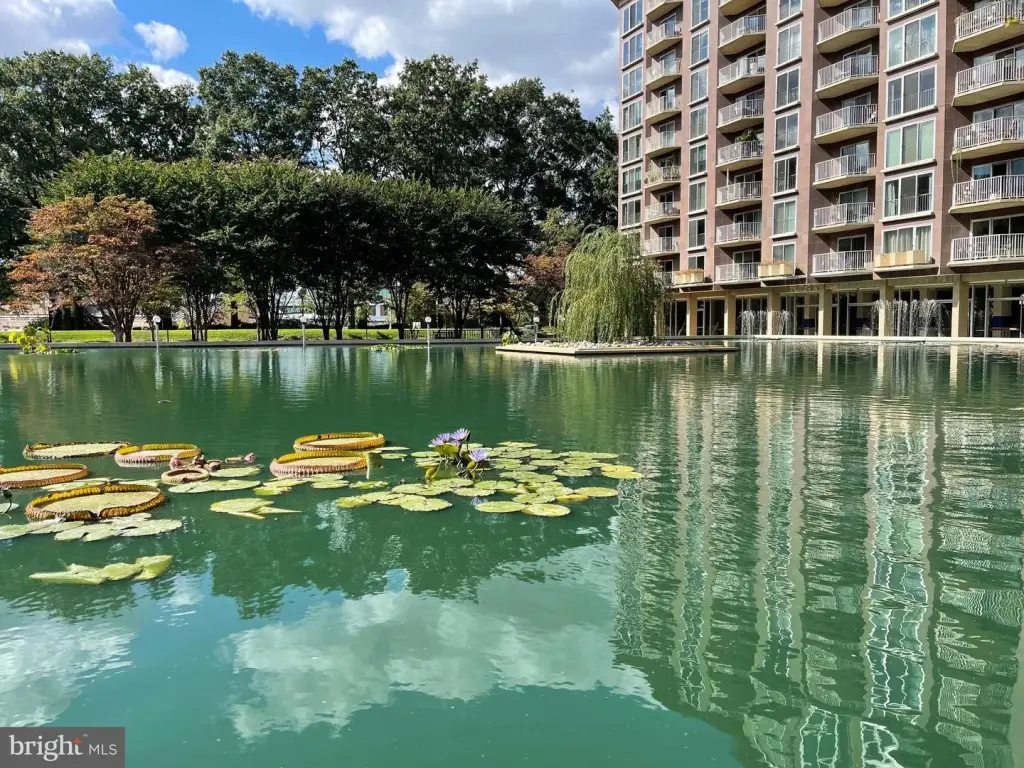
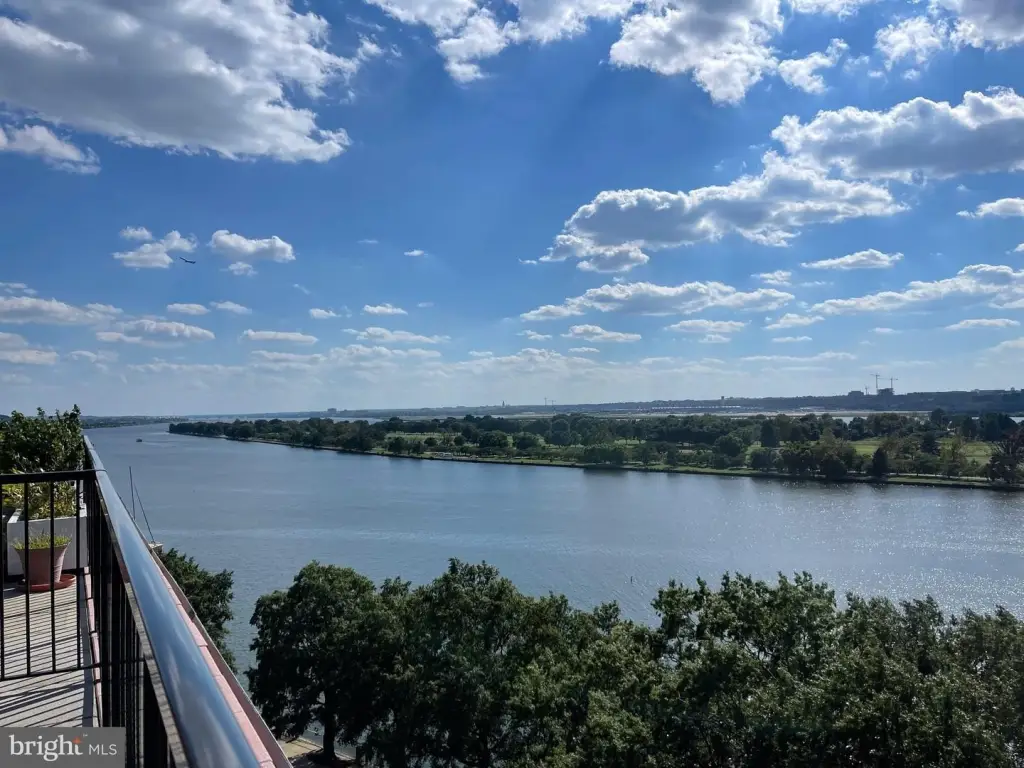
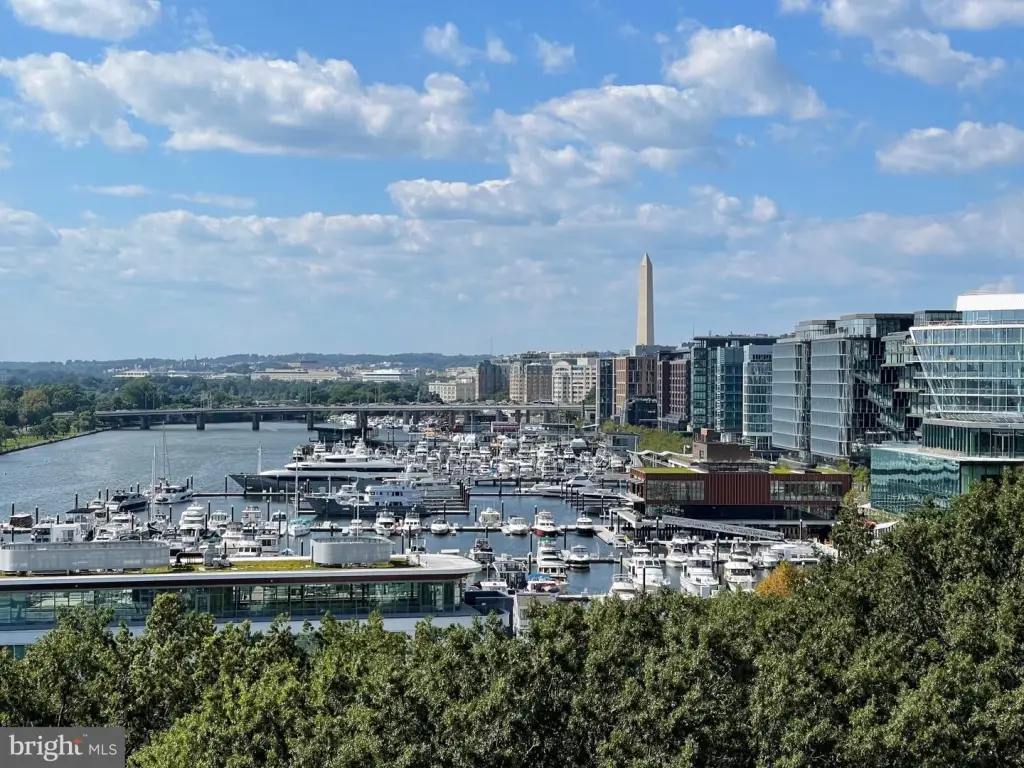
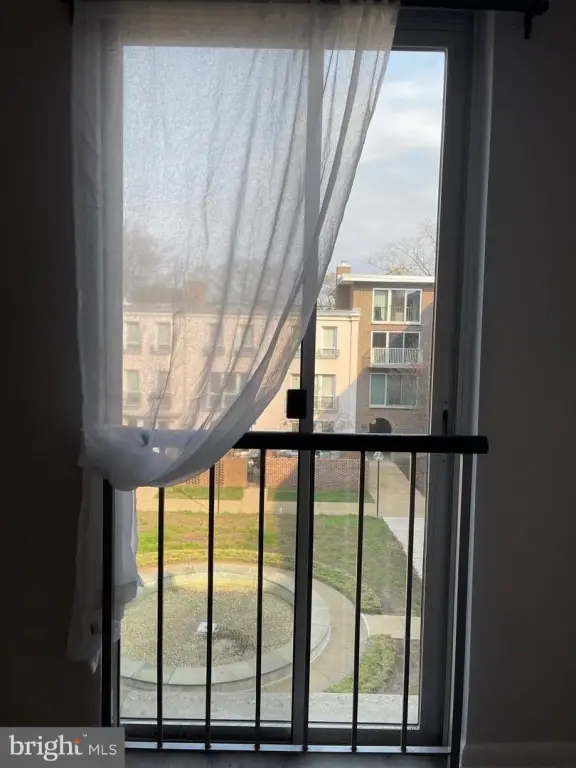
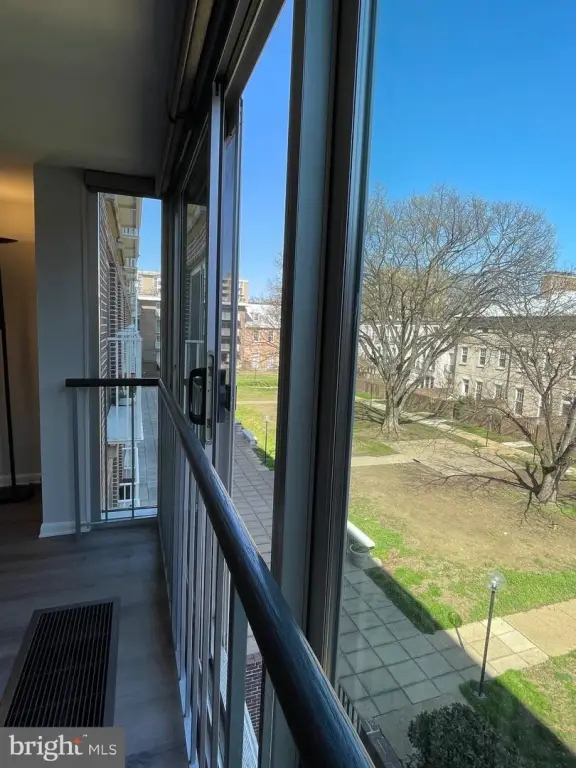
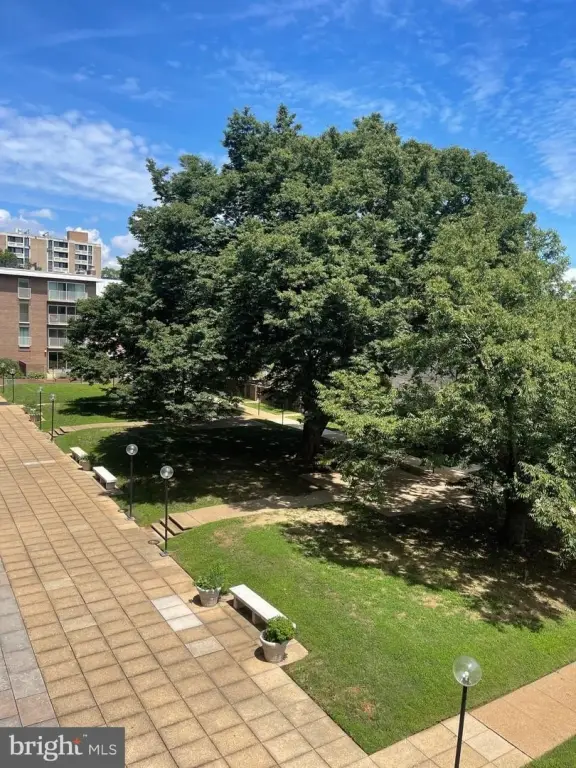
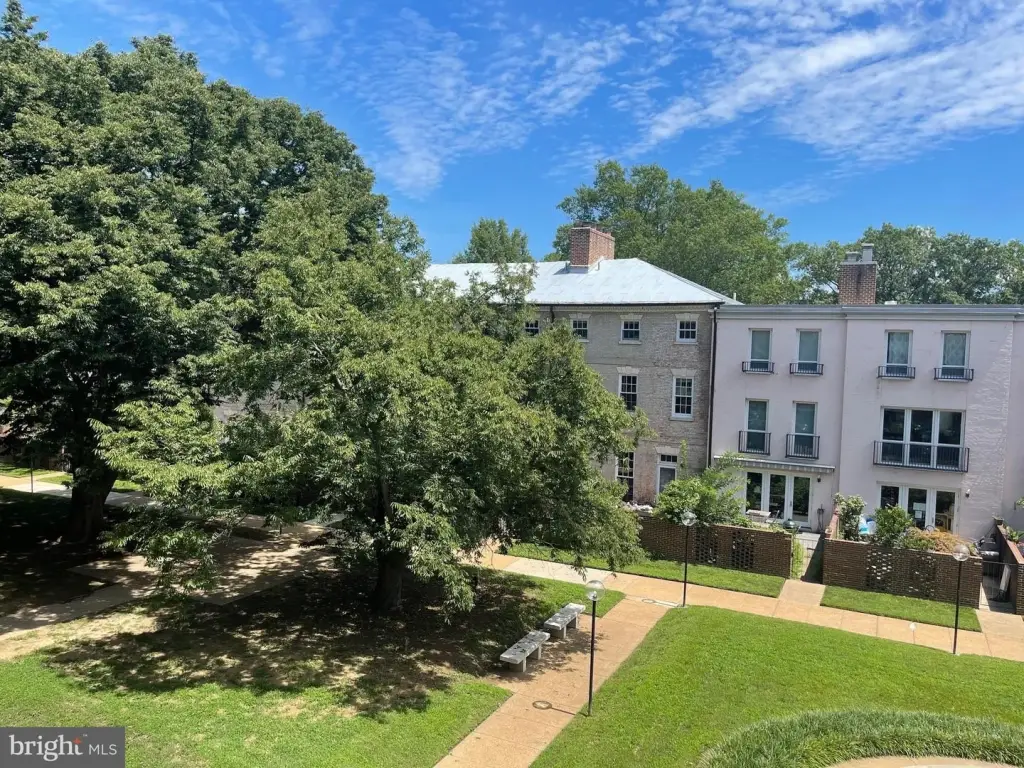
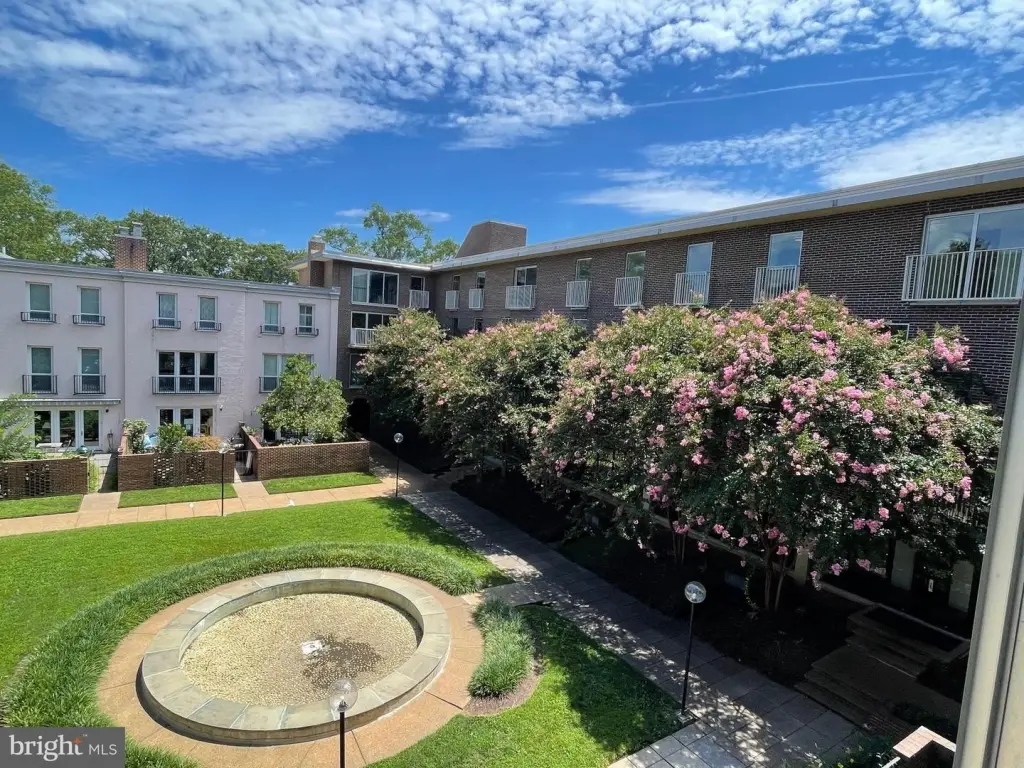
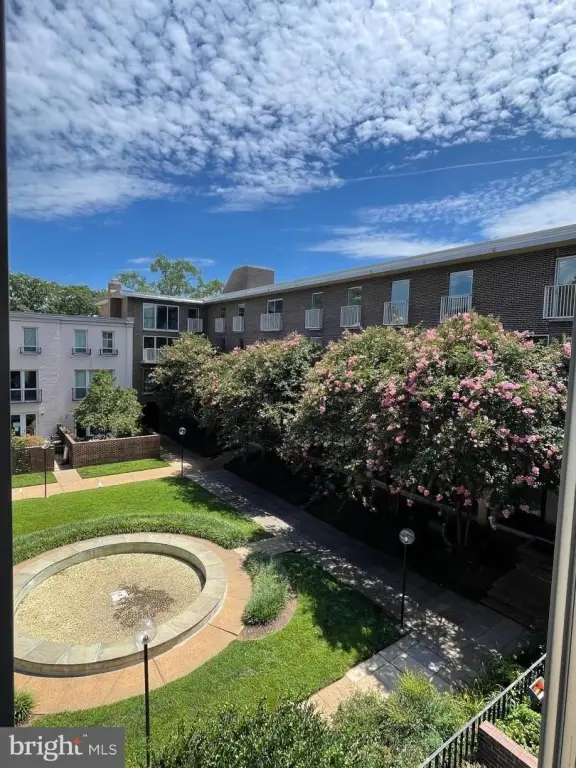
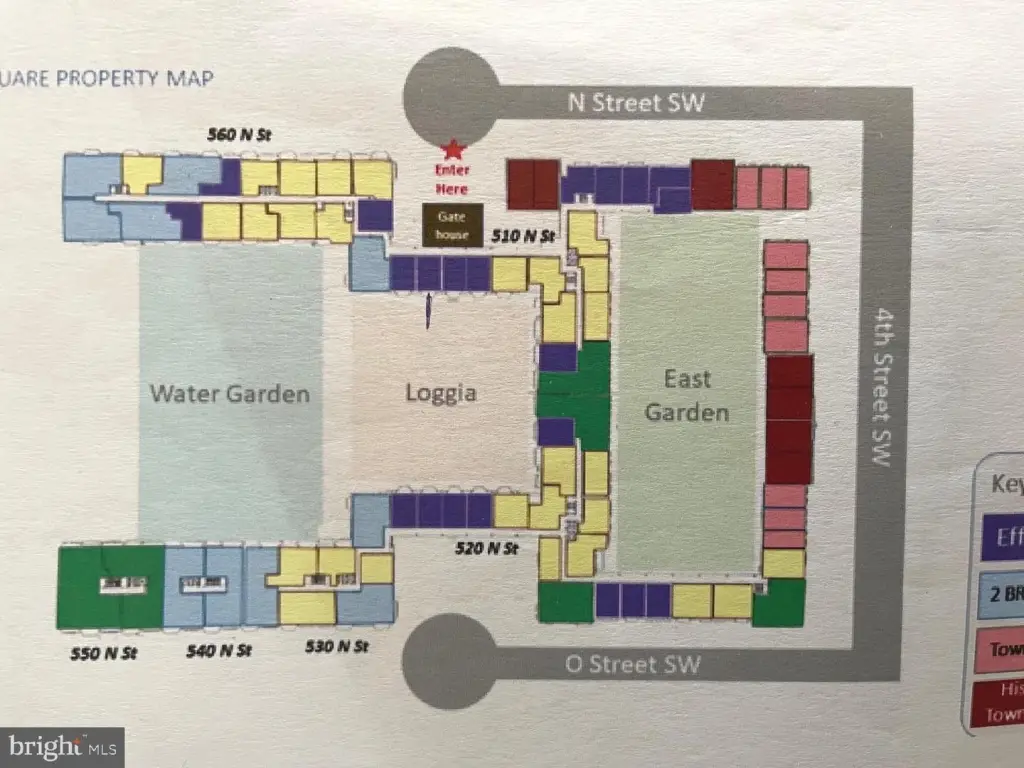
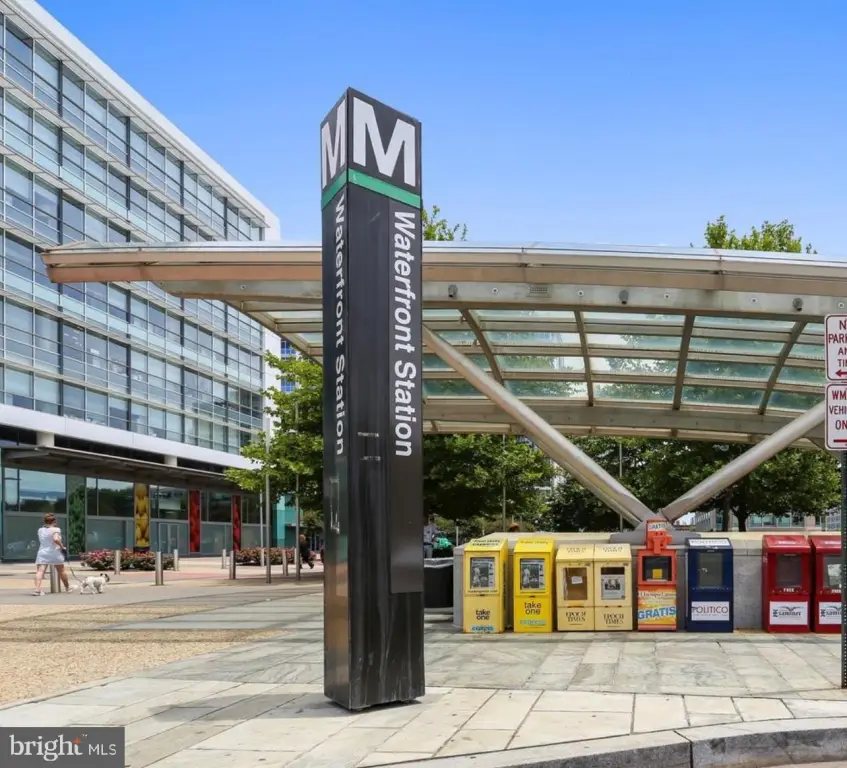
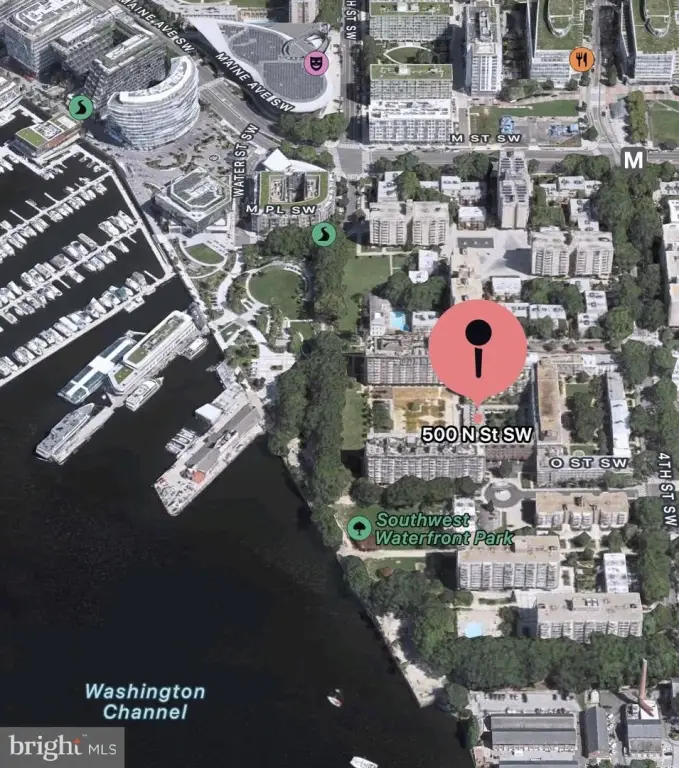
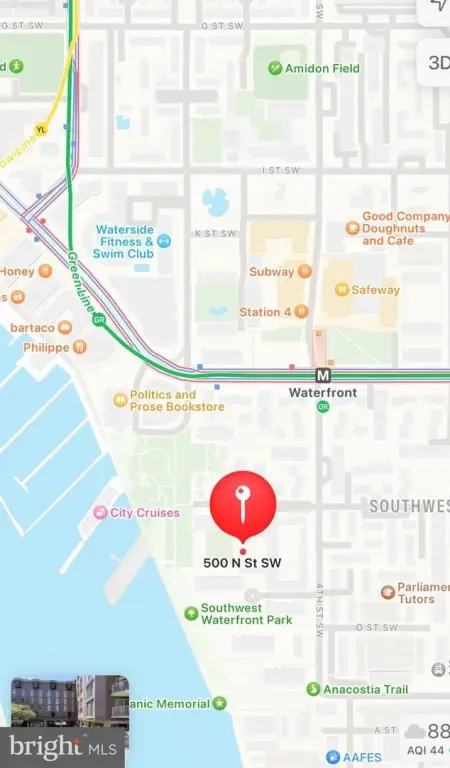
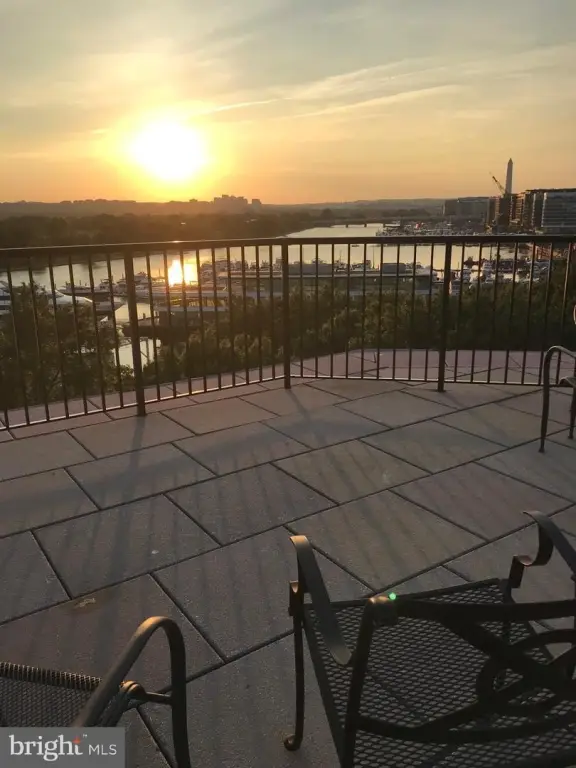
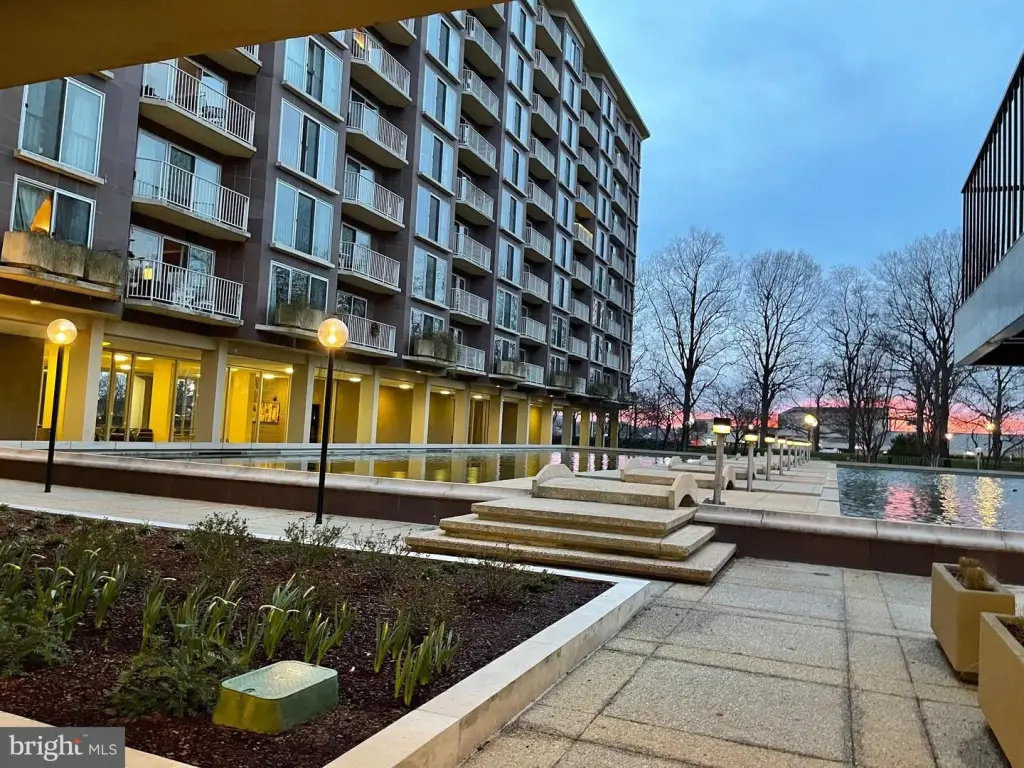
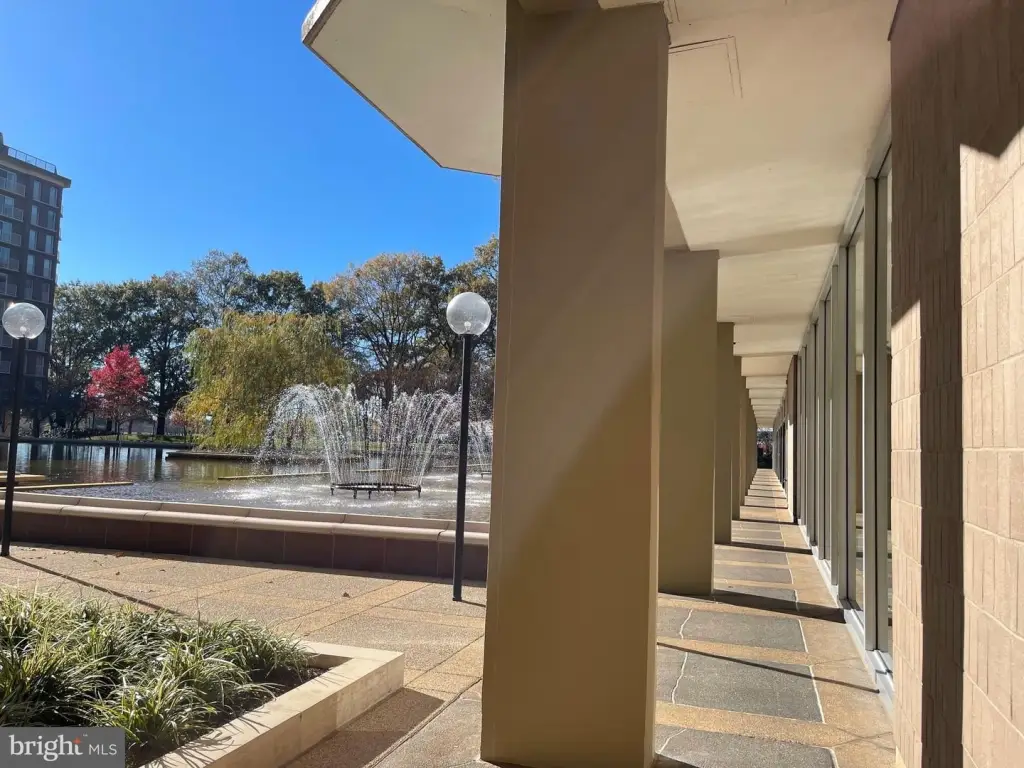
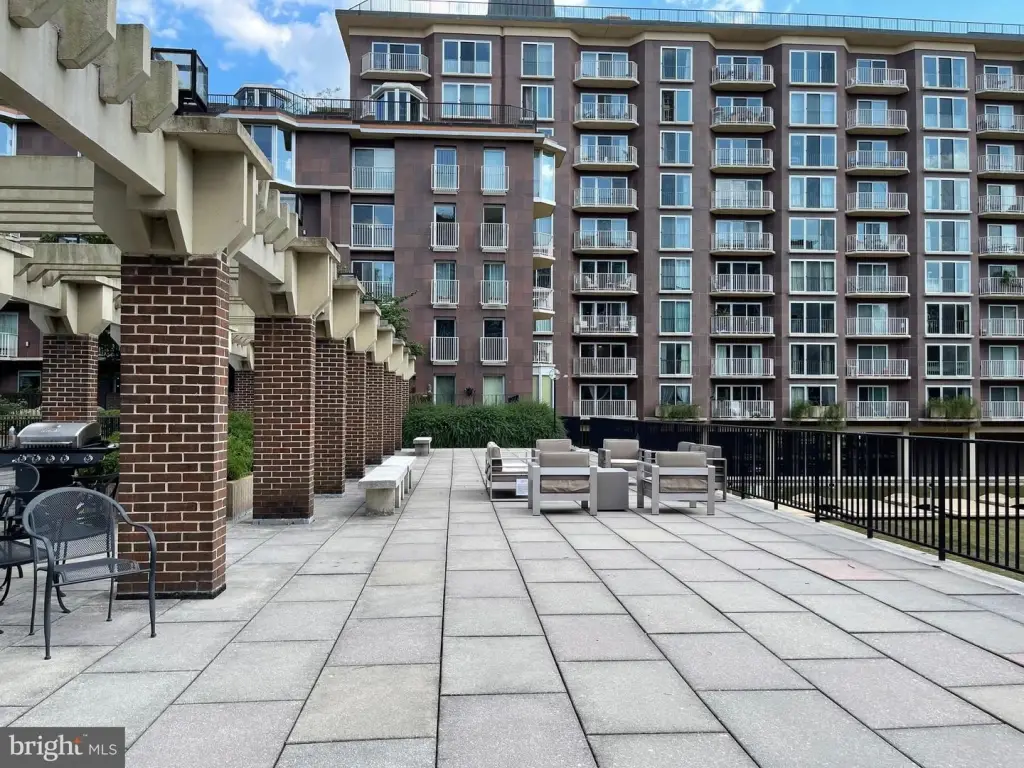
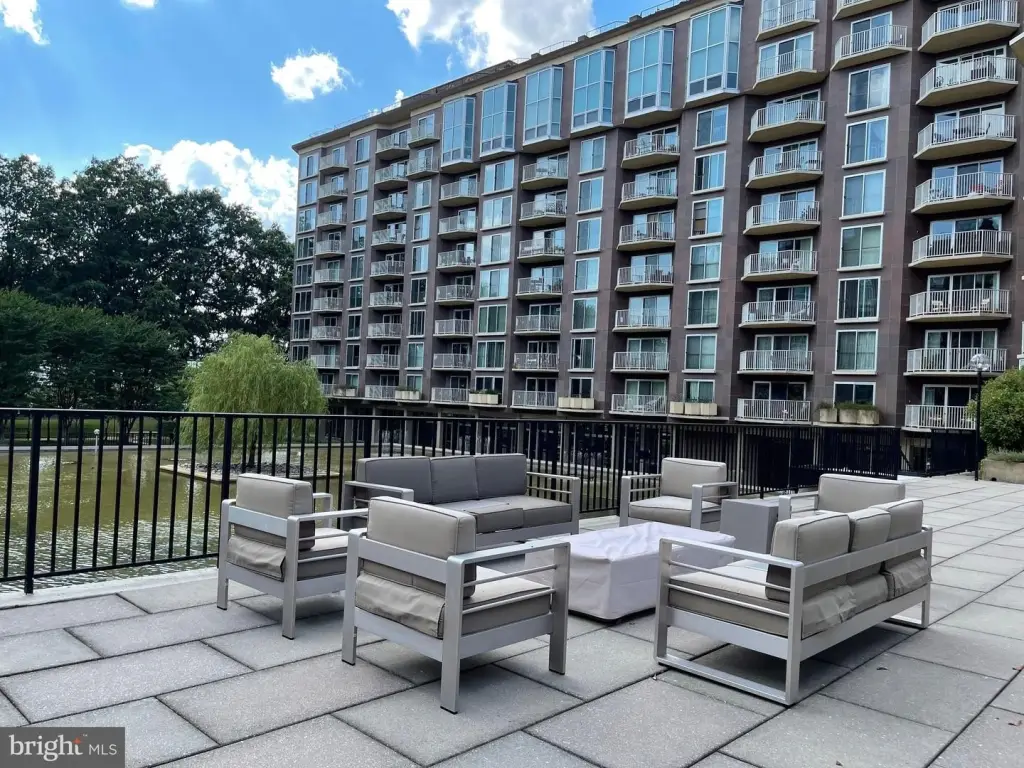
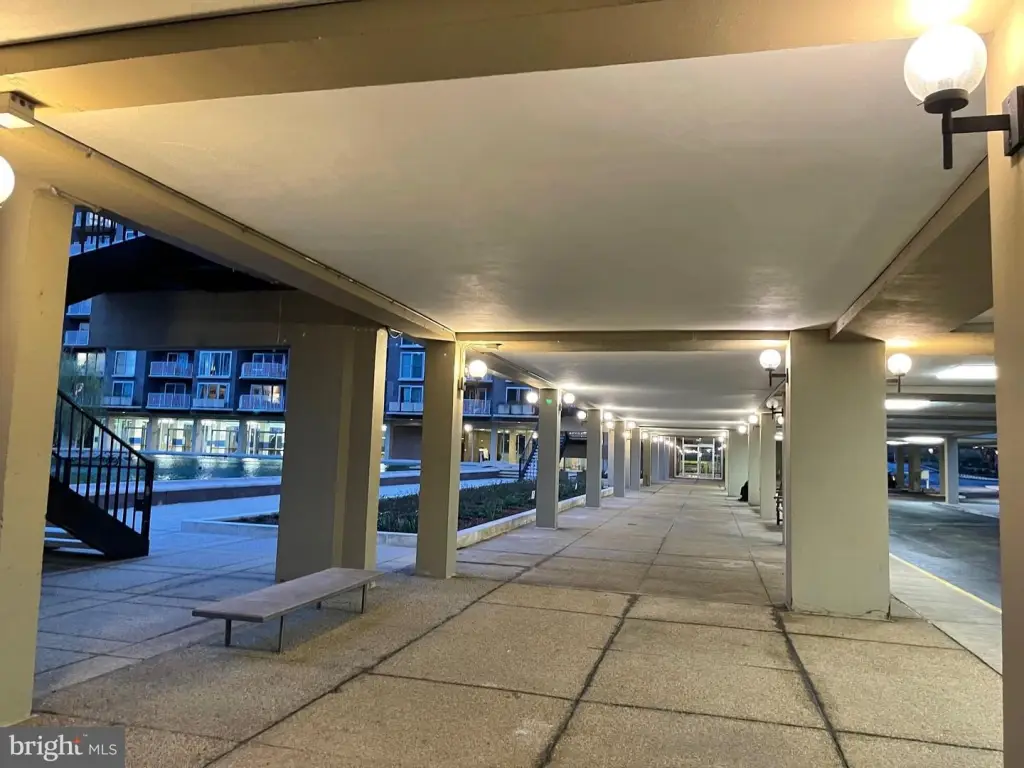
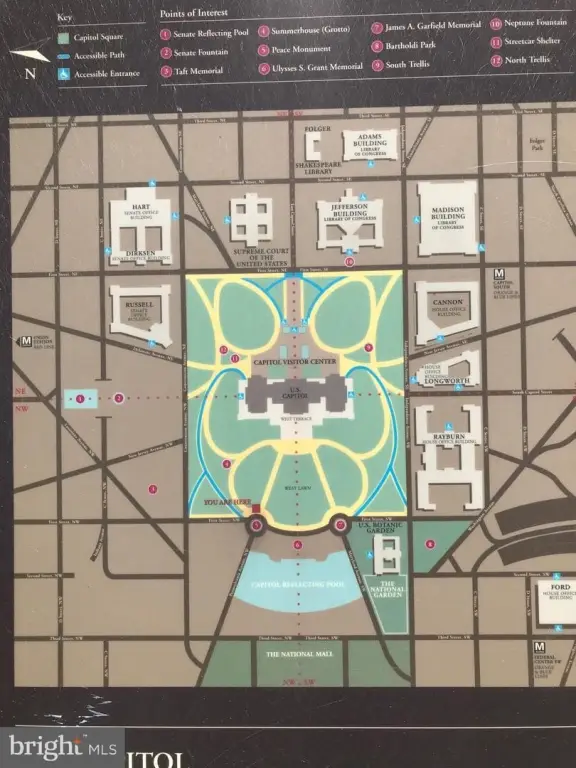
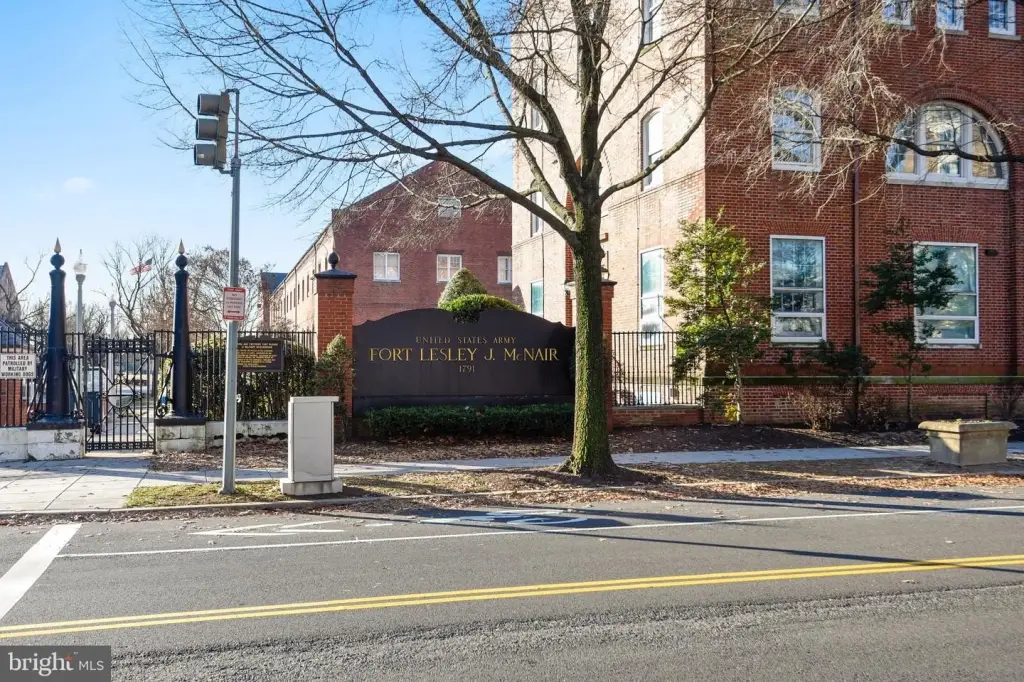
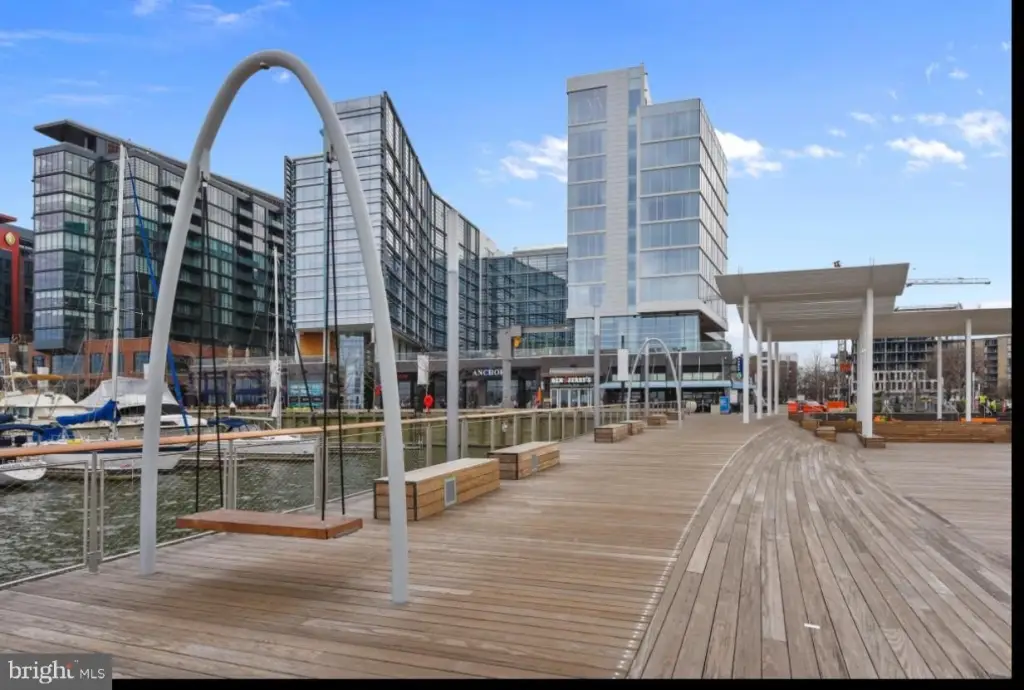
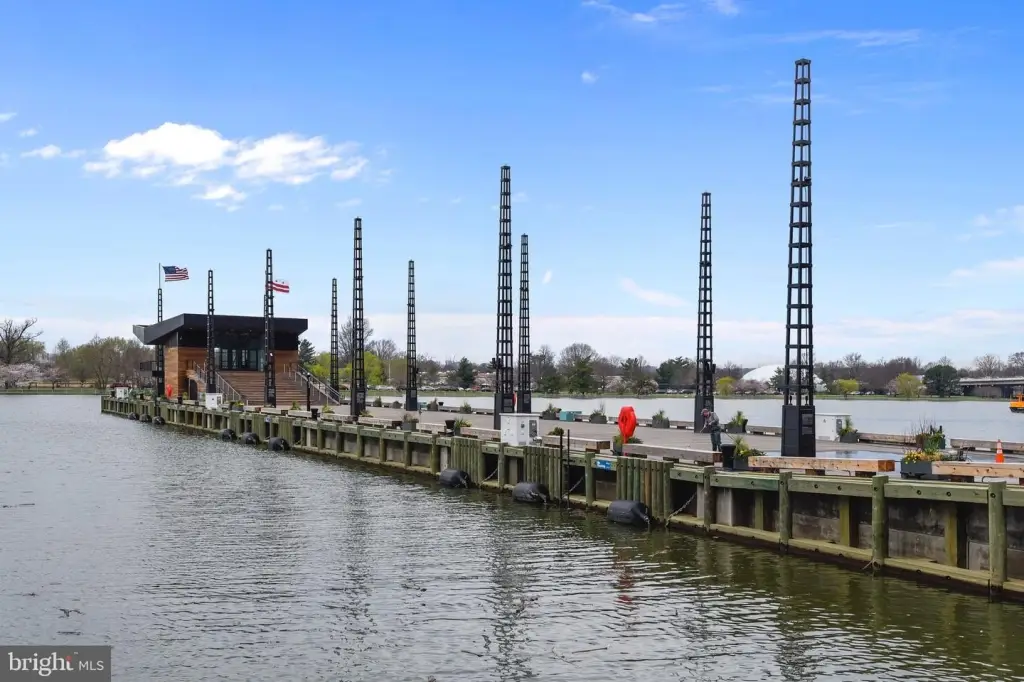
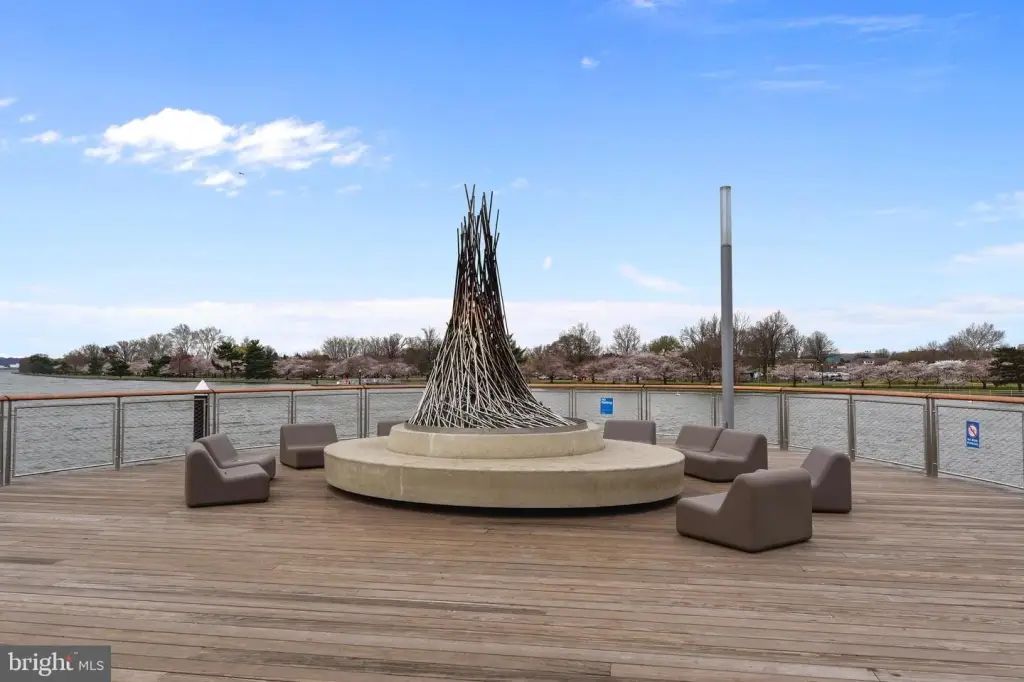
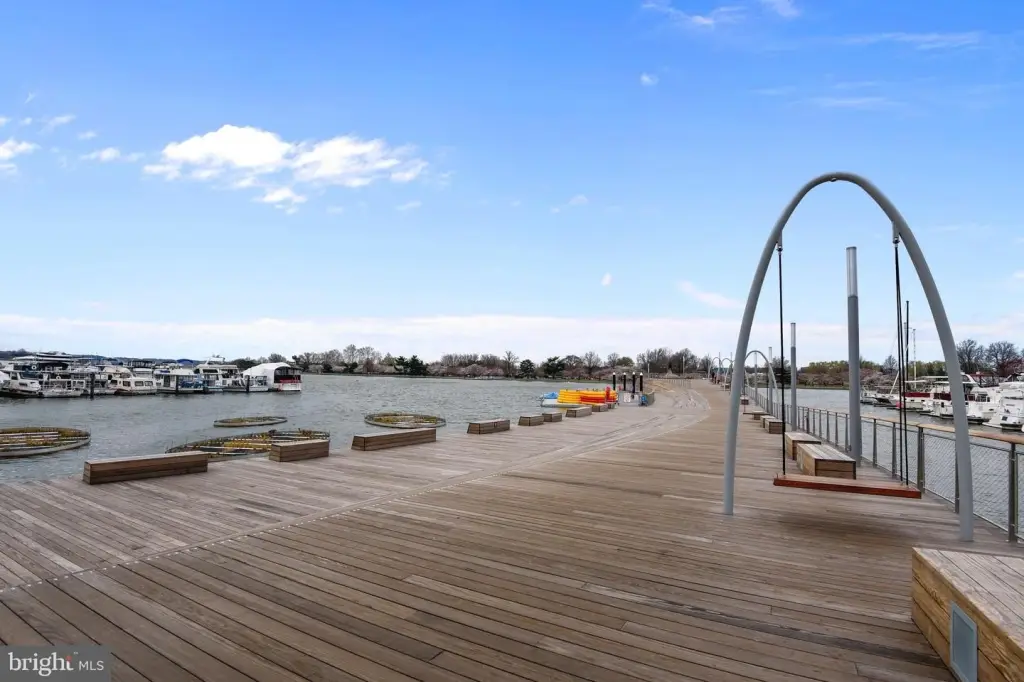
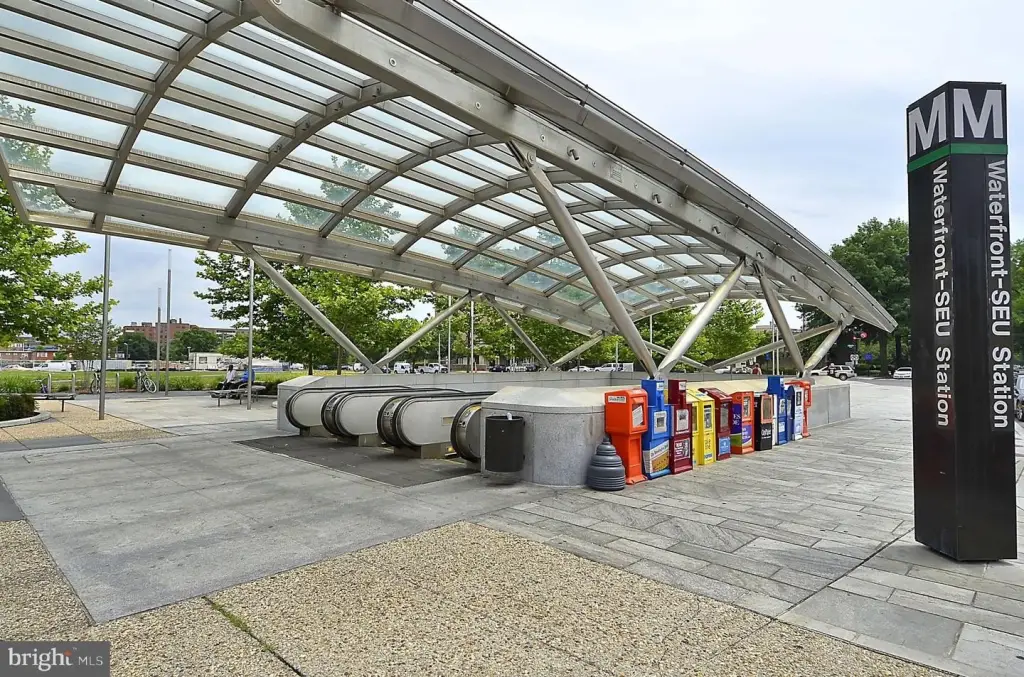
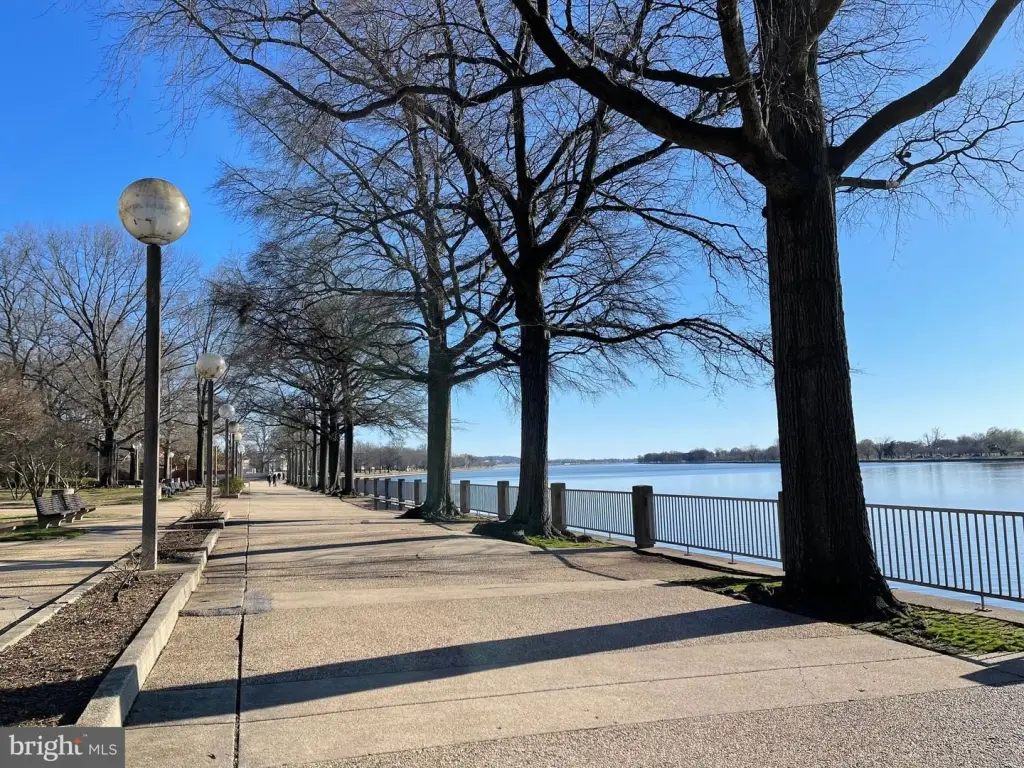
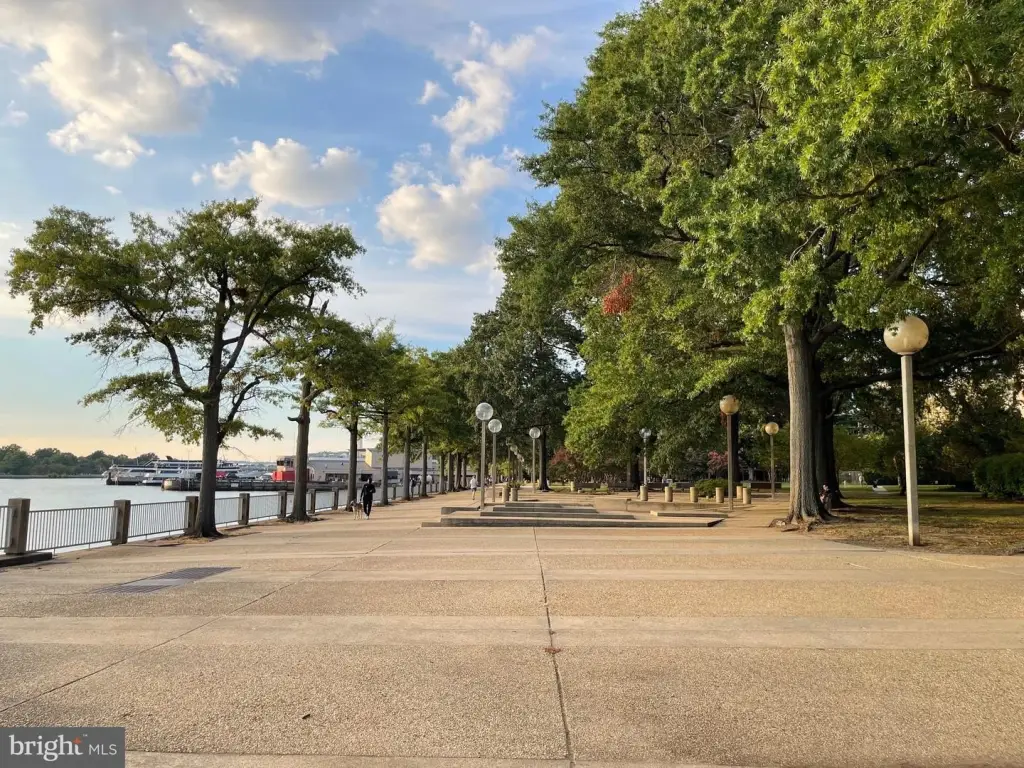
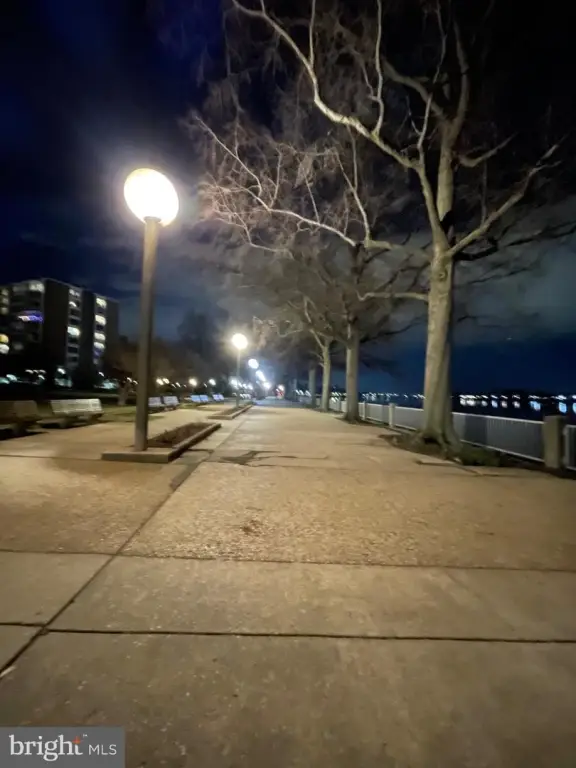
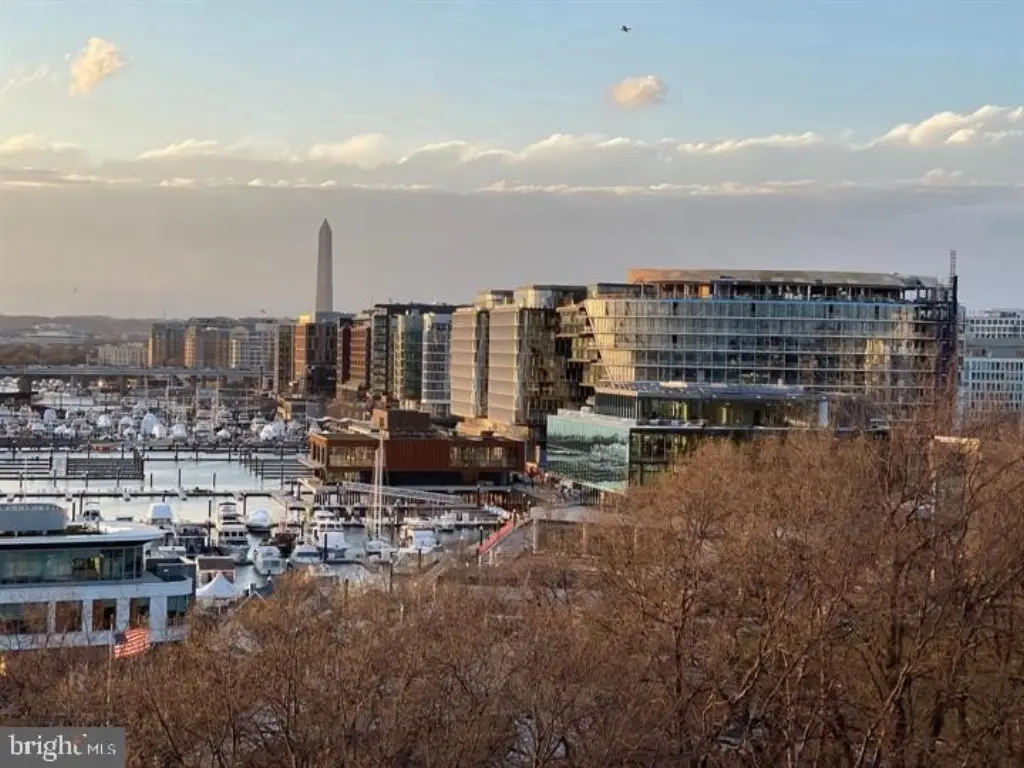
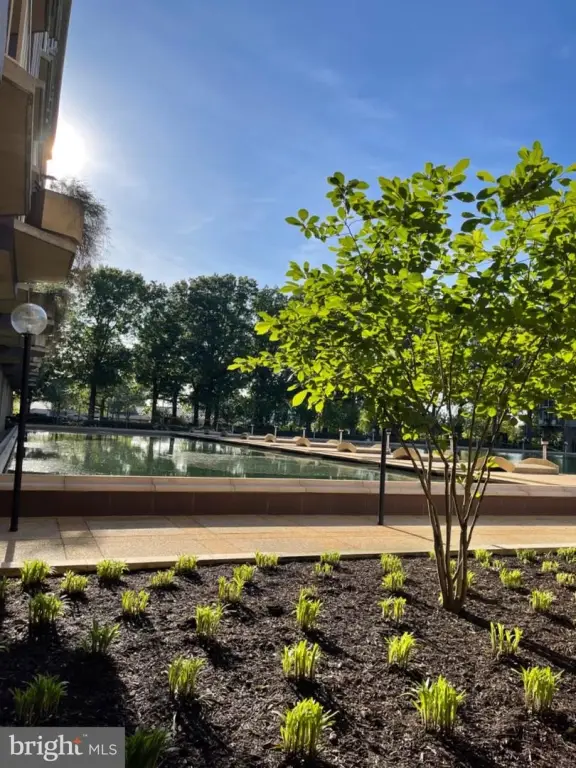
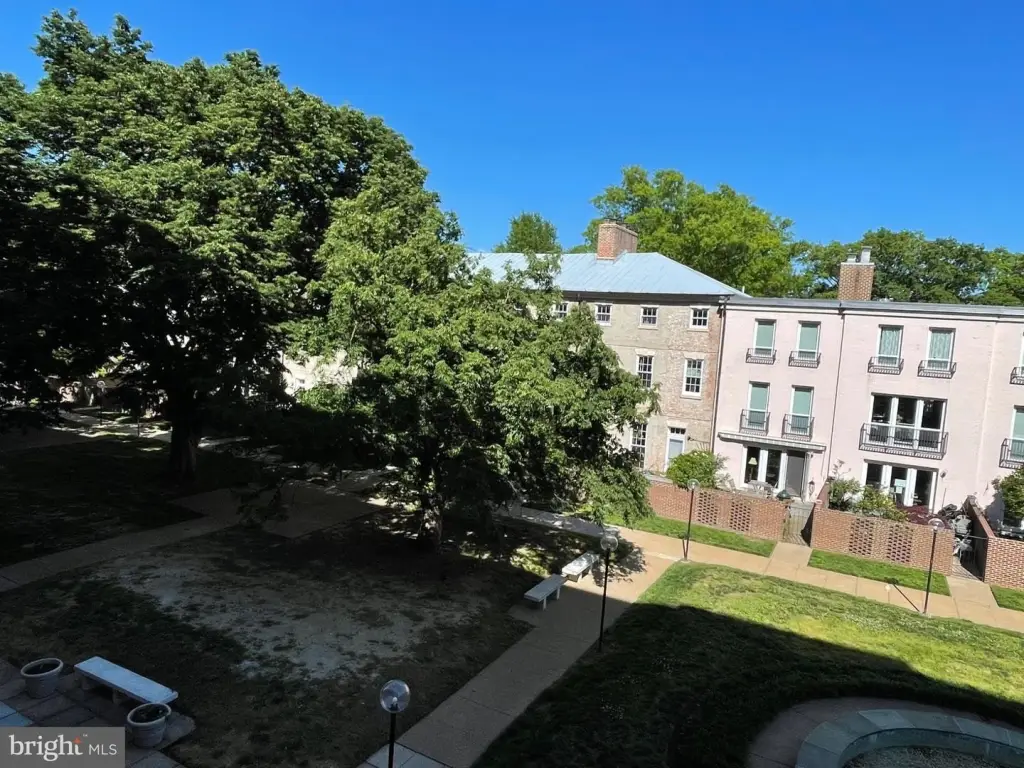
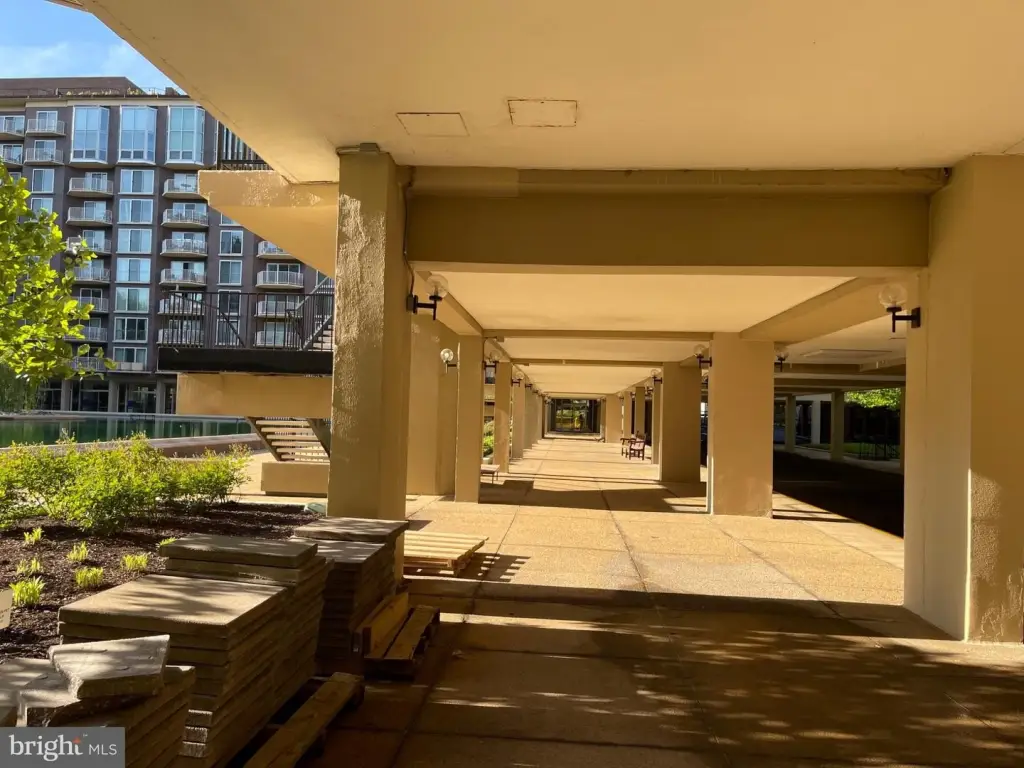
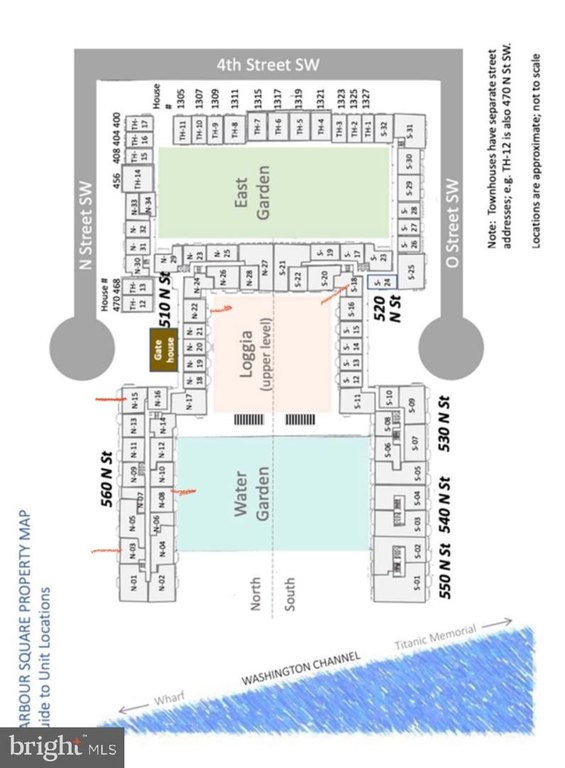
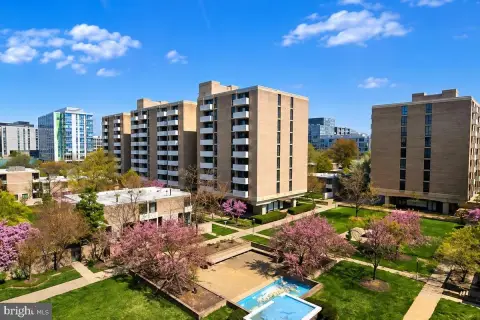
Located within Harbour Square, the property includes access to a 24/7 security gate, utilities, a glass-enclosed gym, an indoor 50 pool, outdoor seating areas, waterfront roof terrace, watergardens, guest parking, and EV chargers. The setting occupies 6 acres on the water and is adjacent to Ft McNair. The Waterfront Metro is one block away, with the Capitol building also nearby. Built in 1966.
Located within Harbour Square, the property includes access to a 24/7 security gate, utilities, a glass-enclosed gym, an indoor 50 pool, outdoor seating areas, waterfront roof terrace, watergardens, guest parking, and EV chargers. The setting occupies 6 acres on the water and is adjacent to Ft McNair. The Waterfront Metro is one block away, with the Capitol building also nearby. Built in 1966.
Key Highlights
- 645 sq. Ft junior one‑bedroom residence
- Separate private 11x10 bedroom with flexible connection to the living room
- Renovated interior with Murphy Bed option for daytime office use
Financial Insights
Estimated NOI and Cap Rate
NOI / Yr
$10,717
Cap Rate
4.66%
Suggested Prices Based on Cap Rates
Cap Rate 5%
$214,340
$214.3K
Cap Rate 7%
$153,100
$153.1K
Cap Rate 9%
$119,078
$119.1K
Market Conditions
NOI Build-Up for 645 SF
Gross rent
$20.5K $31.80/SF
− Vacancy
−$1.0K −$1.59/SF
EGI
$19.5K $30.21/SF
− OpEx
−$8.8K −$13.59/SF
NOI
$10.7K $16.62/SF
Area
Washington, DC
Vacancy
5.00%
Lease Rate
$31.80 /SF/Yr
Expense Ratio
45.00%
Simulate Cap Rate and NOI
Suggested Prices Based on Cap Rates
Cap Rate 5%
$214,340
Cap Rate 7%
$153,100
Cap Rate 9%
$119,078
Alternative Uses
Best Use
Apartment 5plus
$153.1K
$134.0K – $178.6K
NOI $10,717 @ 7.0% cap · market cap 4.66%
Second Best
—
—
no second resolved use
Theoretical Best
Office A
$331.8K
$290.3K – $387.1K
NOI $23,224 @ 7.0% cap · market cap 10.10%
Zoning and permitted uses should be independently verified with authorities.
How Realmo checks its estimates
Property Analytics
Unlock full access to Insights
Subscribe to Realmo Intelligence
Open Analytics
Current Use
Lease Details
1
Residential units
Yes
Utilities to site
Location Intelligence
Trade Area within ½ mile
1,520
Businesses Nearby
Explore this area
Business Placement
Demographics for 20024, DC
15,952
Population
11,560
Households
1.4
Avg Household Size
37
Median Age
70%
College-Educated
94%
High-School Grad
2.2 sq mi
ZIP Area
7,251
Density / Sq Mi
$102,623
Median Household Income
$94,419
Median Earnings
$2,121
Median Rent
$497,100
Median Home Value
Check the figures for this property
Cap Rate, Value Estimation, Potential NOI and more
View Realmo Analytics





Frequently Asked Questions
What type of property is this?
Residential income property - Renovated unit offers flexible separation between the bedroom and living area.
Where is this residential income property located?
The property is located at 520 N ST SW #S317 Washington, DC.
What is the asking price?
The asking price for this property is $230,000.
What are key features of this property?
This property features: 645 sq. Ft junior one‑bedroom residence; Separate private 11x10 bedroom with flexible connection to the living room; Renovated interior with Murphy Bed option for daytime office use


