Royal Oak Mixed-Use
For Sale
$499,000
520 11 Mile Rd, Royal Oak, MI
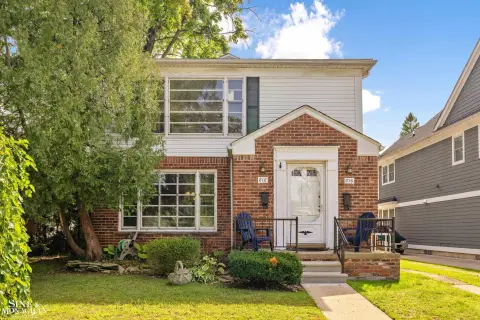
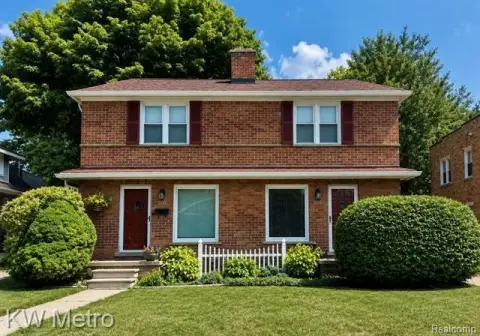
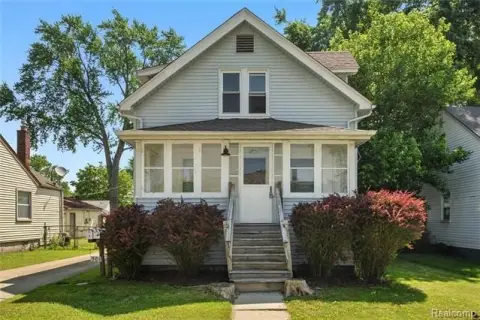
Two buildings in prime location near downtown Royal Oak.
Property Size1,954 SF
Price / SF$255.37
Days on Market242
Property Features for 520 11 Mile Rd
General Information
Standard status
Active
Size
1,954 SF
Taxes and HOA fees
Annual Taxes
$10,703
Listing Agency:
EXP Realty Birmingham
(248) 686-0024
Listed By:
Paul Mychalowych · License #6506042081
(248) 935-2754
Source:
Exprealty
Added: Feb 11
Changed: Sep 9
Last Checked: Oct 10 at 1:06AM
Displayed information is deemed reliable but is not guaranteed and should be independently verified. All listing content including descriptions, pricing, images are the copyrighted material of EXP Realty Birmingham
Investment Insights
Based on property information with market context.
Located on E 11 Mile in Royal Oak, this property is within walking distance of Downtown Royal Oak and the Royal Oak Farmers Market. The property features two separate buildings on one parcel, with approximately 10 private parking spaces in the rear. The rear building has a residential-style layout and is being prepared for short-term rental use. The property is commercially zoned, and buyers should verify permitted uses with the City of Royal Oak. One building could be used for business operations while the other is utilized for additional income or complementary use. The front building includes updated office space with granite counters, a bathroom, a newer rubber roof (2022), and a boiler (2023). It could also be used as a coffee shop with possible drive-thru window service on the east side of the building. The buildings may be separately leased or combined for a single operation. The property offers excellent visibility, walkability, and a versatile layout in a desirable Royal Oak corridor. The bike score is 69, indicating it is bikeable, and the walk score is 85, indicating it is very walkable.
Key Highlights
- Prime Royal Oak location, walk to Downtown Royal Oak & Farmers Market.
- Two separate buildings on one parcel with approximately 10 private parking spaces.
- Commercially zoned for diverse uses (buyer to verify with City of Royal Oak).
Financial Insights
Estimated NOI and Cap Rate
NOI / Yr
$19,784
Cap Rate
3.96%
Suggested Prices Based on Cap Rates
Cap Rate 5%
$395,680
$395.7K
Cap Rate 7%
$282,629
$282.6K
Cap Rate 9%
$219,822
$219.8K
Market Conditions
NOI Build-Up for 1,954 SF
Gross rent
$35.2K $18.00/SF
− Vacancy
−$3.5K −$1.80/SF
EGI
$31.7K $16.20/SF
− OpEx
−$11.9K −$6.07/SF
NOI
$19.8K $10.13/SF
Area
Oakland County, MI
Vacancy
10.00%
Lease Rate
$18.00 /SF/Yr
Expense Ratio
37.50%
Simulate Cap Rate and NOI
Suggested Prices Based on Cap Rates
Cap Rate 5%
$395,680
Cap Rate 7%
$282,629
Cap Rate 9%
$219,822
Alternative Uses
Best Use
Mixed Use
$282.6K
$247.3K – $329.7K
NOI $19,784 @ 7.0% cap · market cap 3.96%
Second Best
—
—
no second resolved use
Theoretical Best
Specialty Retail
$421.5K
$368.8K – $491.7K
NOI $29,502 @ 7.0% cap · market cap 5.91%
Zoning and permitted uses should be independently verified with authorities.
Property Analytics
Unlock full access to Insights
Subscribe to Realmo Intelligence
Open Analytics
Current Use
Location Intelligence
Trade Area within ½ mile
656
Businesses Nearby
Explore this area
Business Placement
Check the figures for this property
Cap Rate, Value Estimation, Potential NOI and more
View Realmo Analytics

Questions? Ask Rey
Realmo’s AI knows this listing — price, zoning, demand, history. Ask anything.






Frequently Asked Questions
What type of property is this?
Mixed-use property - Two buildings in prime location near downtown Royal Oak.
Where is this mixed-use property located?
The property is located at 520 11 Mile Rd Royal Oak, MI.
What is the asking price?
The asking price for this property is $499,000.
What are key features of this property?
This property features: Prime Royal Oak location, walk to Downtown Royal Oak & Farmers Market.; Two separate buildings on one parcel with approximately 10 private parking spaces.; Commercially zoned for diverse uses (buyer to verify with City of Royal Oak).