Brick Flex
For Sale
$499,900
5112 Portage St NW, North Canton, OH 44720
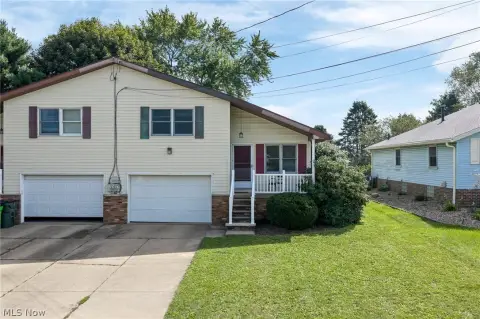
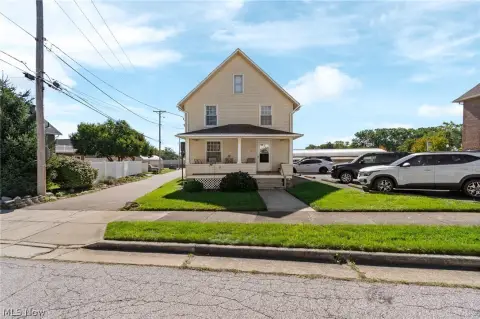
Brick commercial building combining office space with an attached garage-style warehouse area.
Property Size1,776 SF
Lot Size0.38 Acres
Price / SF$281.48
Days on Market83
Property Features for 5112 Portage St NW
General Information
Standard status
Active
Size
1,776 SF
Lot size
0.38 Acres
Zoning
Commercial
Warehouse & Industrial
Warehouse Space
816 SF
Office Build-Out
960 SF
Additional Details
Highway Access
Yes
Building Details
Year Built
1952
Buildings
1
Building Size
1,776 SF
Construction
brick
Listing Agency:
Selling Ohio LLC
Listed By:
Kyle B Oberlin
(330) 815-2198
Source:
Groganzeiger
Added: Jul 25
Changed: Oct 6
Last Checked: Oct 7 at 3:00PM
Displayed information is deemed reliable but is not guaranteed and should be independently verified. All listing content including descriptions, pricing, images are the copyrighted material of Selling Ohio LLC
Investment Insights
Based on property information with market context.
This 1952 brick flex building in North Canton includes 1,776 square feet of total space, configured with a 960-square-foot office area and an 816-square-foot warehouse garage. The property sits on a 0.38-acre commercial-zoned lot measuring approximately 51 by 242 feet.
Located at 5112 Portage St NW, the property offers access to I-77 and is situated in the Belden Village area. The building is offered for sale, and lease availability is also indicated.
Located at 5112 Portage St NW, the property offers access to I-77 and is situated in the Belden Village area. The building is offered for sale, and lease availability is also indicated.
Key Highlights
- 1,776 SF brick flex building constructed in 1952
- 960 SF office area paired with an 816 SF warehouse garage
- 0.38‑acre lot measuring approximately 51 x 242 feet
Financial Insights
Estimated NOI and Cap Rate
NOI / Yr
$21,459
Cap Rate
4.29%
Suggested Prices Based on Cap Rates
Cap Rate 5%
$429,180
$429.2K
Cap Rate 7%
$306,557
$306.6K
Cap Rate 9%
$238,433
$238.4K
Market Conditions
NOI Build-Up for 1,776 SF
Gross rent
$38.1K $21.48/SF
− Vacancy
−$9.5K −$5.37/SF
EGI
$28.6K $16.11/SF
− OpEx
−$7.2K −$4.03/SF
NOI
$21.5K $12.08/SF
Area
Stark County, OH
Vacancy
25.00%
Lease Rate
$21.48 /SF/Yr
Expense Ratio
25.00%
Simulate Cap Rate and NOI
Suggested Prices Based on Cap Rates
Cap Rate 5%
$429,180
Cap Rate 7%
$306,557
Cap Rate 9%
$238,433
Alternative Uses
Best Use
Office B
$306.6K
$268.2K – $357.7K
NOI $21,459 @ 7.0% cap · market cap 4.29%
Second Best
Warehouse
$104.1K
$91.1K – $121.4K
NOI $7,286 @ 7.0% cap · market cap 1.46%
Theoretical Best
Retail
$463.7K
$405.7K – $541.0K
NOI $32,459 @ 7.0% cap · market cap 6.49%
Zoning and permitted uses should be independently verified with authorities.
How Realmo checks its estimates
Property Analytics
Unlock full access to Insights
Subscribe to Realmo Intelligence
Open Analytics
Current Use
Lease Details
Yes
Highway access
Location Intelligence
Trade Area within ½ mile
473
Businesses Nearby
Balanced
Demand for This Use
Explore this area
Business Placement
Demographics for 44720, OH
40,744
Population
17,988
Households
2.3
Avg Household Size
43
Median Age
42%
College-Educated
97%
High-School Grad
34.3 sq mi
ZIP Area
1,188
Density / Sq Mi
$81,045
Median Household Income
$46,587
Median Earnings
$977
Median Rent
$233,800
Median Home Value
Check the figures for this property
Cap Rate, Value Estimation, Potential NOI and more
View Realmo Analytics
Market
Vacancy Rate% for Office in Midwest region

Questions? Ask Rey
Realmo’s AI knows this listing — price, zoning, demand, history. Ask anything.






Frequently Asked Questions
What type of property is this?
Flex space - Brick commercial building combining office space with an attached garage-style warehouse area.
Where is this flex space located?
The property is located at 5112 Portage St NW North Canton, OH.
What is the asking price?
The asking price for this property is $499,900.
What are key features of this property?
This property features: 1,776 SF brick flex building constructed in 1952; 960 SF office area paired with an 816 SF warehouse garage; 0.38‑acre lot measuring approximately 51 x 242 feet