18-Unit Apartment
For Sale
$1,900,000
51 SPOKANE Drive, Pontiac, MI 48341
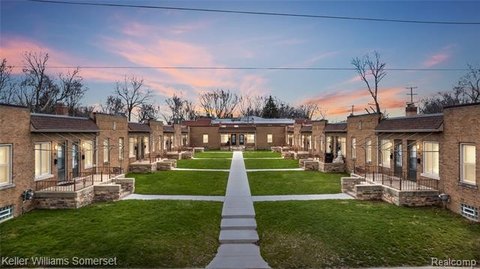
Turn-key 18-unit two-bedroom rental with most units occupied and extensive recent exterior and interior updates.
Property Size14,400 SF
Price / SF$131.94
Days on Market176
Property Features for 51 SPOKANE Drive
General Information
Standard status
Active
Size
14,400 SF
Property subtype
Multi-Family
Occupancy
94%
Additional Details
Business Included
Yes
Multifamily Units
18
Amenities
Forced Air
Natural Gas
Asphalt
Building Details
Year Built
1940
Tenancy
Multi
Listing Agency:
M77 LLC
Listed By:
James Silver · License #6502374648
(248) 417-9617
Source:
Kw
Added: Apr 3
Changed: Sep 25
Last Checked: Sep 24 at 3:55PM
Displayed information is deemed reliable but is not guaranteed and should be independently verified. All listing content including descriptions, pricing, images are the copyrighted material of M77 LLC
Investment Insights
Based on property information with market context.
This turn-key apartment property totals 18 two-bedroom units. Seventeen of the 18 units are currently occupied and tenants are reported current on rent. Each unit is described as having a private entrance and basement, with individual natural gas furnaces and separate utility setups that include individual water meters.
The complex has undergone extensive updates. A new roof was installed across the entire property in 2024 with a 20-year transferable warranty, and the exterior includes new concrete walkways in the courtyard, cultured stone on nine porches, newly shingled porch overhangs, updated front exterior doors, glass block windows in every unit, and newer gutters, trim, and exterior security lighting. The west side of the building includes a newer asphalt parking lot, and a security camera system is in place.
According to the provided information, 12 units include central air, and 10 units have newer furnaces. One master key provides access to the building for convenience. The current mortgage may be assumable for qualified buyers at 7.0% or less interest rate, and the remarks project NOI of $259,200 through rent increases on under-market units and leasing the remaining vacancy.
The complex has undergone extensive updates. A new roof was installed across the entire property in 2024 with a 20-year transferable warranty, and the exterior includes new concrete walkways in the courtyard, cultured stone on nine porches, newly shingled porch overhangs, updated front exterior doors, glass block windows in every unit, and newer gutters, trim, and exterior security lighting. The west side of the building includes a newer asphalt parking lot, and a security camera system is in place.
According to the provided information, 12 units include central air, and 10 units have newer furnaces. One master key provides access to the building for convenience. The current mortgage may be assumable for qualified buyers at 7.0% or less interest rate, and the remarks project NOI of $259,200 through rent increases on under-market units and leasing the remaining vacancy.
Key Highlights
- 18 two‑bedroom rental units averaging about $1,130/month; 17 units occupied and tenants are current on rent
- Each unit has a private entrance and basement, with individual natural gas furnaces and separate utility setups including individual water meters
- Extensive updates: 9 units renovated within the last 4 years and 16 bathrooms updated
Property Analytics
Unlock full access to Insights
Subscribe to Realmo Intelligence
Open Analytics
Current Use
Lease Details
18
Residential units
94.4%
Occupancy
Multi-tenant
Tenancy
Turnkey business
Opportunity
Location Intelligence
Trade Area within ½ mile
572
Businesses Nearby
Explore this area
Business Placement
Demographics for 48341, MI
16,980
Population
8,601
Households
2
Avg Household Size
38
Median Age
24%
College-Educated
86%
High-School Grad
6.7 sq mi
ZIP Area
2,534
Density / Sq Mi
$46,185
Median Household Income
$34,200
Median Earnings
$917
Median Rent
$124,600
Median Home Value
Check the figures for this property
Cap Rate, Value Estimation, Potential NOI and more
View Realmo Analytics
Market
Vacancy Rate% for Multifamily in Midwest region

Questions? Ask Rey
Realmo’s AI knows this listing — price, zoning, demand, history. Ask anything.





Frequently Asked Questions
What type of property is this?
Apartment building - Turn-key 18-unit two-bedroom rental with most units occupied and extensive recent exterior and interior updates.
Where is this apartment building located?
The property is located at 51 SPOKANE Drive Pontiac, MI.
What is the asking price?
The asking price for this property is $1,900,000.
What are key features of this property?
This property features: 18 two‑bedroom rental units averaging about $1,130/month; 17 units occupied and tenants are current on rent; Each unit has a private entrance and basement, with individual natural gas furnaces and separate utility setups including individual water meters; Extensive updates: 9 units renovated within the last 4 years and 16 bathrooms updated



