Unfinished Downtown Commercial
For Sale
$349,000
509 2nd St, Cedar Key, FL 32625
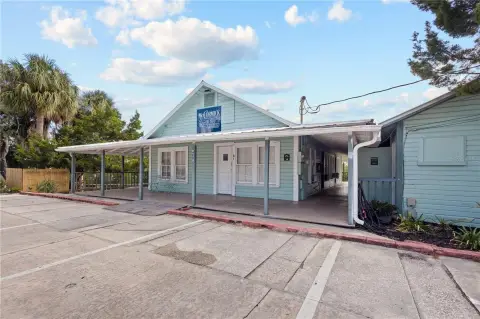
Unfinished commercial building with an open layout in downtown Cedar Key, suited to a range of retail or office concepts.
Property Size1,296 SF
Price / SF$269.29
Days on Market475
Property Features for 509 2nd St
General Information
Standard status
Active
Size
1,296 SF
Taxes and HOA fees
Annual Taxes
$3,305
Listing Agency:
Pelican Realty
(352) 543-5581
Listed By:
Caryn Stephenson · License #BK3232198
(352) 228-0420
Source:
Exprealty
Added: Jun 24, 2025
Changed: Oct 2
Last Checked: Oct 11 at 9:02AM
Displayed information is deemed reliable but is not guaranteed and should be independently verified. All listing content including descriptions, pricing, images are the copyrighted material of Pelican Realty
Investment Insights
Based on property information with market context.
This unfinished commercial building offers an open interior layout ready for tenant or buyer improvements. The property is described as a historic structure and presents a broad, flexible canvas for conversion into a variety of commercial uses.
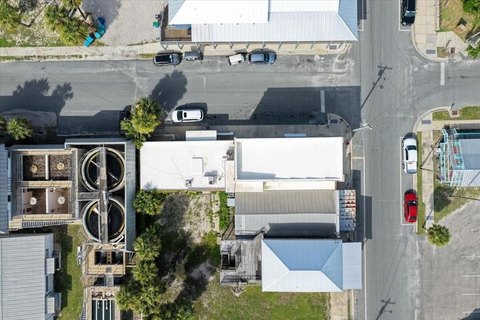
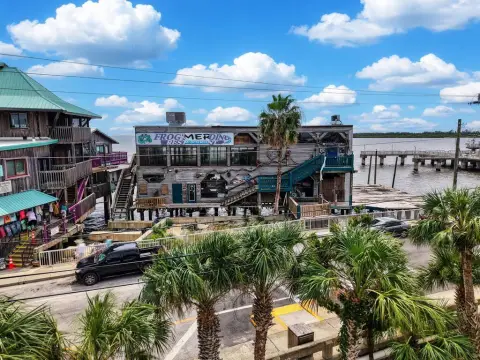
The building is located in downtown Cedar Key, with access to the town’s restaurant and shopping district along “Main Street,” supporting high walkable activity in the immediate area.
With its unfinished condition and open configuration, the space may be adapted to a professional office, retail, or personal services concept based on the needs of the eventual occupant.
The building is located in downtown Cedar Key, with access to the town’s restaurant and shopping district along “Main Street,” supporting high walkable activity in the immediate area.
With its unfinished condition and open configuration, the space may be adapted to a professional office, retail, or personal services concept based on the needs of the eventual occupant.
Key Highlights
- Unfinished commercial building in downtown Cedar Key, FL
- Year built: 1901
- Open layout suited for retail or office concepts
Financial Insights
Estimated NOI and Cap Rate
NOI / Yr
$16,166
Cap Rate
4.63%
Suggested Prices Based on Cap Rates
Cap Rate 5%
$323,320
$323.3K
Cap Rate 7%
$230,943
$230.9K
Cap Rate 9%
$179,622
$179.6K
Market Conditions
NOI Build-Up for 1,296 SF
Gross rent
$25.7K $19.80/SF
− Vacancy
−$4.1K −$3.17/SF
EGI
$21.6K $16.63/SF
− OpEx
−$5.4K −$4.16/SF
NOI
$16.2K $12.47/SF
Area
Levy County, FL
Vacancy
16.00%
Lease Rate
$19.80 /SF/Yr
Expense Ratio
25.00%
Simulate Cap Rate and NOI
Suggested Prices Based on Cap Rates
Cap Rate 5%
$323,320
Cap Rate 7%
$230,943
Cap Rate 9%
$179,622
Alternative Uses
Best Use
Office B
$230.9K
$202.1K – $269.4K
NOI $16,166 @ 7.0% cap · market cap 4.63%
Second Best
Retail
$196.3K
$171.8K – $229.0K
NOI $13,741 @ 7.0% cap · market cap 3.94%
Theoretical Best
Office A
$321.0K
$280.9K – $374.5K
NOI $22,470 @ 7.0% cap · market cap 6.44%
Zoning and permitted uses should be independently verified with authorities.
Property Analytics
Unlock full access to Insights
Subscribe to Realmo Intelligence
Open Analytics
Current Use
Location Intelligence
Trade Area within ½ mile
233
Businesses Nearby
Explore this area
Business Placement
Demographics for 32625, FL
1,620
Population
1,262
Households
1.3
Avg Household Size
59
Median Age
40%
College-Educated
92%
High-School Grad
94.0 sq mi
ZIP Area
17
Density / Sq Mi
$59,036
Median Household Income
$50,729
Median Earnings
$918
Median Rent
$267,200
Median Home Value
Check the figures for this property
Cap Rate, Value Estimation, Potential NOI and more
View Realmo Analytics
Market
Vacancy Rate% for Office in South region

Questions? Ask Rey
Realmo’s AI knows this listing — price, zoning, demand, history. Ask anything.

Frequently Asked Questions
What type of property is this?
Office units - Unfinished commercial building with an open layout in downtown Cedar Key, suited to a range of retail or office concepts.
Where is this office units located?
The property is located at 509 2nd St Cedar Key, FL.
What is the asking price?
The asking price for this property is $349,000.
What are key features of this property?
This property features: Unfinished commercial building in downtown Cedar Key, FL; Year built: 1901; Open layout suited for retail or office concepts


