Charming Ithaca Multi-Family
For Sale
$549,000
Pending
505 E Seneca Street, Ithaca, NY 14850
MultiFamily, Ithaca, NY
Property Size4,045 SF
Lot Size0.19 Acres
Days on Market140
Property Features for 505 E Seneca Street
General Information
Property type
Residential Multi Family
Property subtype
Other
Bedrooms
6
Rooms
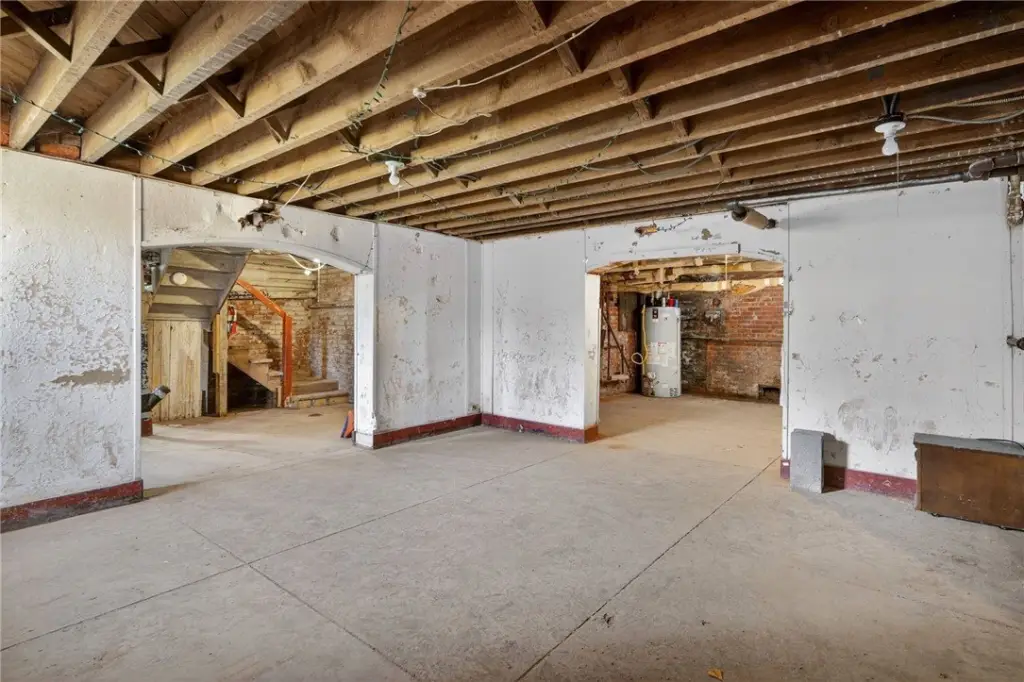
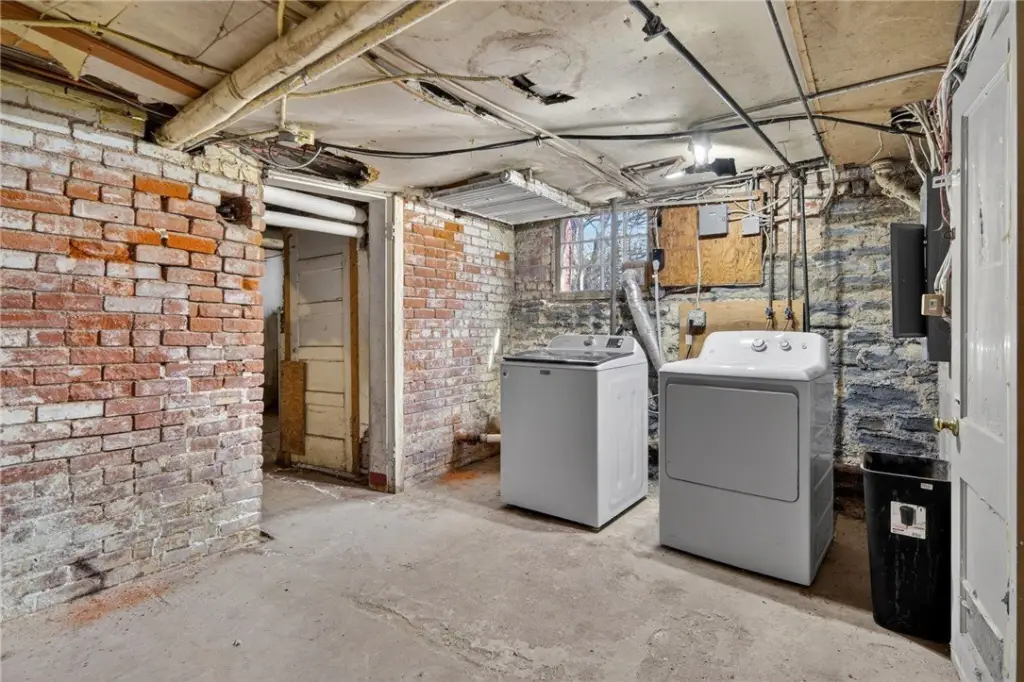
Bedroom 3, Bedroom 1, Bedroom 2, Bedroom 6, Bedroom 4, Basement, Bedroom 5
Parking features
Garage
Security features
Security
Window features
Skylight(s)
Patio and Porch features
Patio
Interior features
Skylights, NaturalWoodwork
Exterior features
BlacktopDriveway, Patio
Appliances
ExhaustFan, ElectricOven, ElectricRange, GasWaterHeater, Refrigerator, RangeHood
Lot features
Near Public Transit, Rectangular, Rectangular Lot, Residential Lot
Elementary school
Belle Sherman
Elementary school district
Ithaca
Middle school district
Ithaca
High school district
Ithaca
Subdivision
Ithaca-City-500700
Standard status
Pending
APN
500700-069-000-0003-002-000-0000
Size
4,045 SF
Lot size
0.19 Acres
Taxes and HOA fees
Tax Annual Amount
13552
Utilities
Heating system
Steam, Natural Gas
Water source
Public
Building Details
Year built
1886
Floors in Building
3
Number of units
1
Flooring type
Varies, Hardwood, Carpet, Vinyl
Building materials
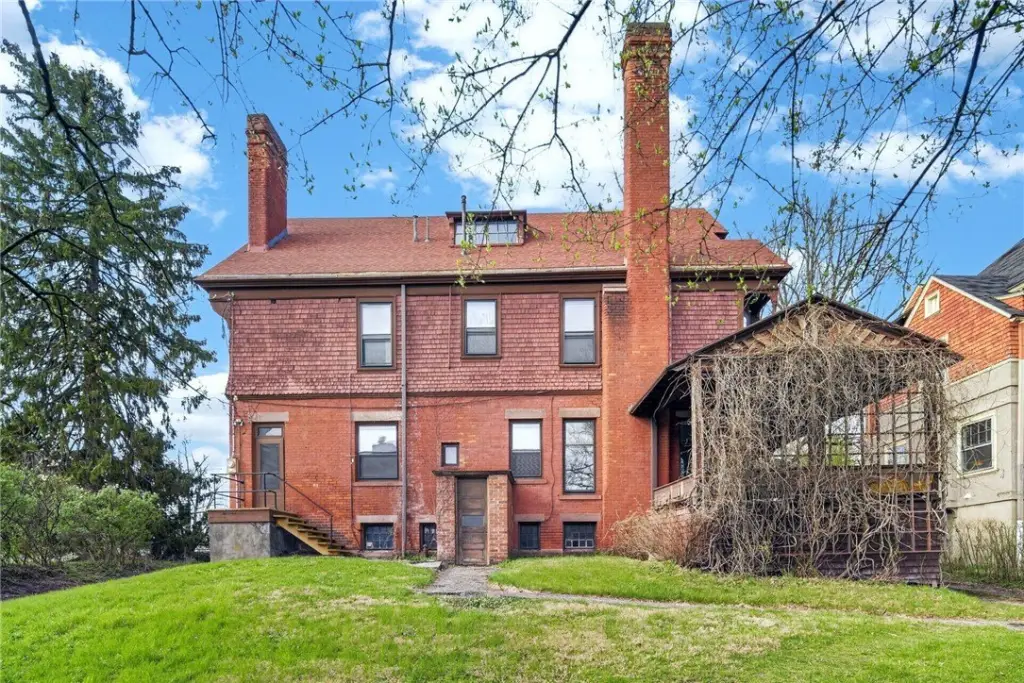
Brick, WoodSiding, CopperPlumbing
Listing Agency:
Warren Real Estate of Ithaca Inc.
(607) 257-0666
Listed By:
Jill Burlington · License #30BU0950986
(607) 592-0474
Added: May 21
Changed: Sep 16
Last Checked: Oct 7 at 1:06PM
MLS# R1675740
Copyright © 2026 New York State Alliance of MLSs, LLC. All rights reserved. All information provided by the listing agent/broker is deemed reliable but is not guaranteed and should be independently verified.
Investment Insights
Based on property information with market context.
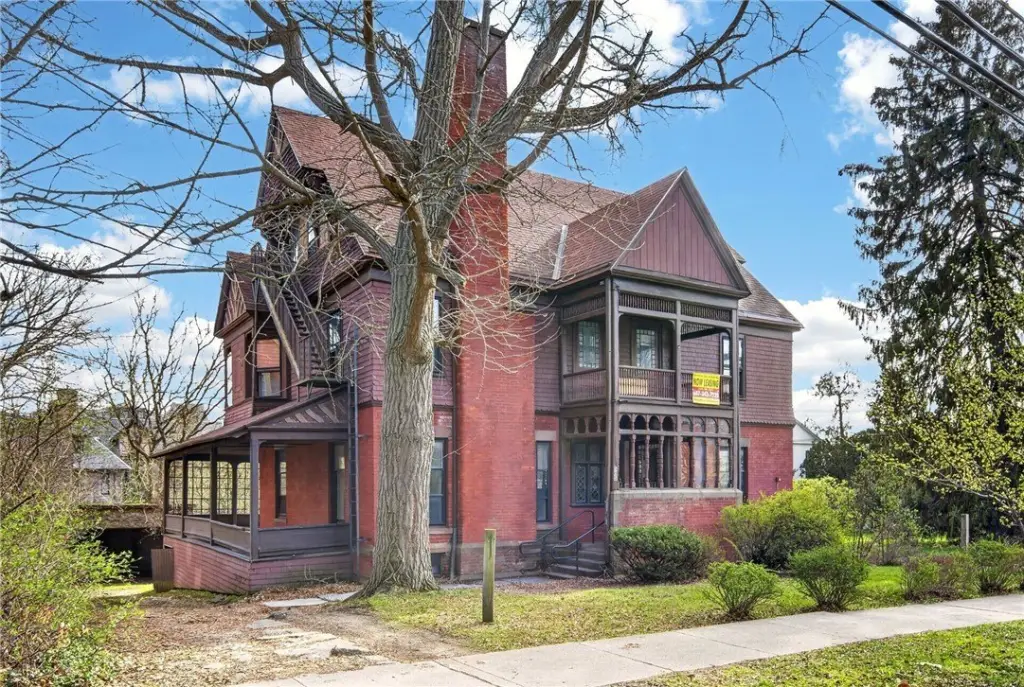
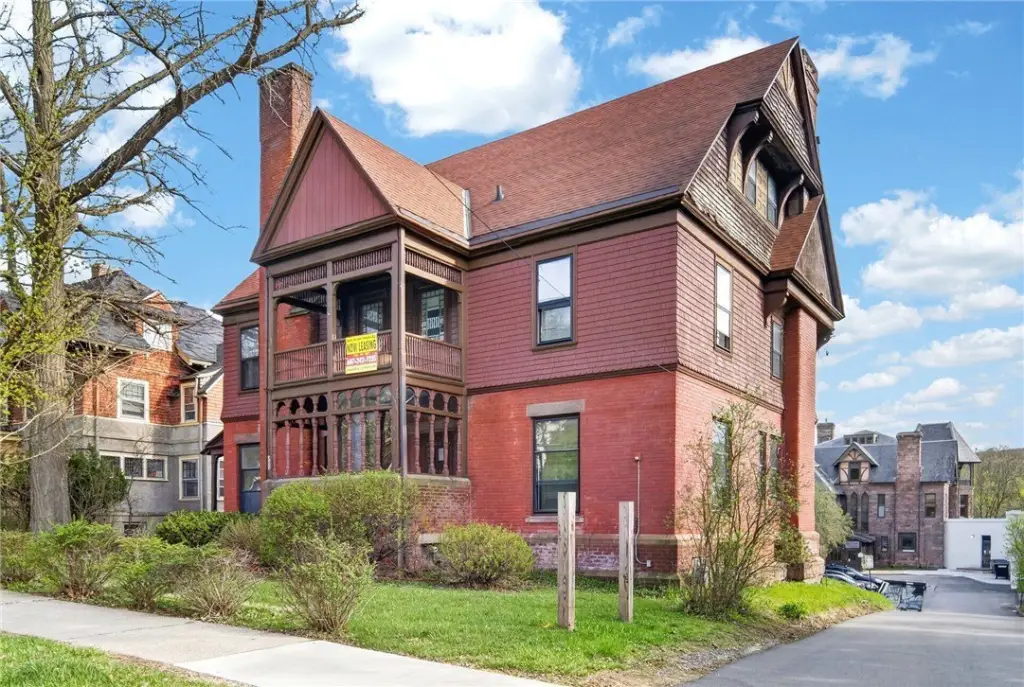
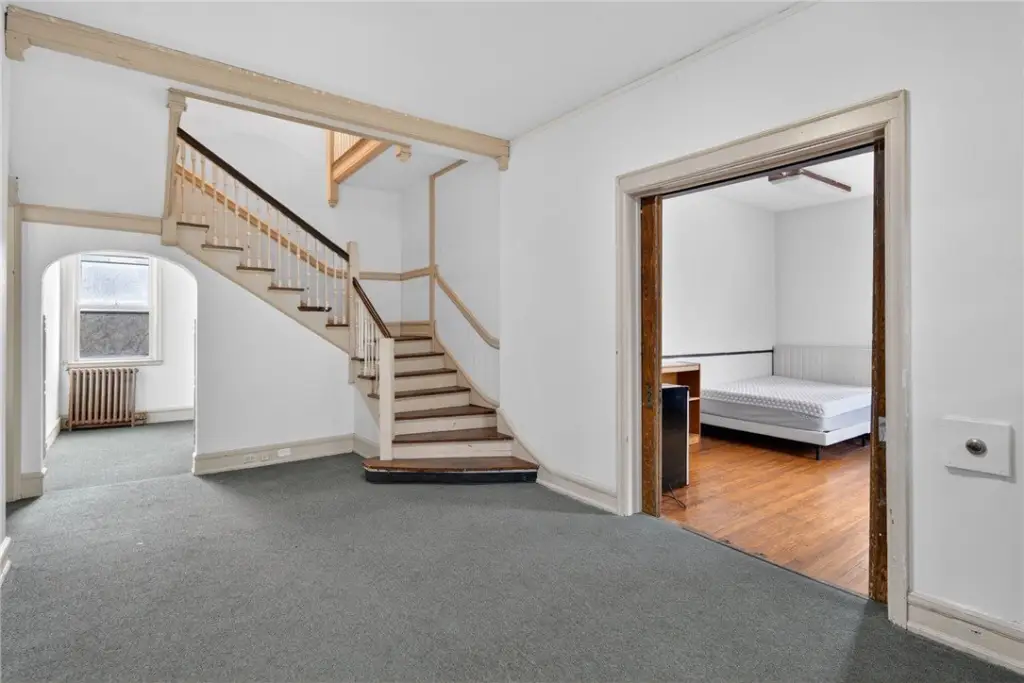
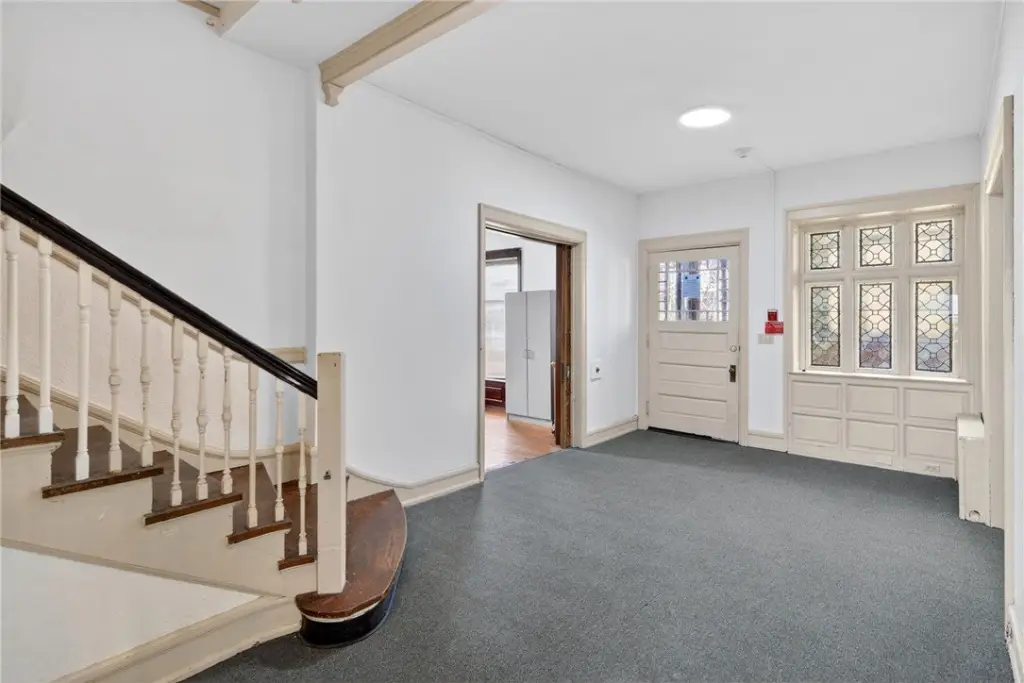
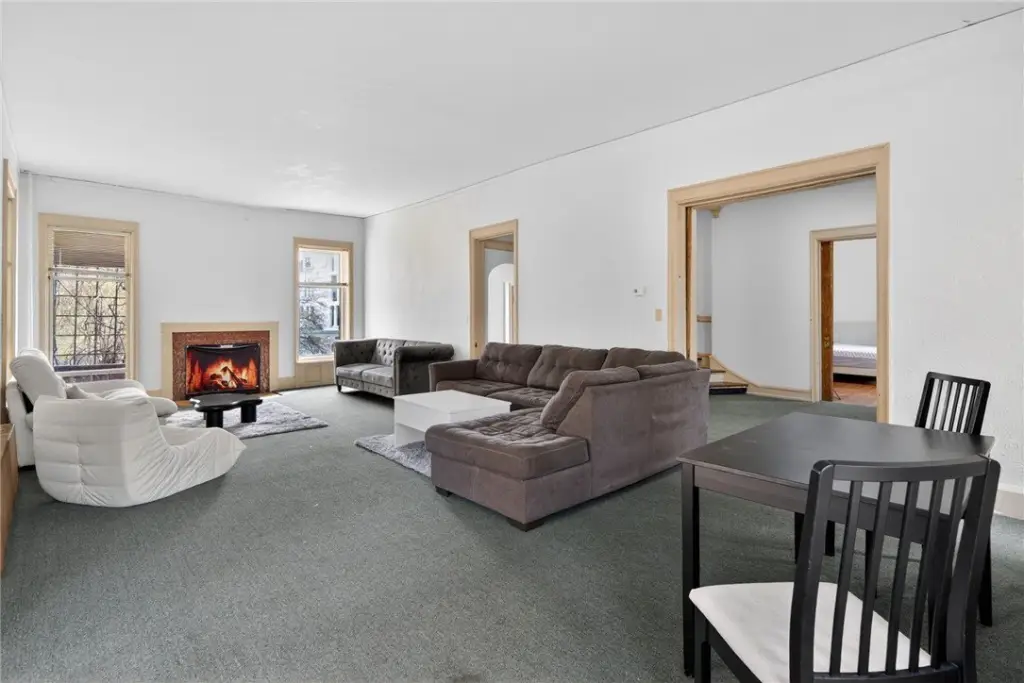
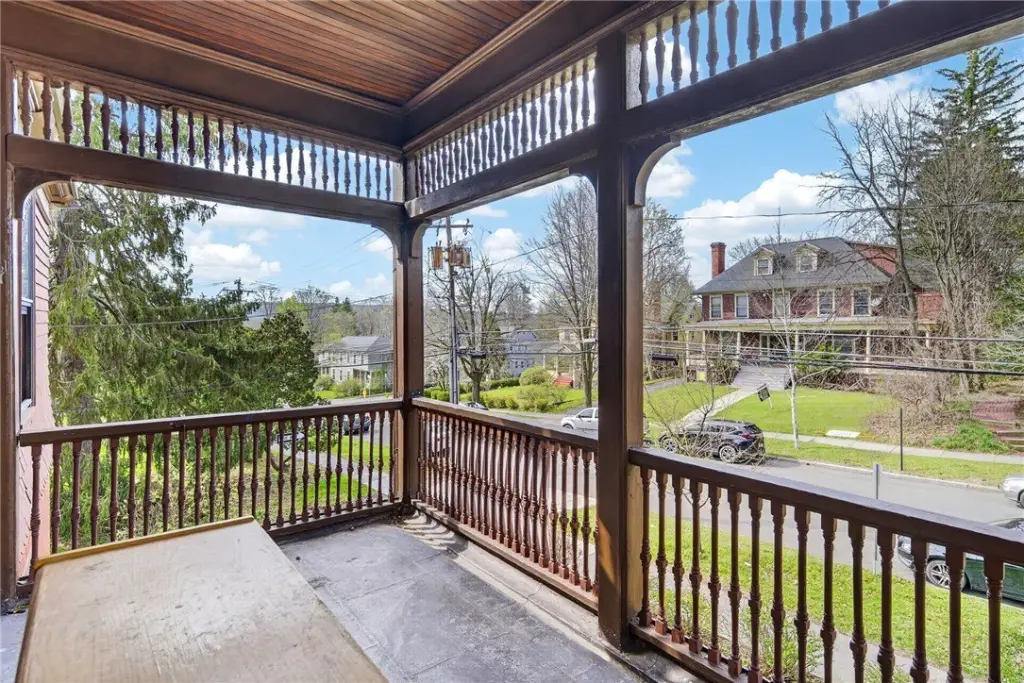
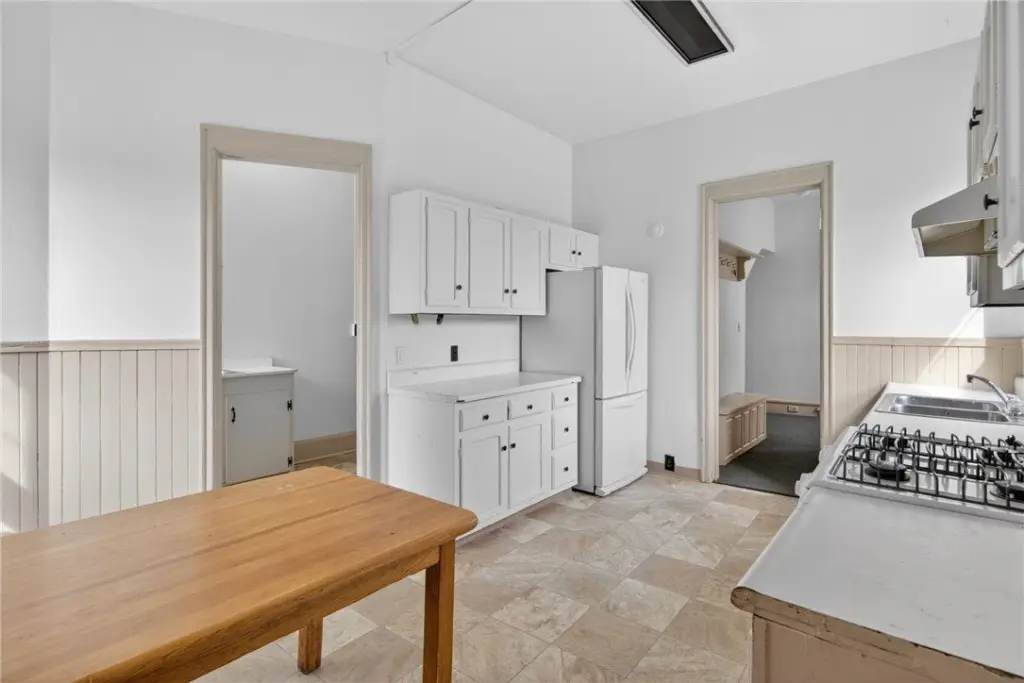
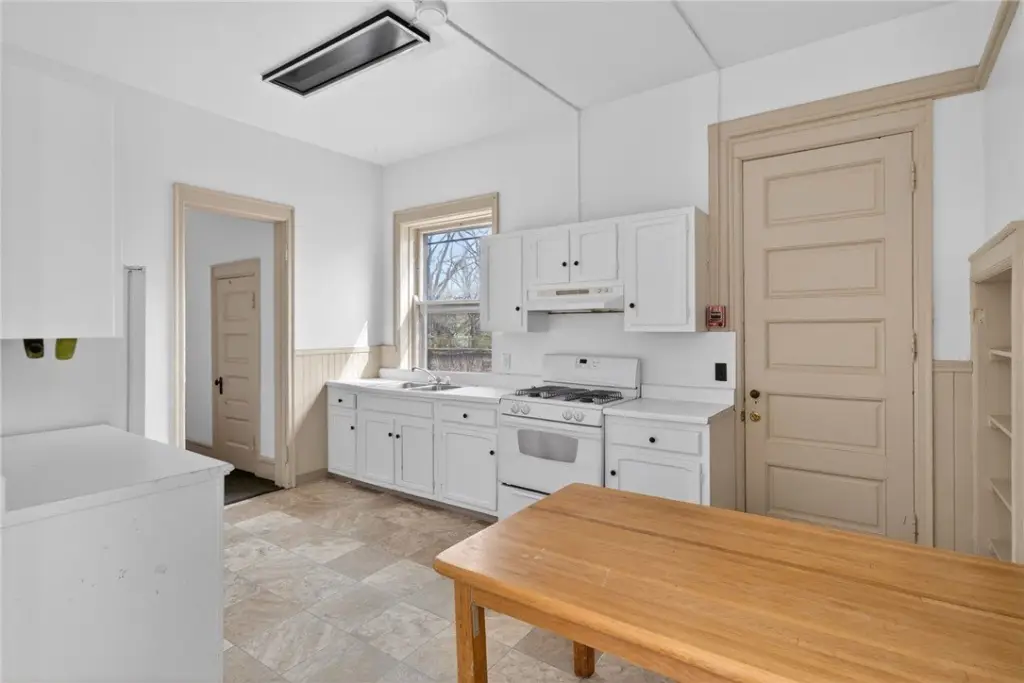
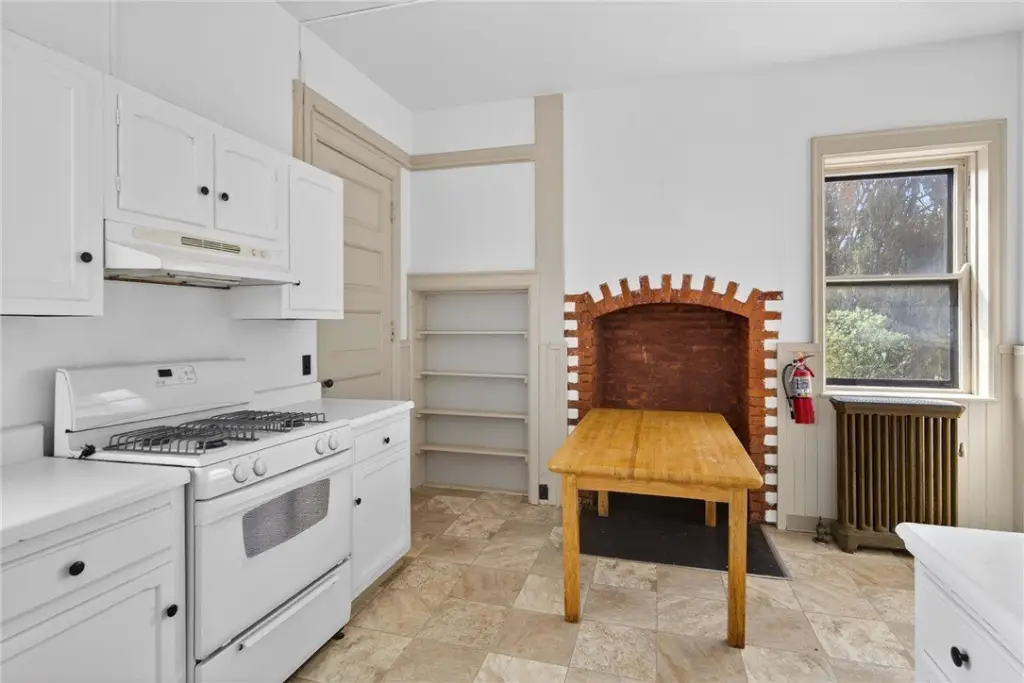
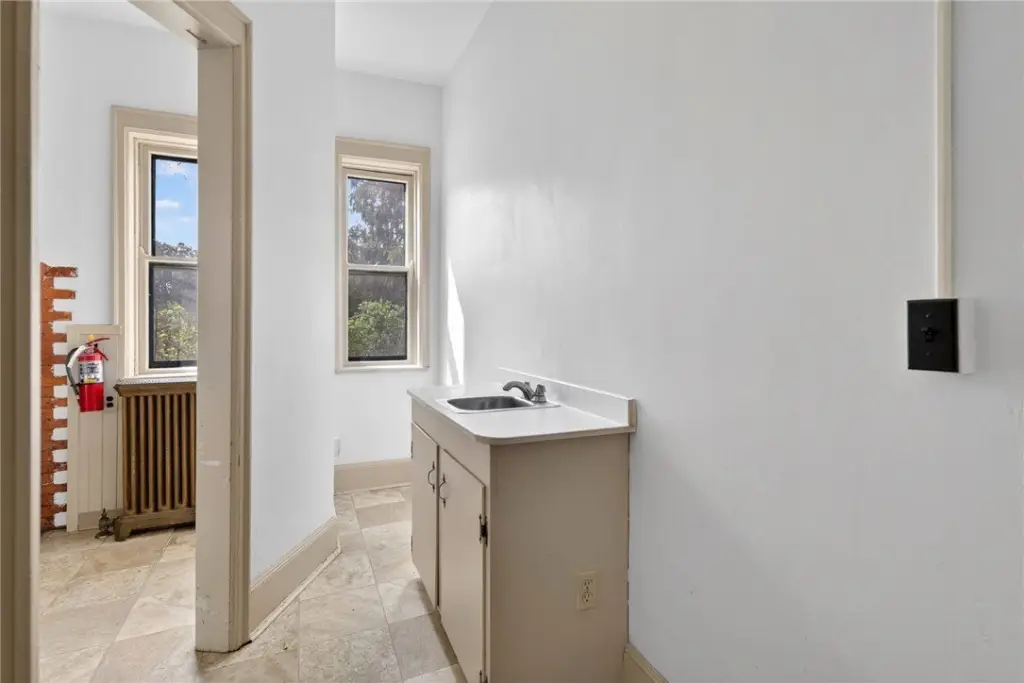
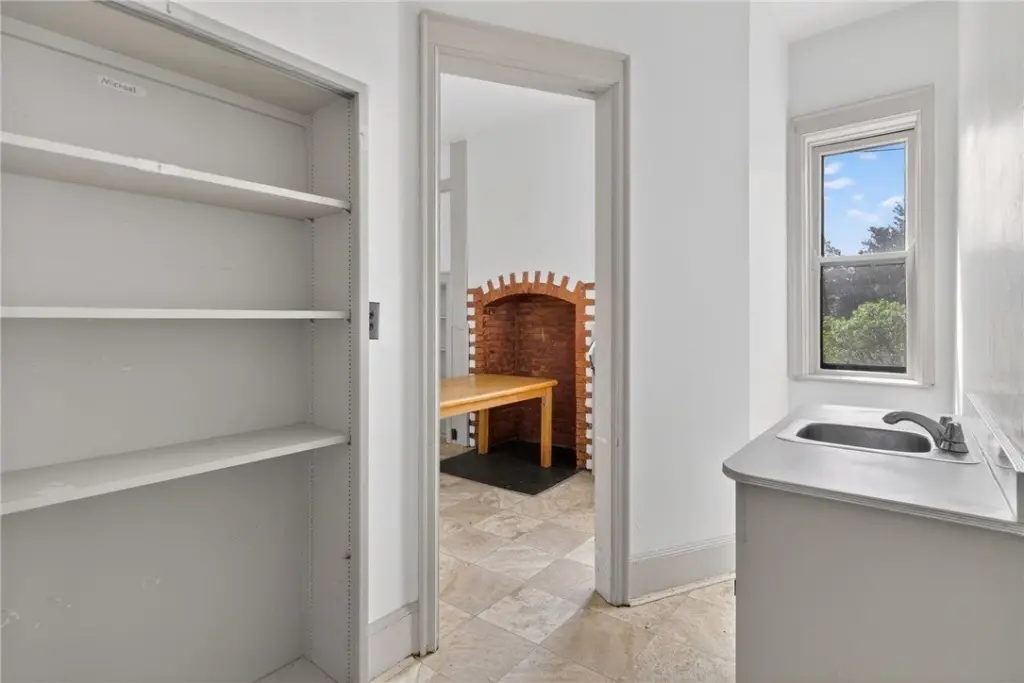
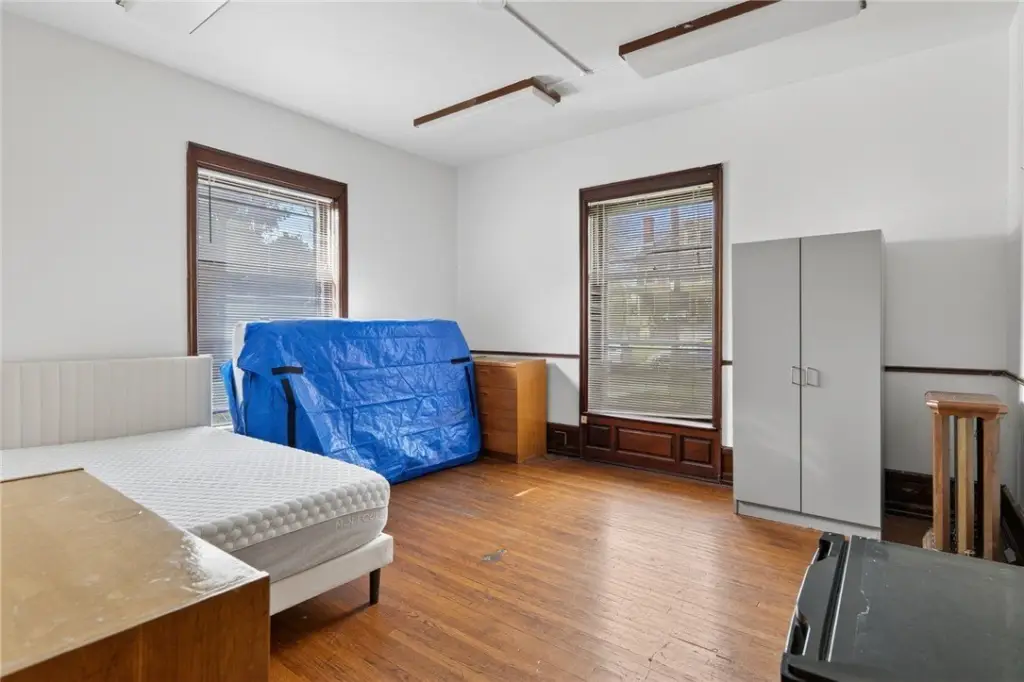
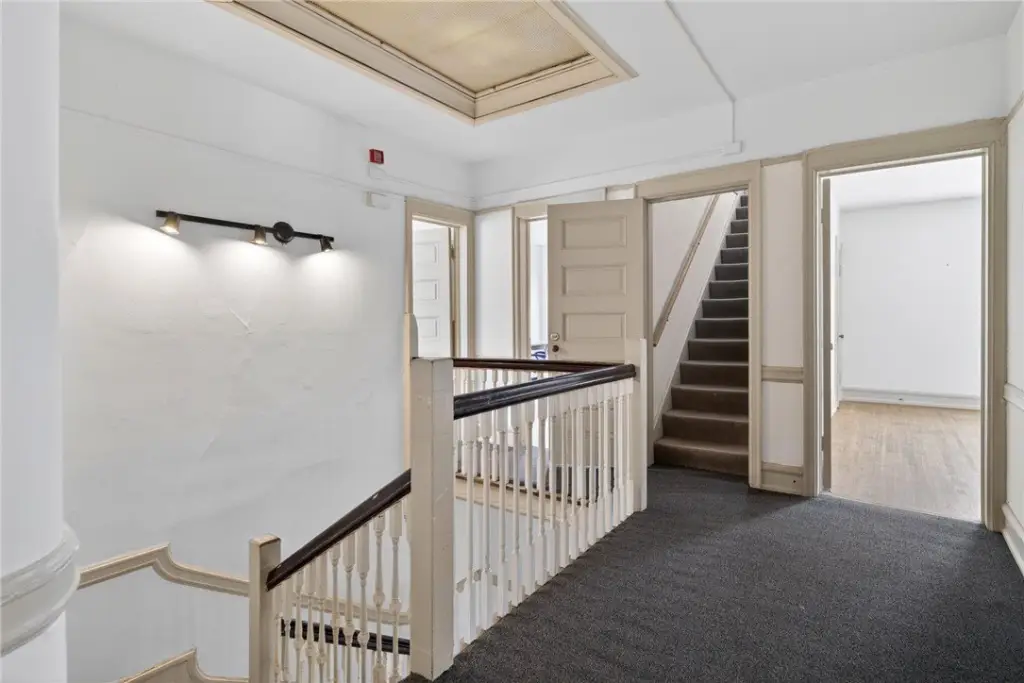
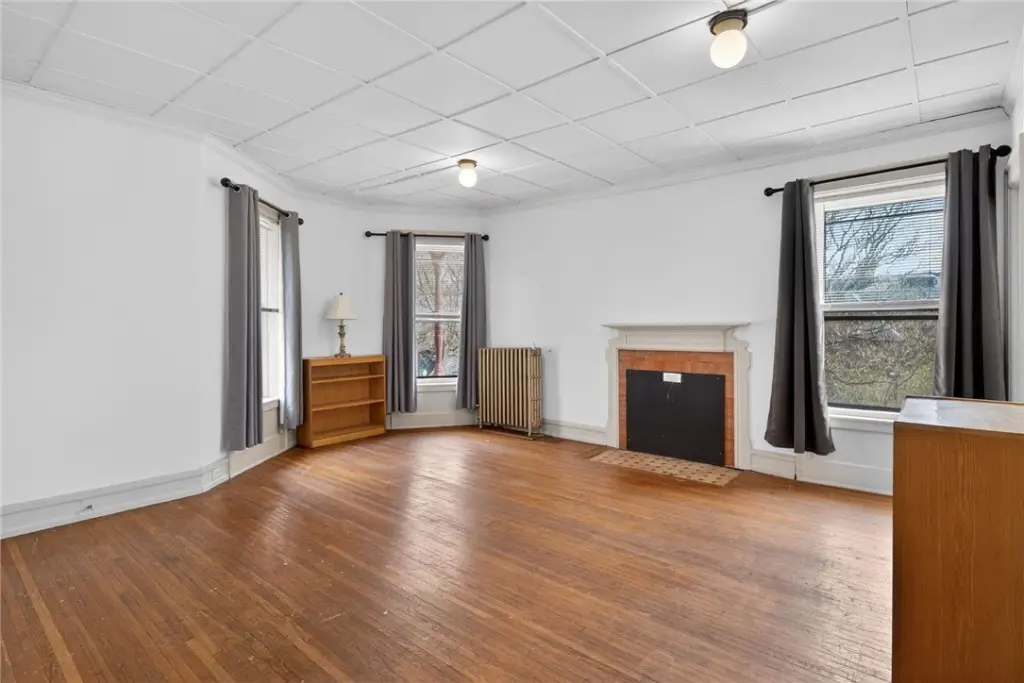
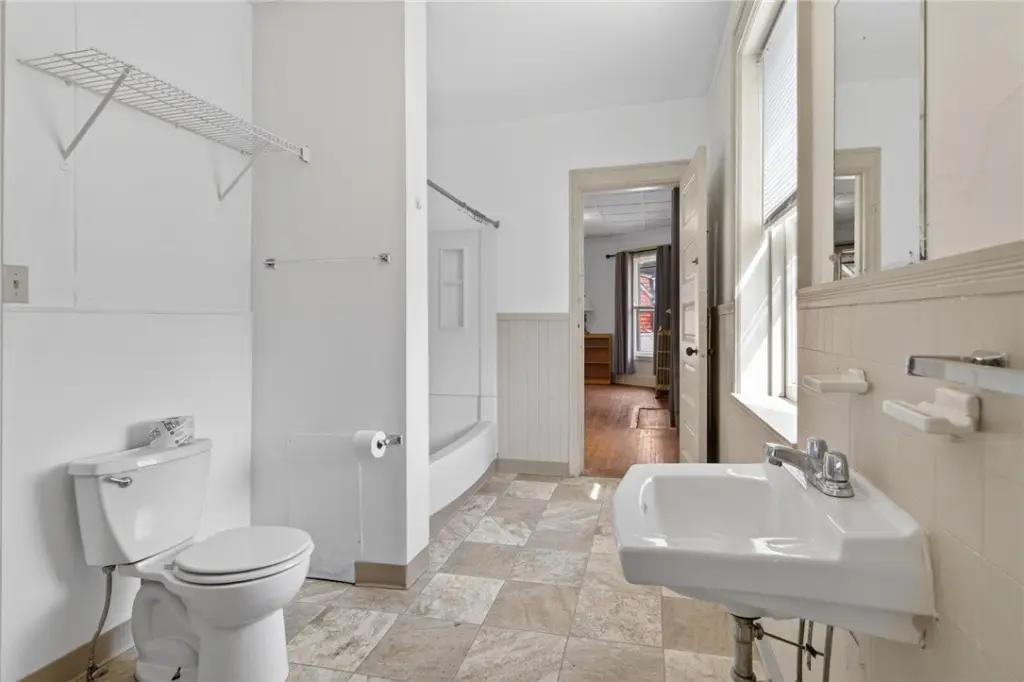
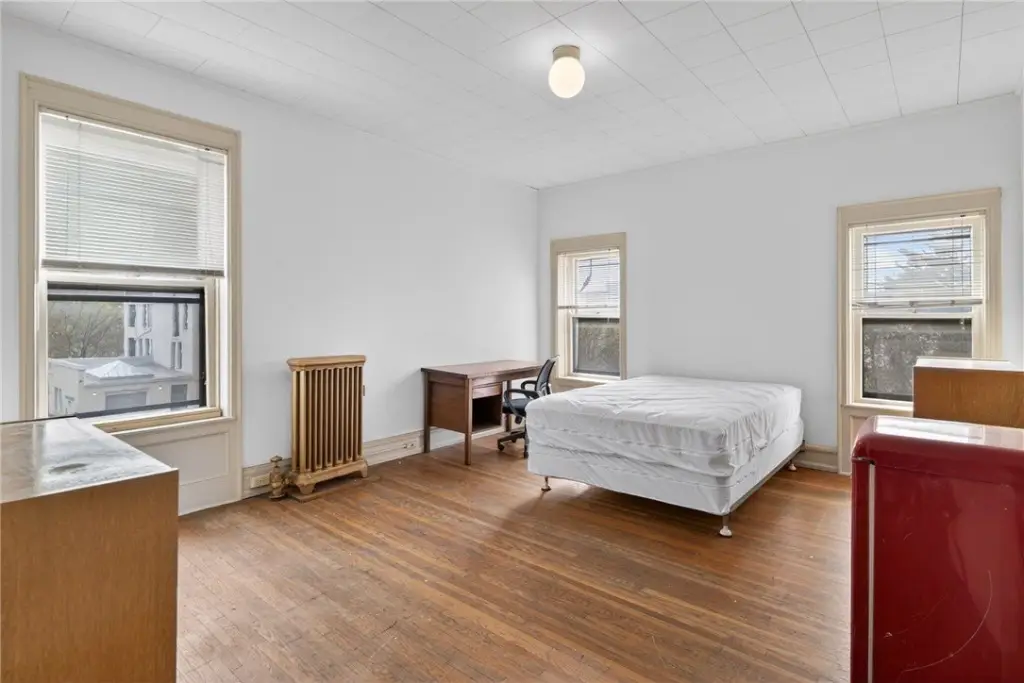
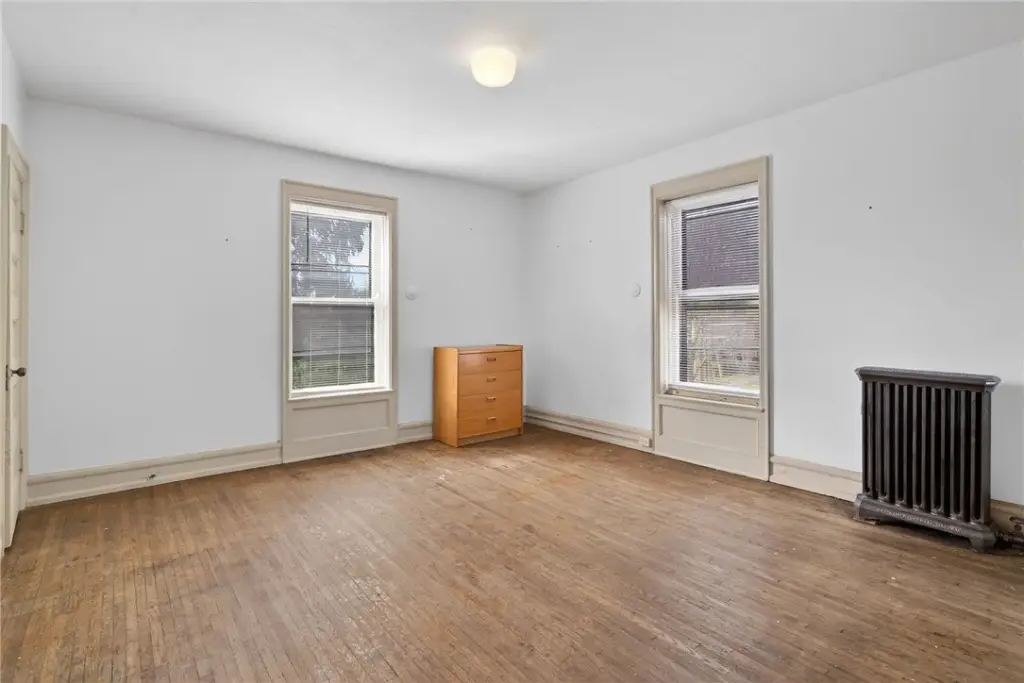
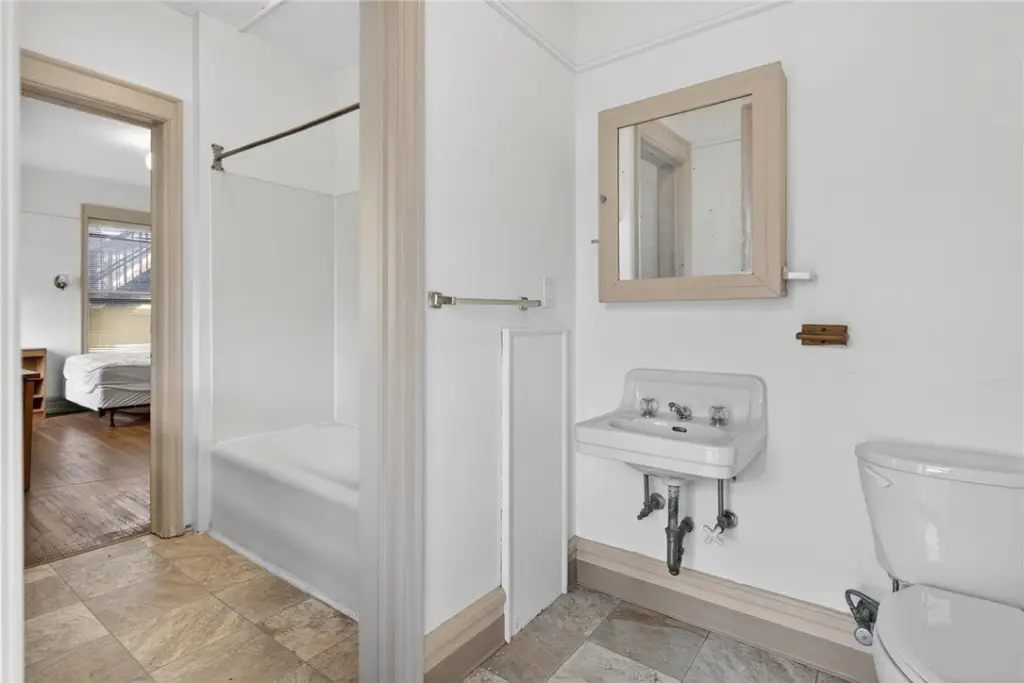
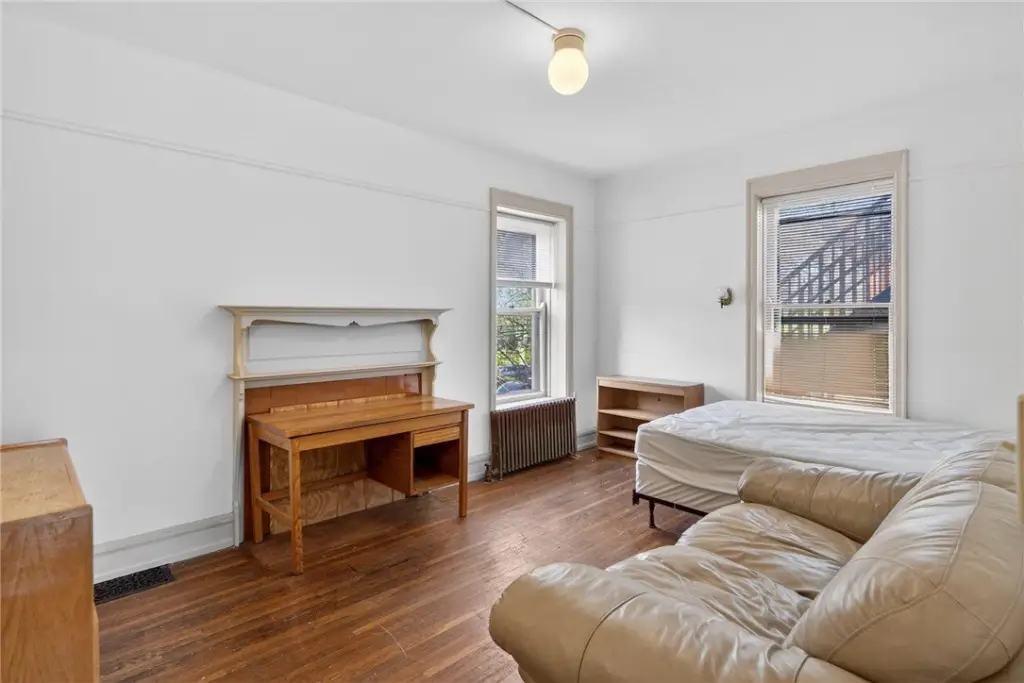
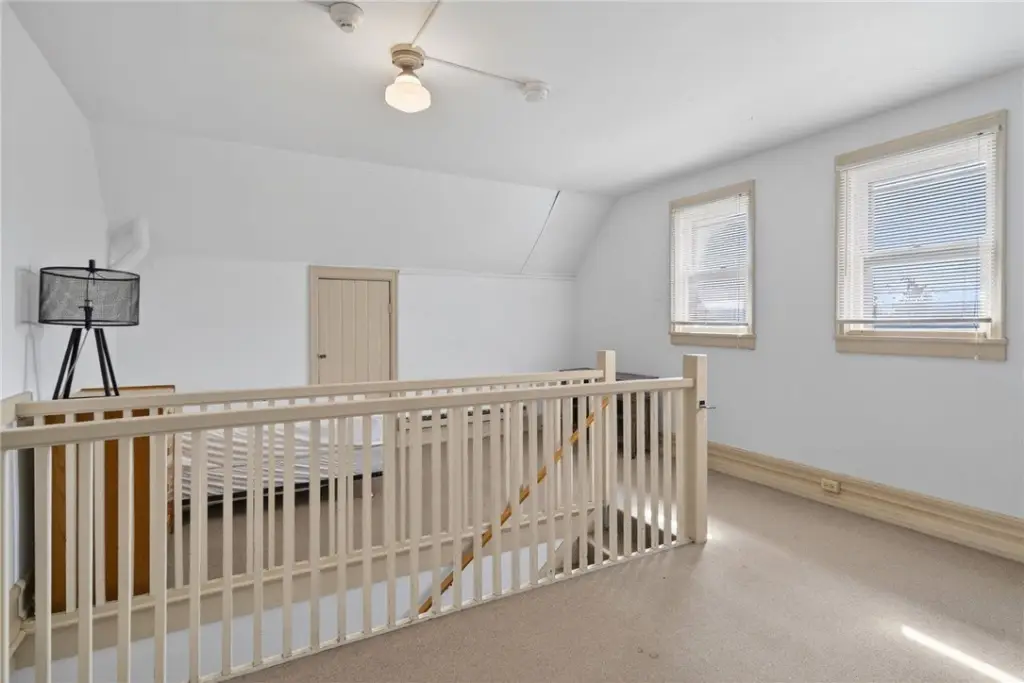
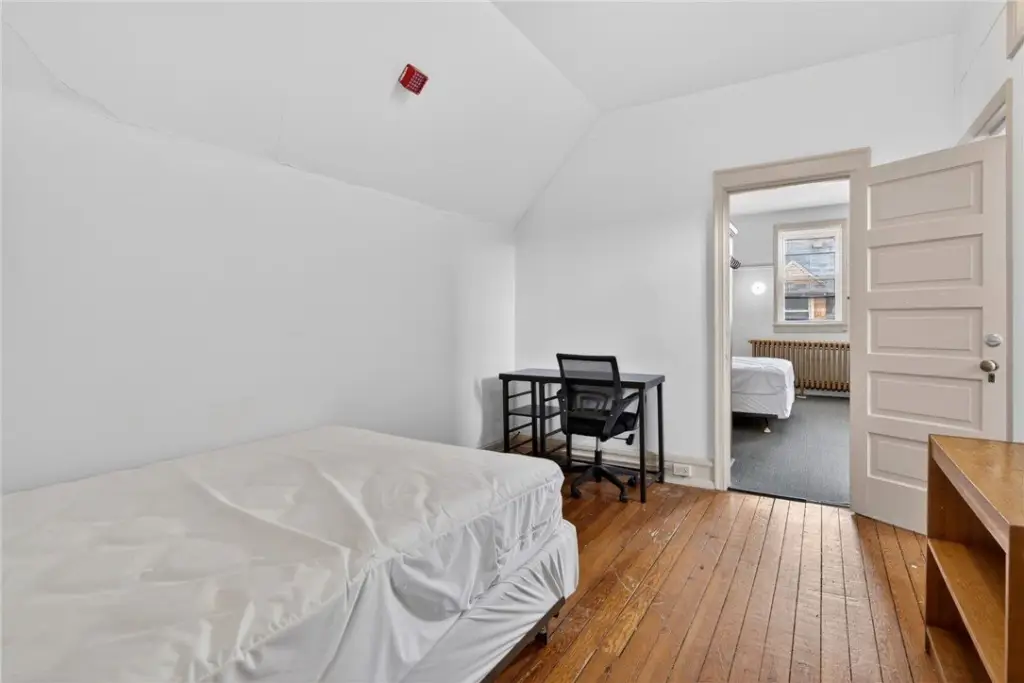
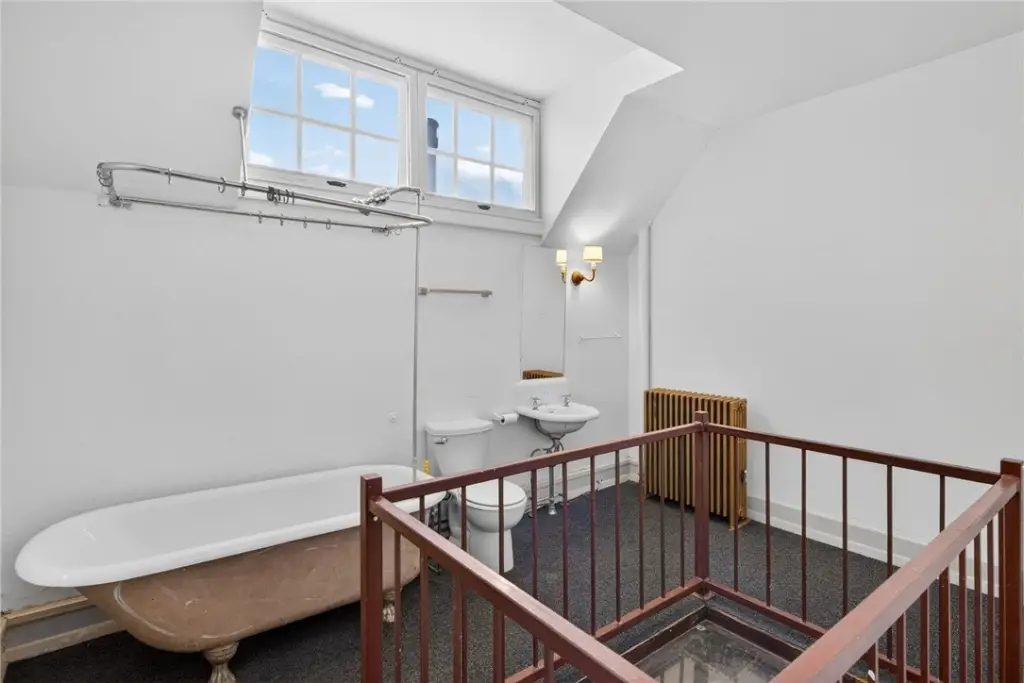
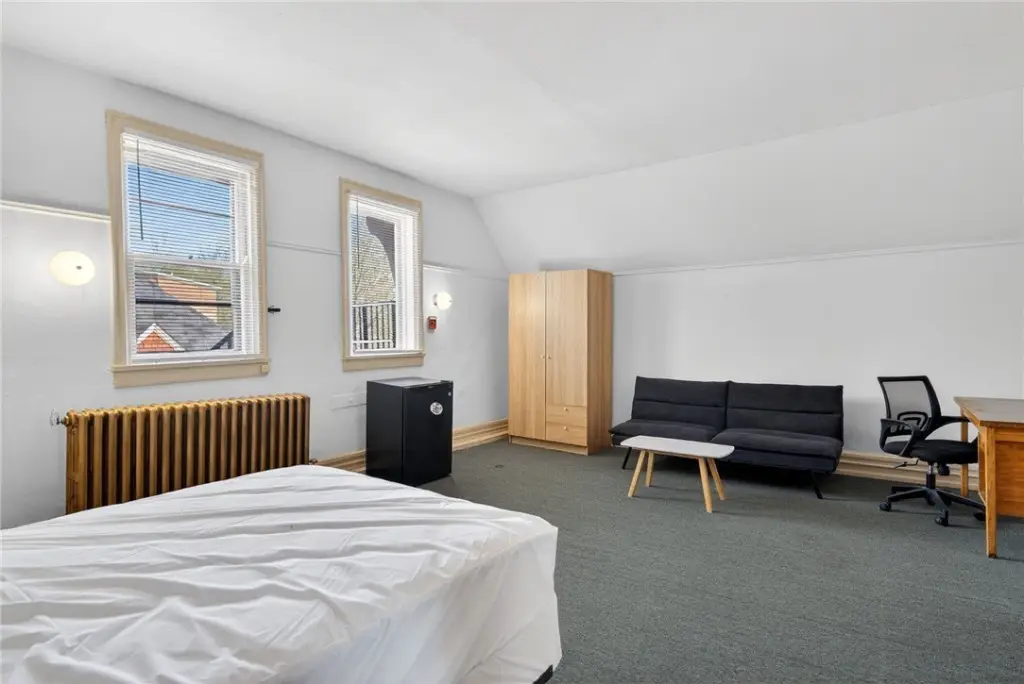
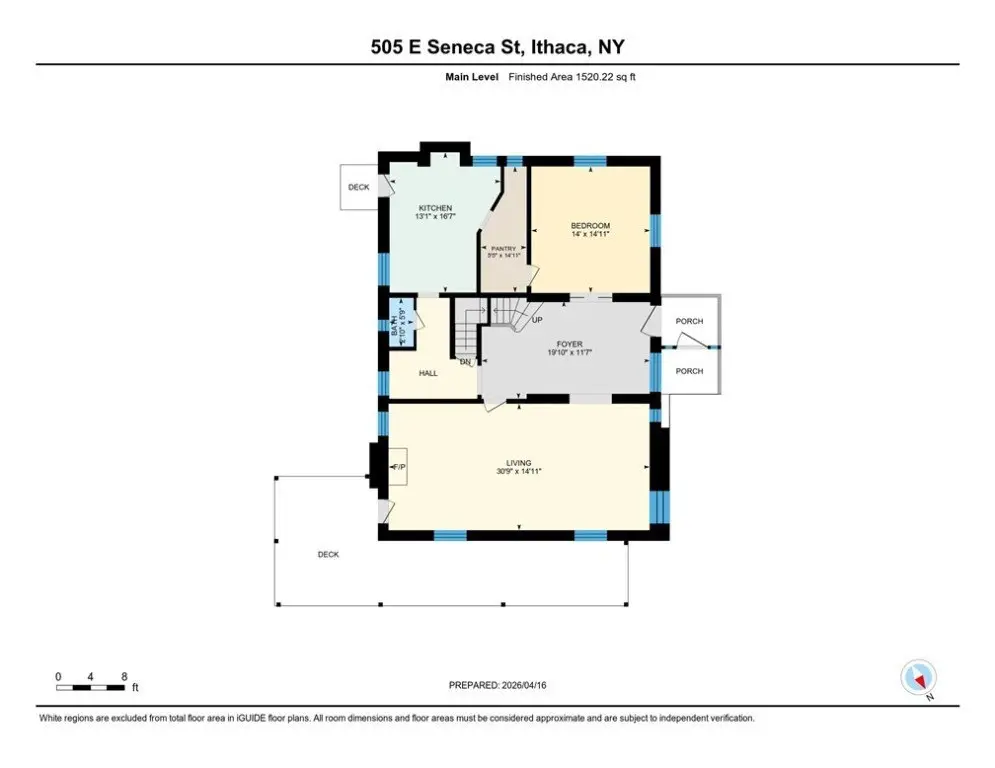
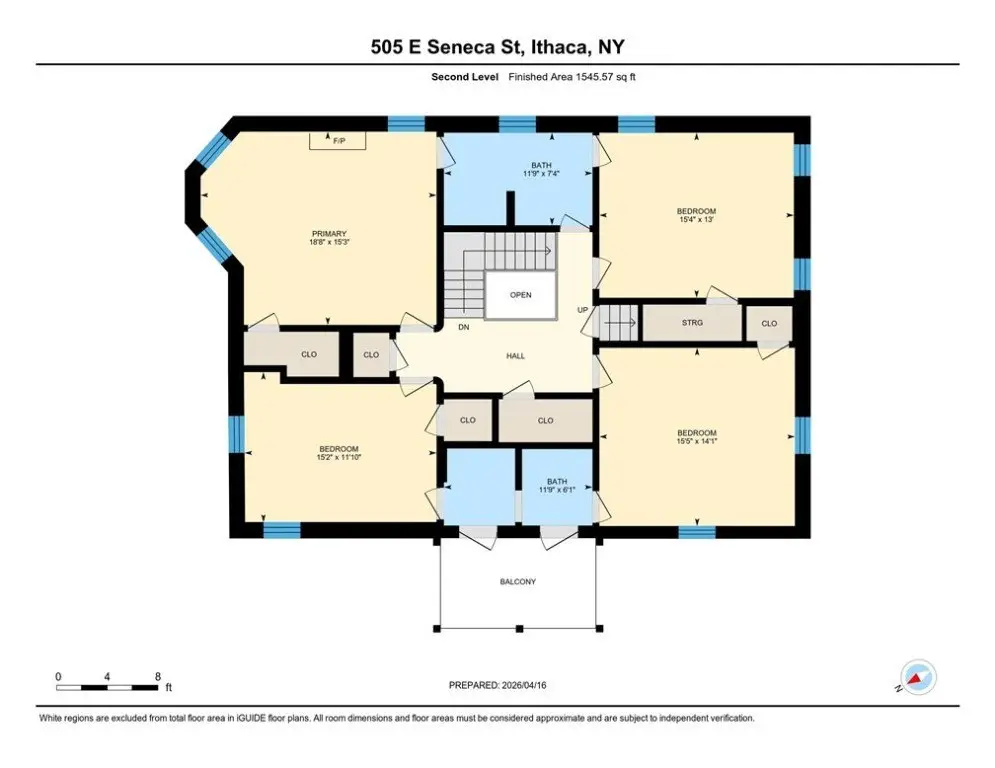
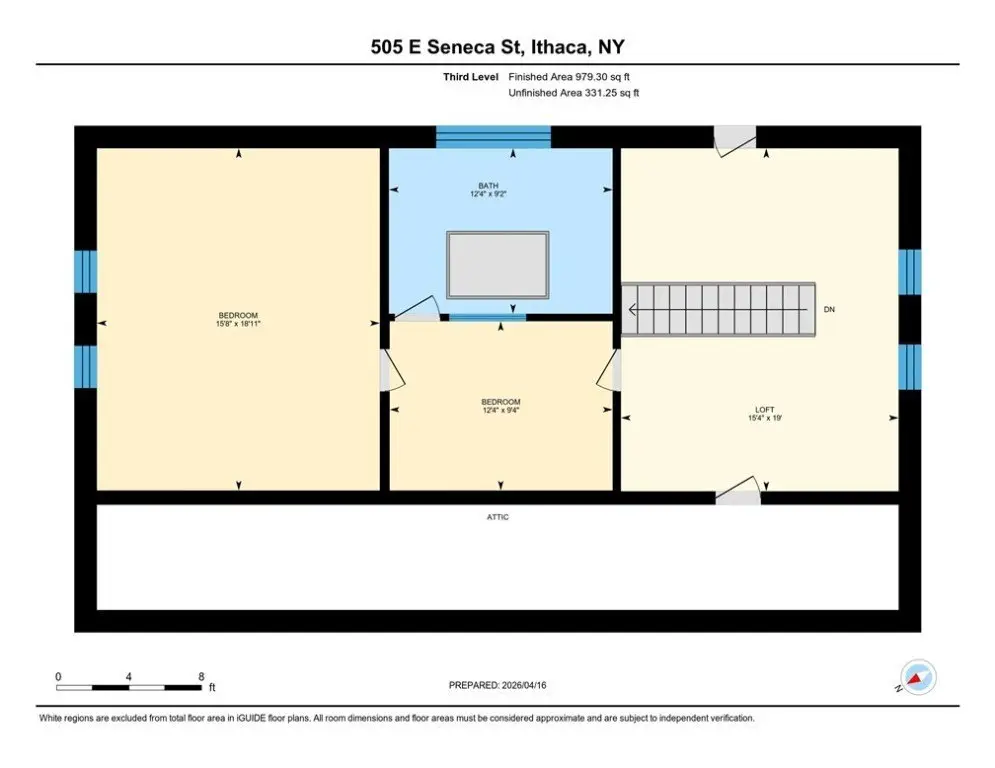
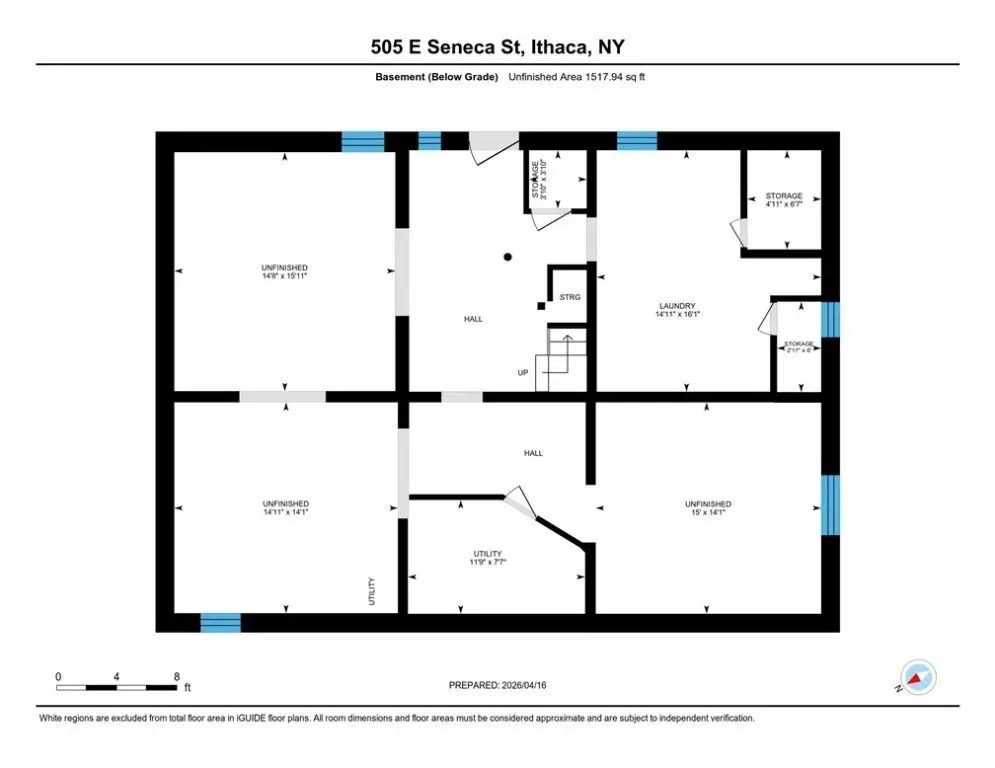
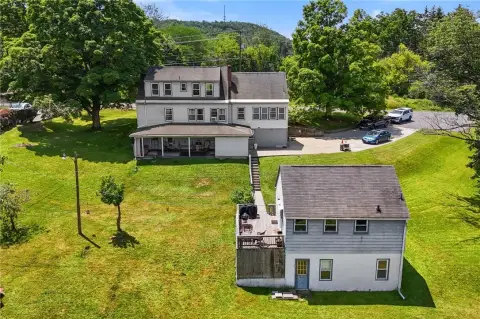
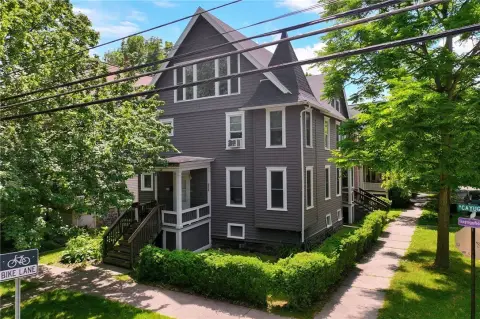
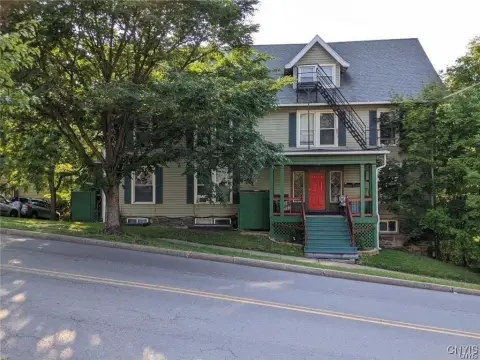
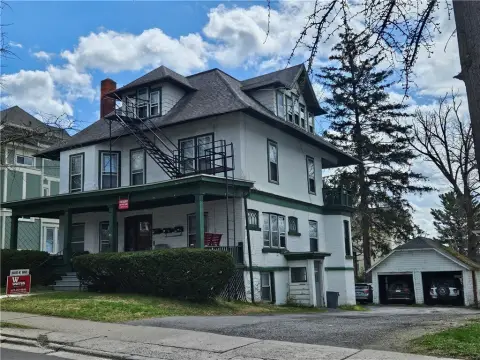
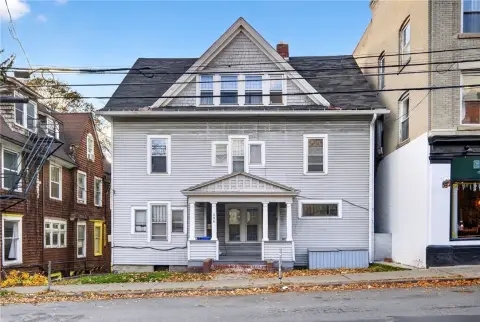
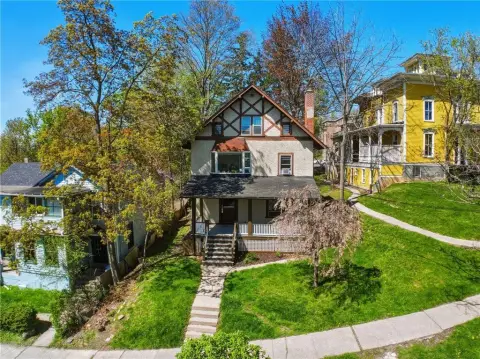
Located in the heart of Ithaca's historic district, 505 E Seneca Street offers flexibility for various uses, including an investment property, boarding house, or conversion to a single-family residence. The property is conveniently located near Cornell University, downtown Ithaca, restaurants, shopping, public transportation, and neighborhood amenities. The home features a wraparound porch and stained glass details. The main level includes a living room with porch access and a kitchen with a butler's pantry. The second floor has four bedrooms, arranged with two bedrooms sharing each Jack and Jill bathroom. The third floor offers two rooms and a full bathroom, suitable for guest rooms, office space, studio use, recreation, or expanded living. The property, situated on a 0.1917-acre lot, offers possibilities for an owner occupant, investor, or buyer seeking long-term potential. The property's size is 4045 square feet. The garage on the property is not currently in use. The source of the square footage is the floor plans included in photos and attachments.
Key Highlights
- Built in 1886 with brick and wood siding construction and copper plumbing.
- Historic district home with stained glass details and a wraparound porch.
- Flexible bedroom layout: 6 bedrooms plus basement, including a second‑floor setup with two Jack‑and‑Jill bathrooms.
Financial Insights
Estimated NOI and Cap Rate
NOI / Yr
$49,617
Cap Rate
9.04%
Suggested Prices Based on Cap Rates
Cap Rate 5%
$992,340
$992.3K
Cap Rate 7%
$708,814
$708.8K
Cap Rate 9%
$551,300
$551.3K
Market Conditions
NOI Build-Up for 4,045 SF
Gross rent
$94.2K $23.28/SF
− Vacancy
−$4.0K −$0.98/SF
EGI
$90.2K $22.30/SF
− OpEx
−$40.6K −$10.04/SF
NOI
$49.6K $12.27/SF
Area
Tompkins County, NY
Vacancy
4.20%
Lease Rate
$23.28 /SF/Yr
Expense Ratio
45.00%
Simulate Cap Rate and NOI
Suggested Prices Based on Cap Rates
Cap Rate 5%
$992,340
Cap Rate 7%
$708,814
Cap Rate 9%
$551,300
Alternative Uses
Best Use
Apartment 5plus
$708.8K
$620.2K – $827.0K
NOI $49,617 @ 7.0% cap · market cap 9.04%
Second Best
—
—
no second resolved use
Theoretical Best
Office A
$1.26M
$1.10M – $1.47M
NOI $88,355 @ 7.0% cap · market cap 16.09%
Zoning and permitted uses should be independently verified with authorities.
Property Analytics
Unlock full access to Insights
Subscribe to Realmo Intelligence
Open Analytics
Current Use
Location Intelligence
Trade Area within ½ mile
2,546
Businesses Nearby
Explore this area
Business Placement
Demographics for 14850, NY
69,271
Population
31,772
Households
2.2
Avg Household Size
29
Median Age
72%
College-Educated
96%
High-School Grad
124.8 sq mi
ZIP Area
555
Density / Sq Mi
$69,689
Median Household Income
$36,115
Median Earnings
$1,446
Median Rent
$334,800
Median Home Value
Check the figures for this property
Cap Rate, Value Estimation, Potential NOI and more
View Realmo Analytics
Market
Vacancy Rate% for Multifamily in Northeast region

Questions? Ask Rey
Realmo’s AI knows this listing — price, zoning, demand, history. Ask anything.

Frequently Asked Questions
What type of property is this?
Multifamily property - Versatile property near Cornell, ideal for investment or single-family living.
Where is this multifamily property located?
The property is located at 505 E Seneca Street Ithaca, NY.
What is the asking price?
The asking price for this property is $549,000.
What are key features of this property?
This property features: Built in 1886 with brick and wood siding construction and copper plumbing.; Historic district home with stained glass details and a wraparound porch.; Flexible bedroom layout: 6 bedrooms plus basement, including a second‑floor setup with two Jack‑and‑Jill bathrooms.



