Restaurant with Outdoor
For Sale
$595,000
202 E Falls Street, Ithaca, NY 14850
CommercialSale, Ithaca, NY
Property Size2,214 SF
Price / SF$268.74
Days on Market141
Property Features for 202 E Falls Street
General Information
Property type
Commercial Sale
Property subtype
Other
Zoning
R2
Zoning description
Commercial
Parking
20
Parking features
Paved or Surfaced
Lot features
Rectangular, Rectangular Lot
Elementary school
Fall Creek Elementary
Elementary school district
Ithaca
Middle school district
Ithaca
High school district
Ithaca
Subdivision
Ithaca-City-500700
Standard status
Active
APN
500700-012-000-0002-002-000-0000
Size
2,214 SF
Taxes and HOA fees
Tax Annual Amount
11764
Utilities
Sewer type
Public Sewer
Heating system
Forced Air, Heat Pump (Heating), Natural Gas
Cooling system
Heat Pump
Water source
Public
Building Details
Year built
1985
Floors in Building
1
Number of units
1
Flooring type
Concrete
Building materials
Block, Concrete, WoodSiding
Roof type
Rubber, Flat, Membrane
Listing Agency:
Warren Real Estate of Ithaca Inc. (Downtown)
(607) 257-0666
Listed By:
Andrew Schreck · License #10401361299
(585) 802-7827
Added: May 28
Changed: Sep 16
Last Checked: Oct 15 at 8:06AM
MLS# R1685918
Copyright © 2026 New York State Alliance of MLSs, LLC. All rights reserved. All information provided by the listing agent/broker is deemed reliable but is not guaranteed and should be independently verified.
Investment Insights
Based on property information with market context.
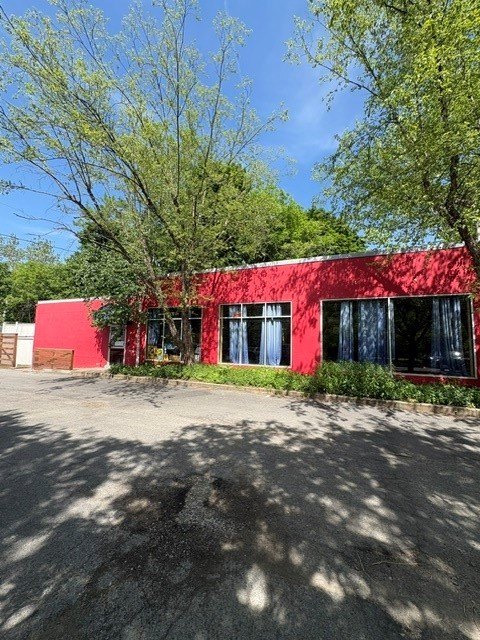
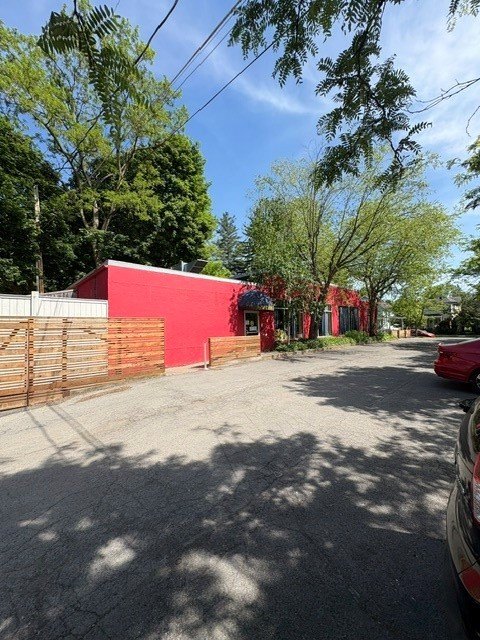
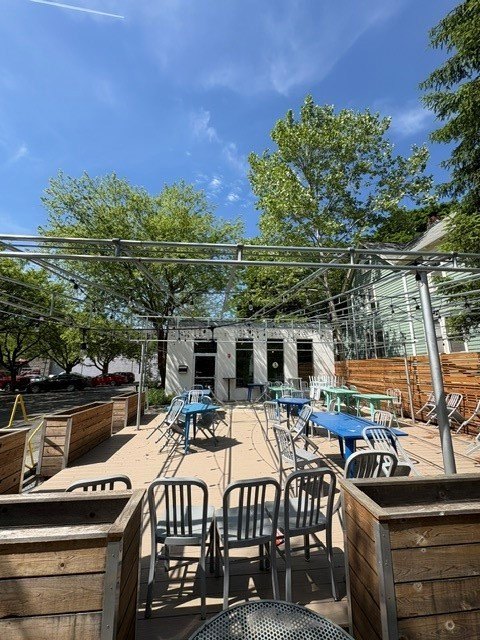
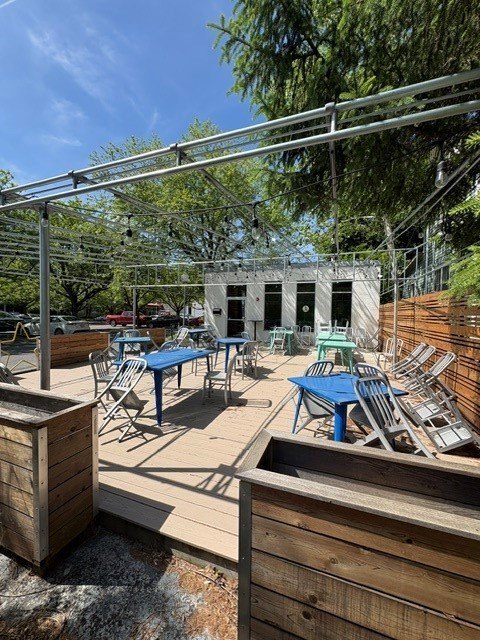
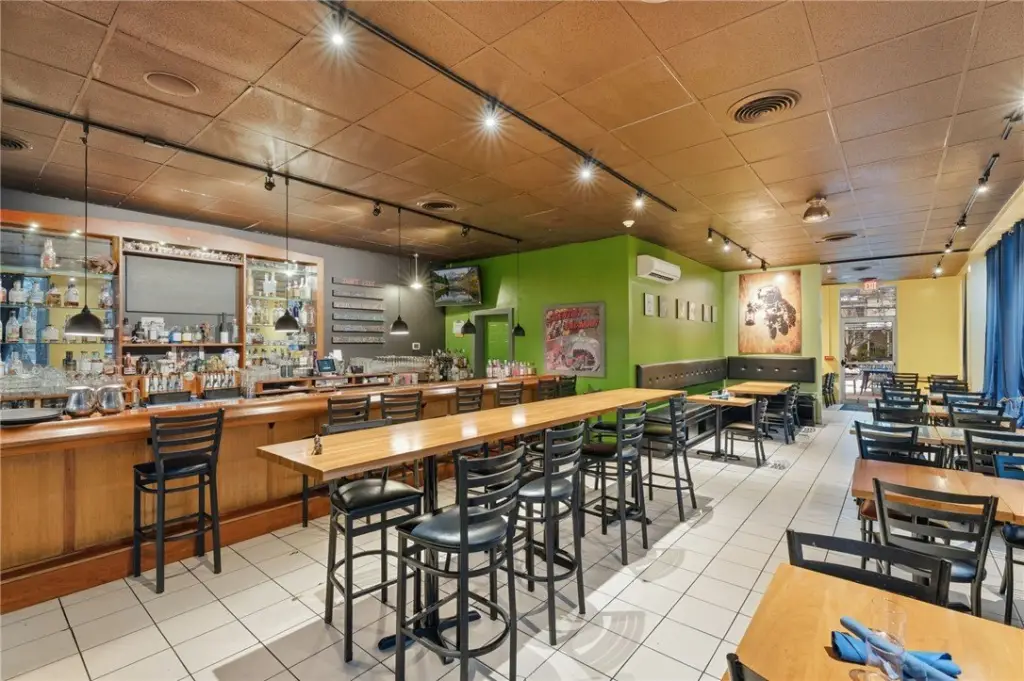
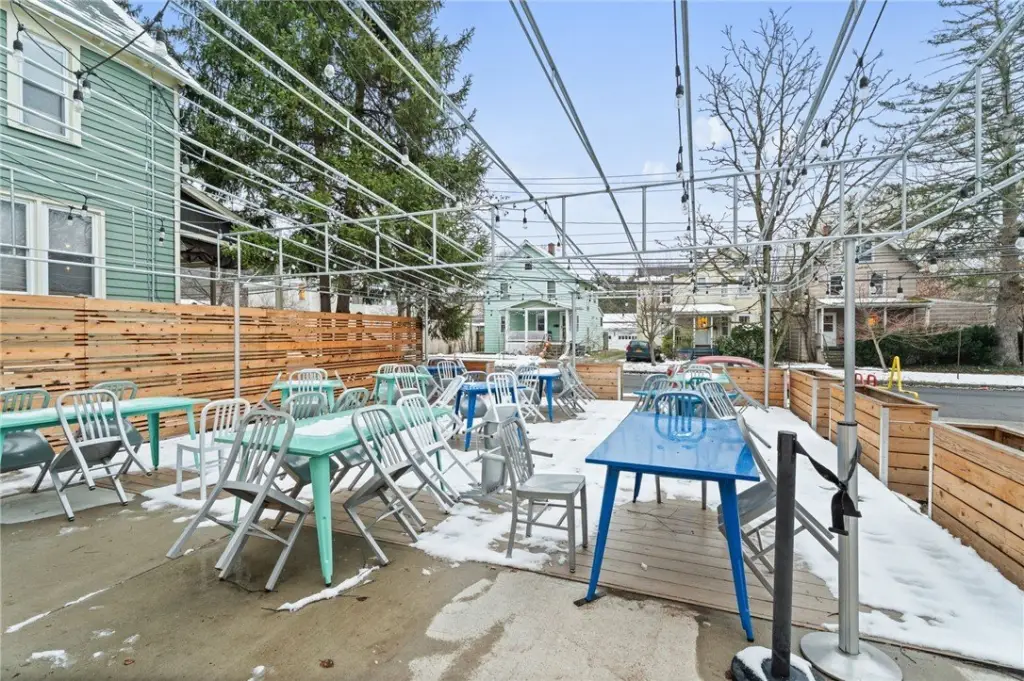
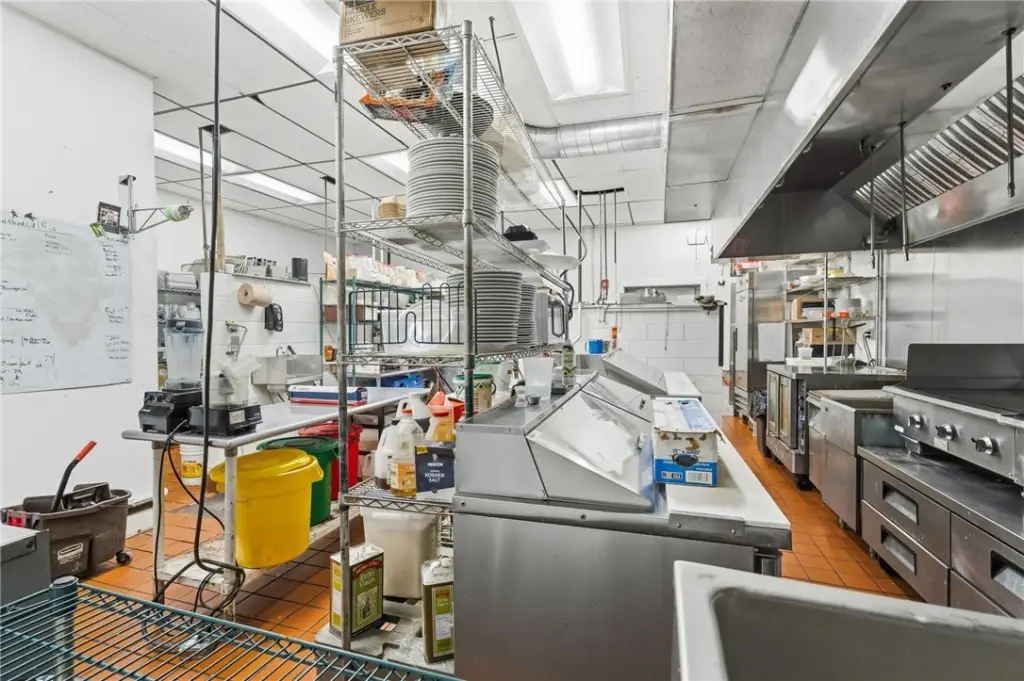
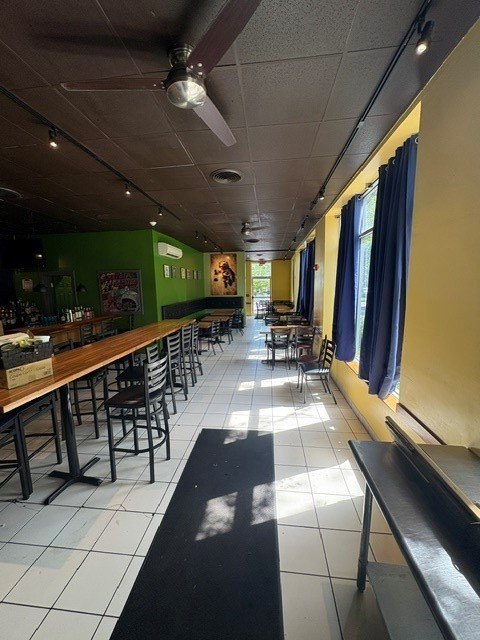
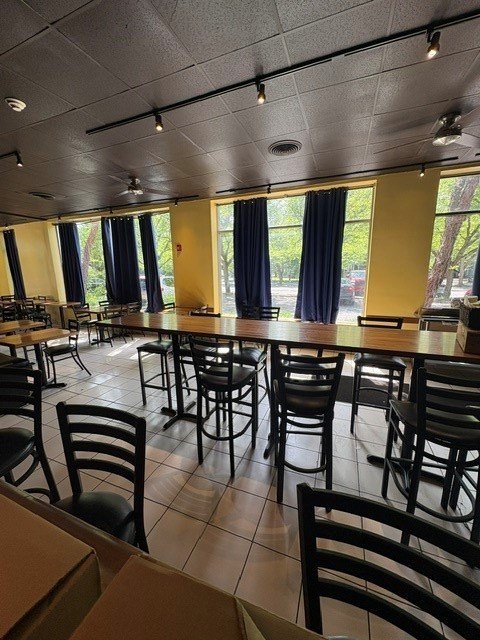
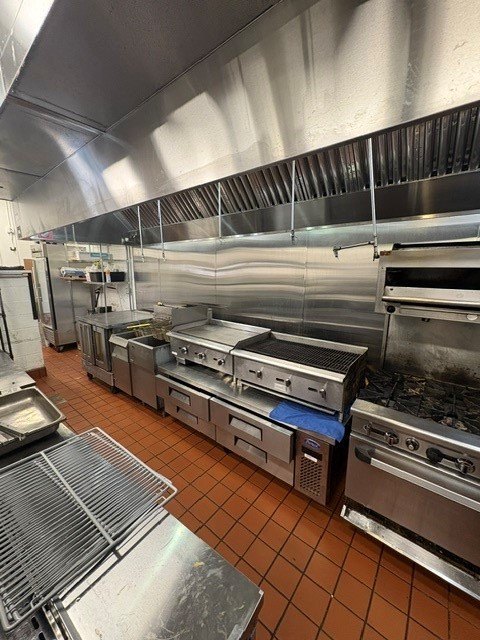
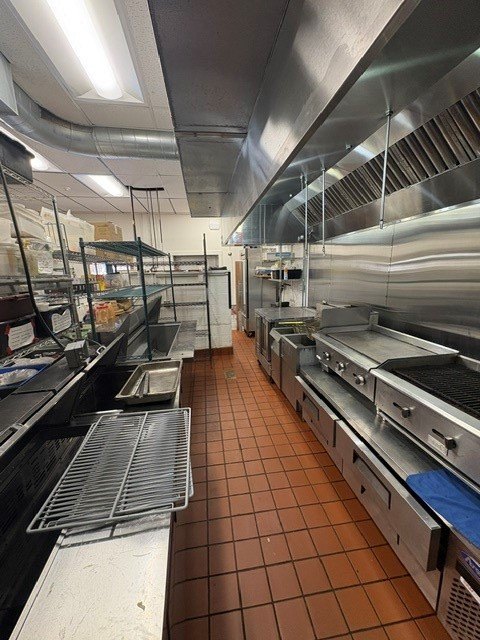
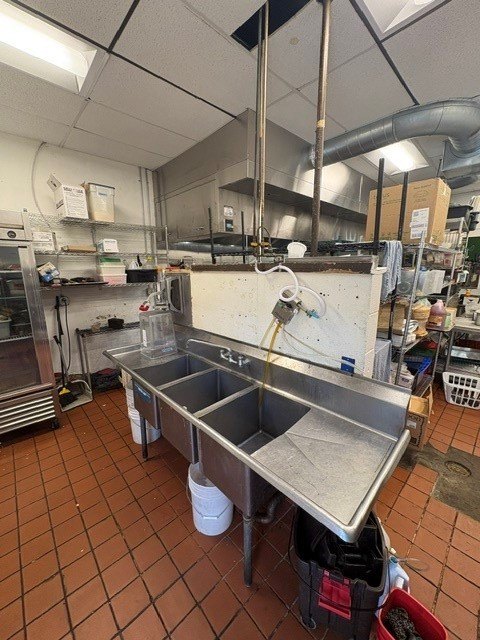
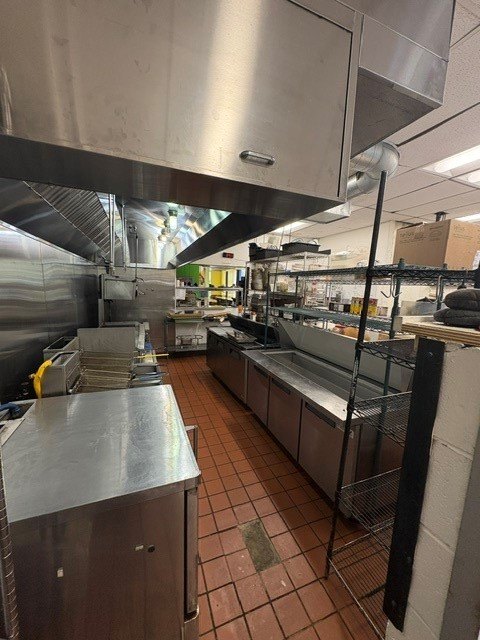
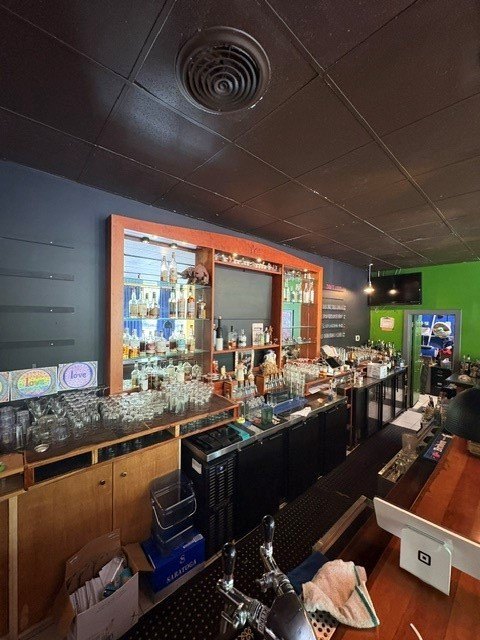
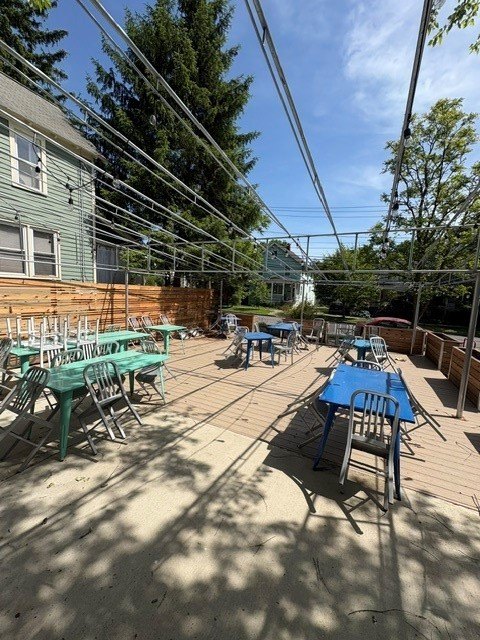
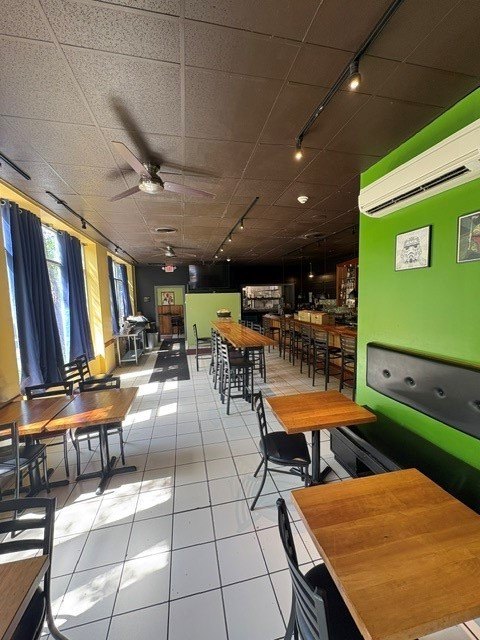
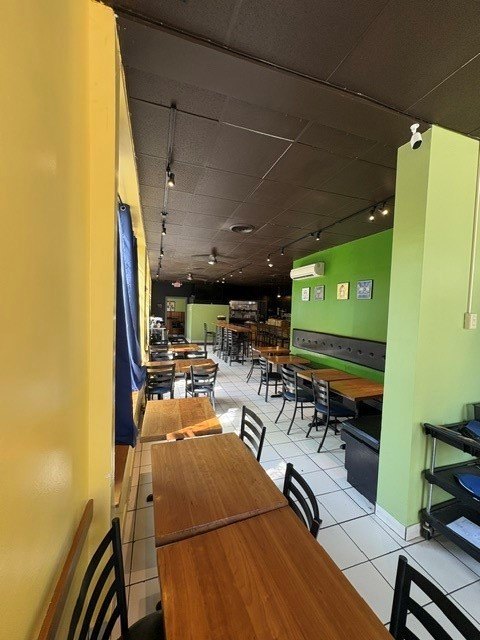
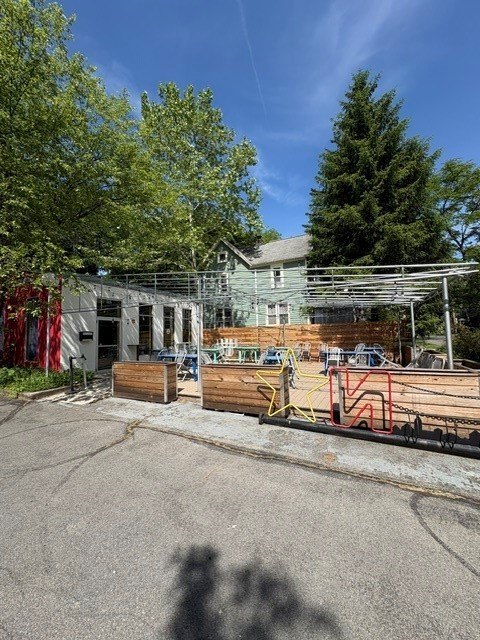
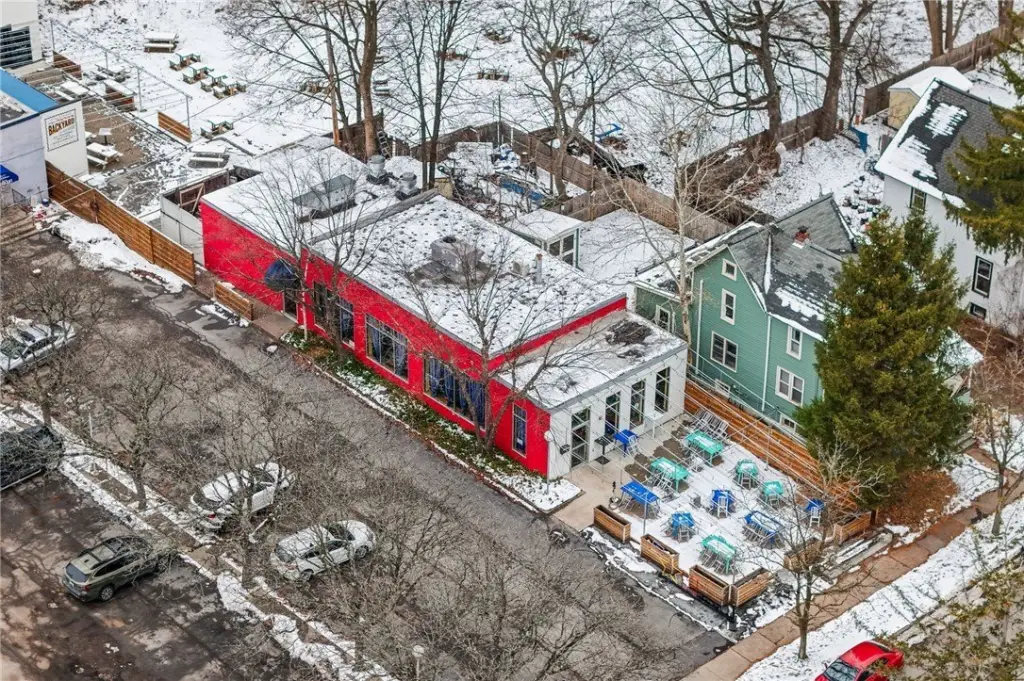
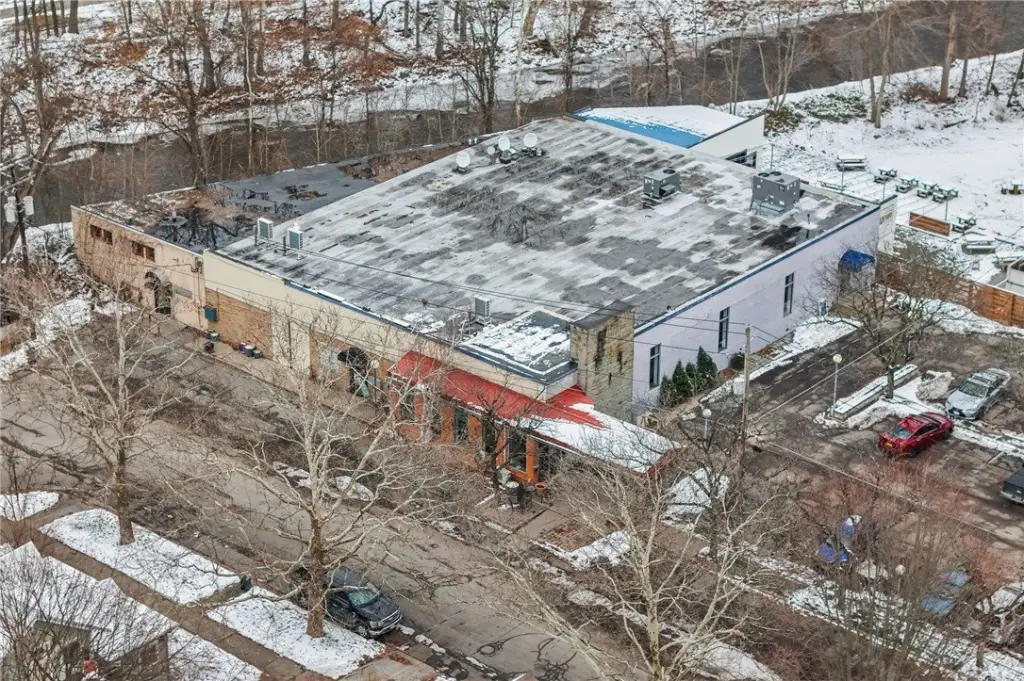
The 2,214-square-foot restaurant property, built in 1985, offers a configured hospitality space with expansive windows, a commercial kitchen, and a full-service bar area. Front patio seating and a rear outdoor dining area provide additional guest space for seasonal service and private events. The building has concrete flooring, block, concrete, and wood siding construction, along with a flat rubber membrane roof.
Located at 202 E Falls Street in Ithaca’s Fall Creek neighborhood, the property is near downtown Ithaca, Cornell University, Ithaca Falls, and surrounding residential areas. Paved off-street parking supports customer, staff, delivery, and catering access. Public water and public sewer serve the property, with natural gas, forced-air, and heat-pump systems in place for heating and cooling.
Located at 202 E Falls Street in Ithaca’s Fall Creek neighborhood, the property is near downtown Ithaca, Cornell University, Ithaca Falls, and surrounding residential areas. Paved off-street parking supports customer, staff, delivery, and catering access. Public water and public sewer serve the property, with natural gas, forced-air, and heat-pump systems in place for heating and cooling.
Key Highlights
- 2,214 SF restaurant property built in 1985
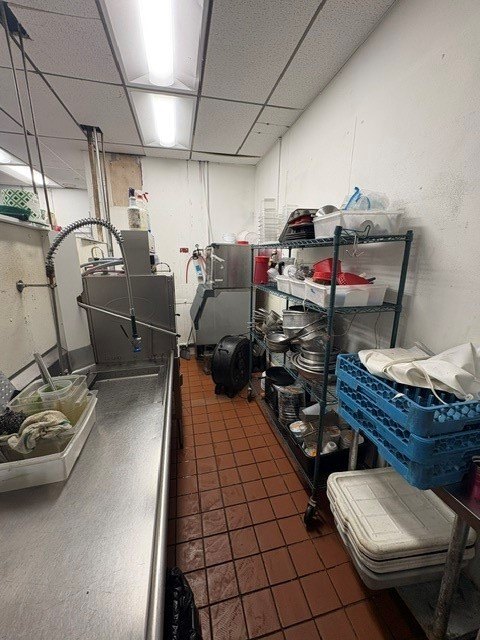
- Commercial kitchen with dedicated preparation and cooking space
- Full‑service bar area for beverage and hospitality service
Financial Insights
Estimated NOI and Cap Rate
NOI / Yr
$28,634
Cap Rate
4.81%
Suggested Prices Based on Cap Rates
Cap Rate 5%
$572,680
$572.7K
Cap Rate 7%
$409,057
$409.1K
Cap Rate 9%
$318,156
$318.2K
Market Conditions
NOI Build-Up for 2,214 SF
Gross rent
$39.9K $18.00/SF
− Vacancy
−$1.7K −$0.76/SF
EGI
$38.2K $17.24/SF
− OpEx
−$9.5K −$4.31/SF
NOI
$28.6K $12.93/SF
Area
Tompkins County, NY
Vacancy
4.20%
Lease Rate
$18.00 /SF/Yr
Expense Ratio
25.00%
Simulate Cap Rate and NOI
Suggested Prices Based on Cap Rates
Cap Rate 5%
$572,680
Cap Rate 7%
$409,057
Cap Rate 9%
$318,156
Alternative Uses
Best Use
Specialty Retail
$409.1K
$357.9K – $477.2K
NOI $28,634 @ 7.0% cap · market cap 4.81%
Second Best
Industrial
$195.6K
$171.2K – $228.2K
NOI $13,693 @ 7.0% cap · market cap 2.30%
Theoretical Best
Office A
$690.9K
$604.5K – $806.0K
NOI $48,361 @ 7.0% cap · market cap 8.13%
Zoning and permitted uses should be independently verified with authorities.
How Realmo checks its estimates
Property Analytics
Unlock full access to Insights
Subscribe to Realmo Intelligence
Open Analytics
Current Use
Location Intelligence
Trade Area within ½ mile
654
Businesses Nearby
24k
Monthly Visits Nearby
Under-served
Demand for This Use
Explore this area
Business Placement
Foot Traffic Nearby
Groceries 70%
Dining 30%
Aldi
Groceries
16,787 visits/mo
0.5 miles
Papa John's Pizza
Dining
7,133 visits/mo
0.5 miles
Demographics for 14850, NY
69,271
Population
31,772
Households
2.2
Avg Household Size
29
Median Age
72%
College-Educated
96%
High-School Grad
124.8 sq mi
ZIP Area
555
Density / Sq Mi
$69,689
Median Household Income
$36,115
Median Earnings
$1,446
Median Rent
$334,800
Median Home Value
Check the figures for this property
Cap Rate, Value Estimation, Potential NOI and more
View Realmo Analytics
Market
Vacancy Rate% for Retail in Northeast region

Questions? Ask Rey
Realmo’s AI knows this listing — price, zoning, demand, history. Ask anything.



Frequently Asked Questions
What type of property is this?
Conventional restaurant - Established restaurant property with a commercial kitchen, bar service area, patios, and paved off-street parking.
Where is this conventional restaurant located?
The property is located at 202 E Falls Street Ithaca, NY.
What is the asking price?
The asking price for this property is $595,000.
What are key features of this property?
This property features: 2,214 SF restaurant property built in 1985; Commercial kitchen with dedicated preparation and cooking space; Full‑service bar area for beverage and hospitality service


