Four Daytona Beachside Rental
For Sale
Contact for pricing
502 N Halifax Avenue, Daytona Beach, FL 32118
Four rental properties near the beach, ideal for investors.
Property Size7,533 SF
Price / SF$232.31
Days on Market216
Property Features for 502 N Halifax Avenue
General Information
Standard status
Active
Size
7,533 SF
Property subtype
Multifamily, Land
Building Details
Year Built
1900
Stories
2
Units
9
Listing Agency:
Clayton Realty Group, LLC
Listed By:
Yan Chen · License #FL3331405
(386) 882-5022
Source:
Crexi
Added: Mar 16
Changed: Oct 3
Last Checked: Oct 16 at 9:33AM
Displayed information is deemed reliable but is not guaranteed and should be independently verified. All listing content including descriptions, pricing, images are the copyrighted material of Clayton Realty Group, LLC

Ask AI about this property
Review the available facts, identify missing information and prepare questions for the agent.
Investment Insights
Based on property information with market context.
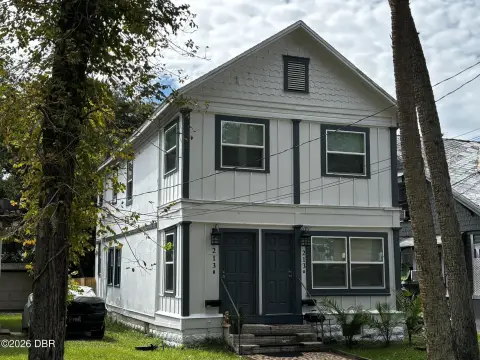
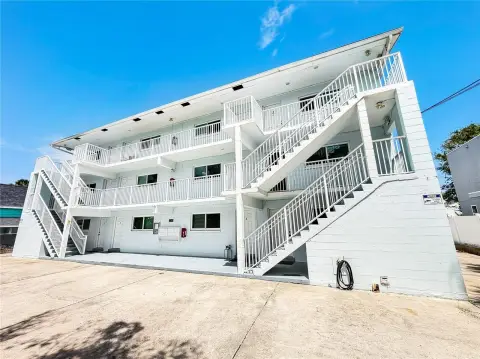
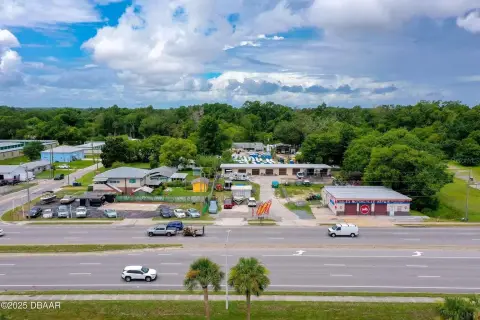
This package deal features four rental income properties, offering an opportunity to own multiple income-producing properties in a beachside location. Each building combines classic charm with modern updates, having been upgraded from the foundation to the roof. Located on a corner lot in Daytona Beachside, one property features a covered wrap-around porch across the front and side. The rear two buildings have a private, fenced courtyard. Situated close to the Intracoastal River and within walking distance of the beach, the properties offer a beachside lifestyle. The property size totals 7533 square feet. The properties have been used as rental properties and could also serve as vacation homes.
Key Highlights
- Four rental income properties offered as a package deal.
- Prime beachside location in Daytona Beachside.
- Completely upgraded from foundation to roof.
Financial Insights
Estimated NOI and Cap Rate
NOI / Yr
$57,402
Cap Rate
3.28%
Suggested Prices Based on Cap Rates
Cap Rate 5%
$1,148,040
$1.1M
Cap Rate 7%
$820,029
$820.0K
Cap Rate 9%
$637,800
$637.8K
Market Conditions
NOI Build-Up for 7,533 SF
Gross rent
$116.6K $15.48/SF
− Vacancy
−$12.2K −$1.63/SF
EGI
$104.4K $13.85/SF
− OpEx
−$47.0K −$6.23/SF
NOI
$57.4K $7.62/SF
Area
Volusia County, FL
Vacancy
10.50%
Lease Rate
$15.48 /SF/Yr
Expense Ratio
45.00%
Simulate Cap Rate and NOI
Suggested Prices Based on Cap Rates
Cap Rate 5%
$1,148,040
Cap Rate 7%
$820,029
Cap Rate 9%
$637,800
Alternative Uses
Best Use
Apartment 5plus
$820.0K
$717.5K – $956.7K
NOI $57,402 @ 7.0% cap · market cap 3.28%
Second Best
—
—
no second resolved use
Theoretical Best
Office A
$2.22M
$1.94M – $2.59M
NOI $155,481 @ 7.0% cap · market cap 8.88%
Zoning and permitted uses should be independently verified with authorities.
How Realmo checks its estimates
Property Analytics
Unlock full access to Insights
Subscribe to Realmo Intelligence
Open Analytics
Current Use
Location Intelligence
Trade Area within ½ mile
1,160
Businesses Nearby
Explore this area
Business Placement
Demographics for 32118, FL
17,906
Population
16,390
Households
1.1
Avg Household Size
58
Median Age
31%
College-Educated
94%
High-School Grad
4.2 sq mi
ZIP Area
4,263
Density / Sq Mi
$60,418
Median Household Income
$36,153
Median Earnings
$1,283
Median Rent
$339,500
Median Home Value
Check the figures for this property
Cap Rate, Value Estimation, Potential NOI and more
View Realmo Analytics
Market
Vacancy Rate% for Multifamily in South region


Frequently Asked Questions
What type of property is this?
Multifamily property - Four rental properties near the beach, ideal for investors.
Where is this multifamily property located?
The property is located at 502 N Halifax Avenue Daytona Beach, FL.
What is the asking price?
The asking price for this property is $1,750,000.
What are key features of this property?
This property features: Four rental income properties offered as a package deal.; Prime beachside location in Daytona Beachside.; Completely upgraded from foundation to roof.


