Two-Unit Duplex with Wood
For Sale
$725,000
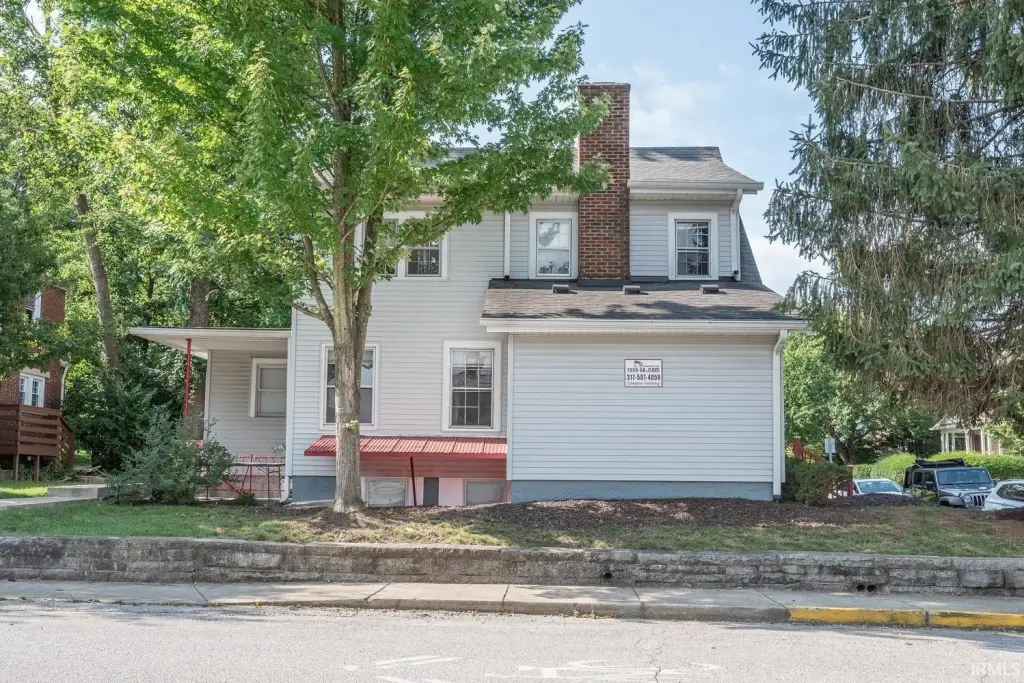
501 S Highland Avenue, Bloomington, IN 47401
INVESTMENT, Two Story, Bloomington, IN
Property Size2,321 SF
Lot Size0.01 Acres
Price / SF$312.37
Days on Market55
Property Features for 501 S Highland Avenue
General Information
Property type
Residential Multi Family
Property subtype
Duplex
Bedrooms
8
Bathrooms
2
Full bathrooms
2
Rooms
Bedroom 1, Bathroom 2, Bedroom 6, Bedroom 8, Bedroom 4, Bedroom 2, Bedroom 3, Bedroom 5, Bedroom 7, Bathroom 1, Basement
Parking
1
Subdivision
Southeast Bloomington City
Lot features
Irregular
Elementary school
Rogers/Binford
Middle school
Jackson Creek
High school
Bloomington South
Elementary school district
Monroe County Community School C
Middle school district
Monroe County Community School C
High school district
Monroe County Community School C
Directions
GPS Friendly
Standard status
Active
APN
53-08-03-207-012.000-009
Size
2,321 SF
Lot size
0.01 Acres
Taxes and HOA fees
Tax Year
2026
Tax Description
015-45430-00 WILLIAMS N1/2 LOT 8 & PT LOT 7 PLATS
Legal Description
015-45430-00 WILLIAMS N1/2 LOT 8 & PT LOT 7 PLATS
Utilities
Cooling system
Central Air
Building Details
Year built
1925
Floors in Building
2
Number of units
2
Flooring type
Wood
Architectural style
Other
Listing Agency:
FC Tucker/Bloomington REALTORS
(812) 336-7300
Listed By:
Jeff Franklin · License #RB14023367
(812) 360-5333
Added: Aug 14
Changed: Sep 12
Last Checked: Oct 7 at 2:06AM
MLS# 202633293
Copyright © 2026 Indiana Uplands Realtor® Association. All rights reserved. All information provided by the listing agent/broker is deemed reliable but is not guaranteed and should be independently verified.
Investment Insights
Based on property information with market context.
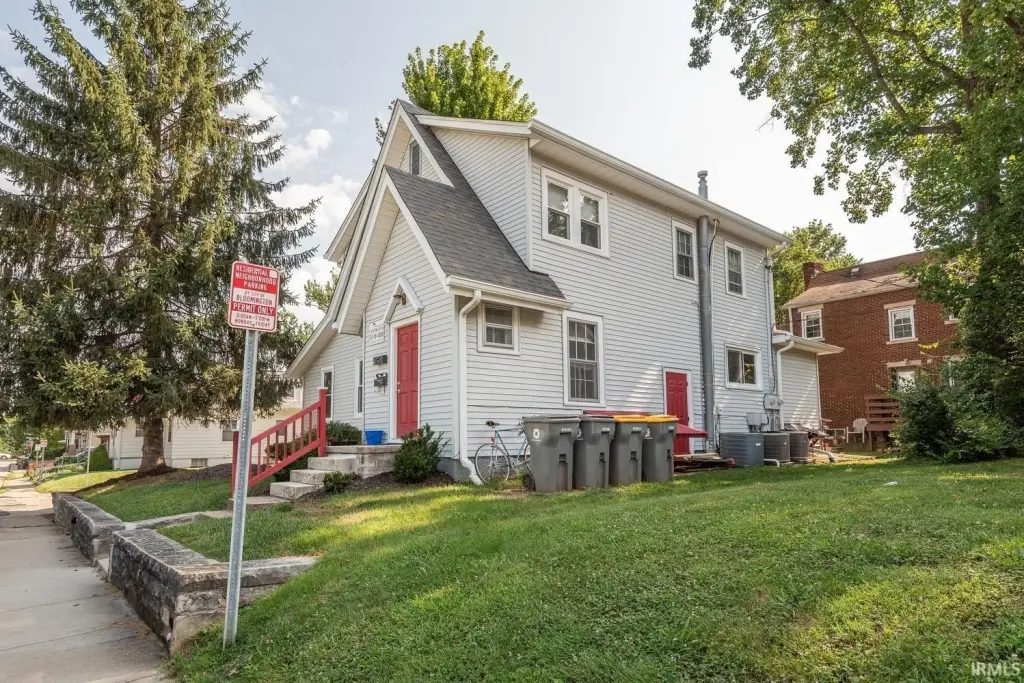
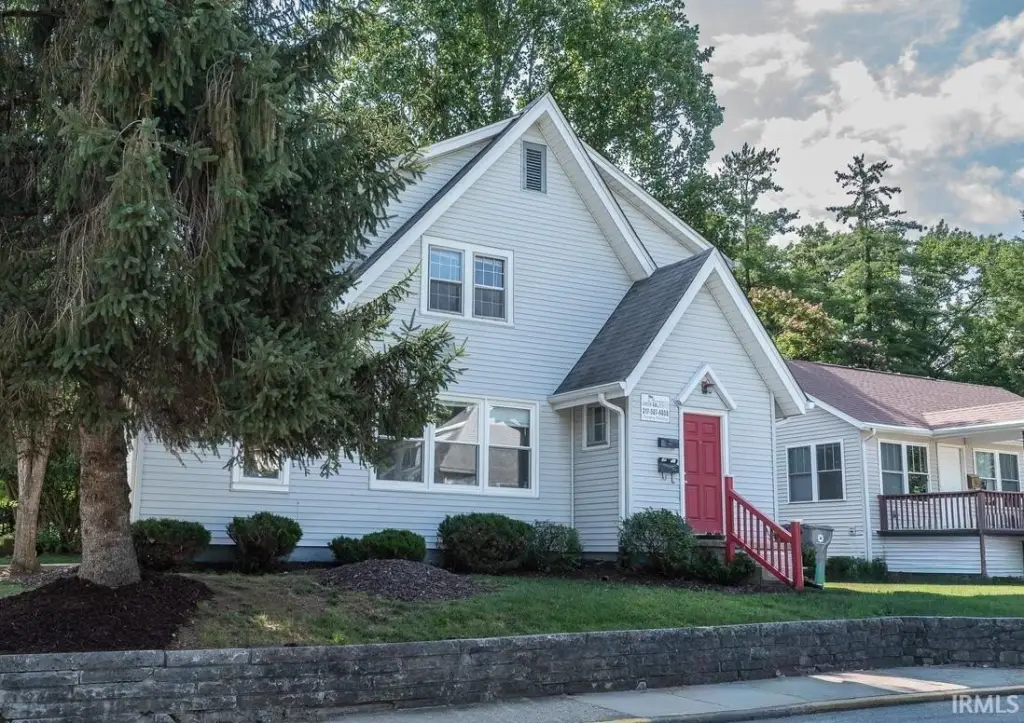
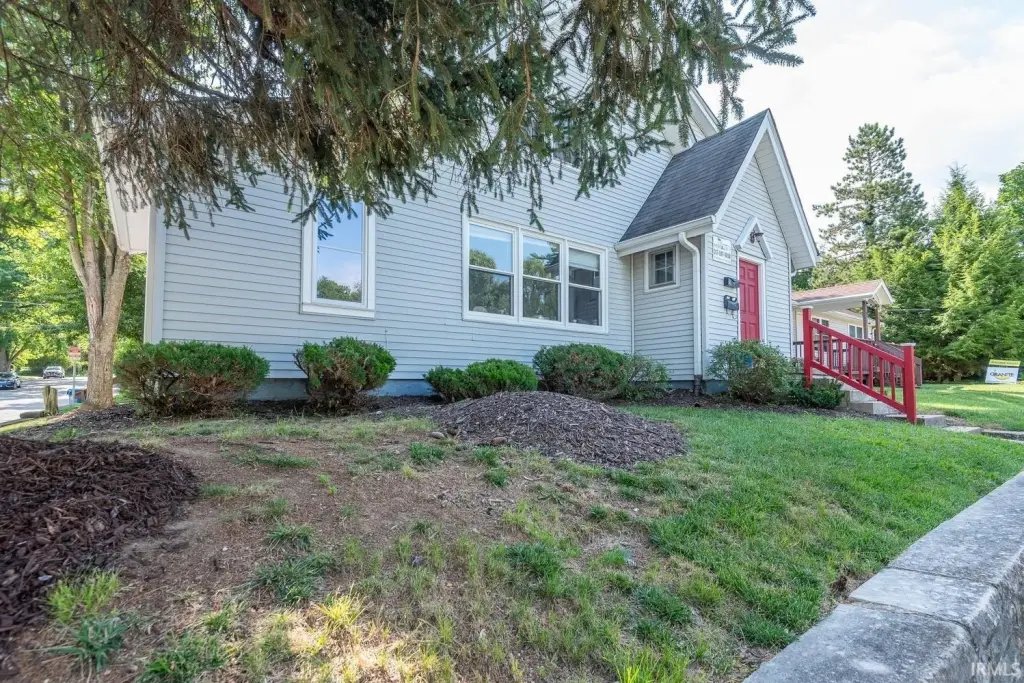
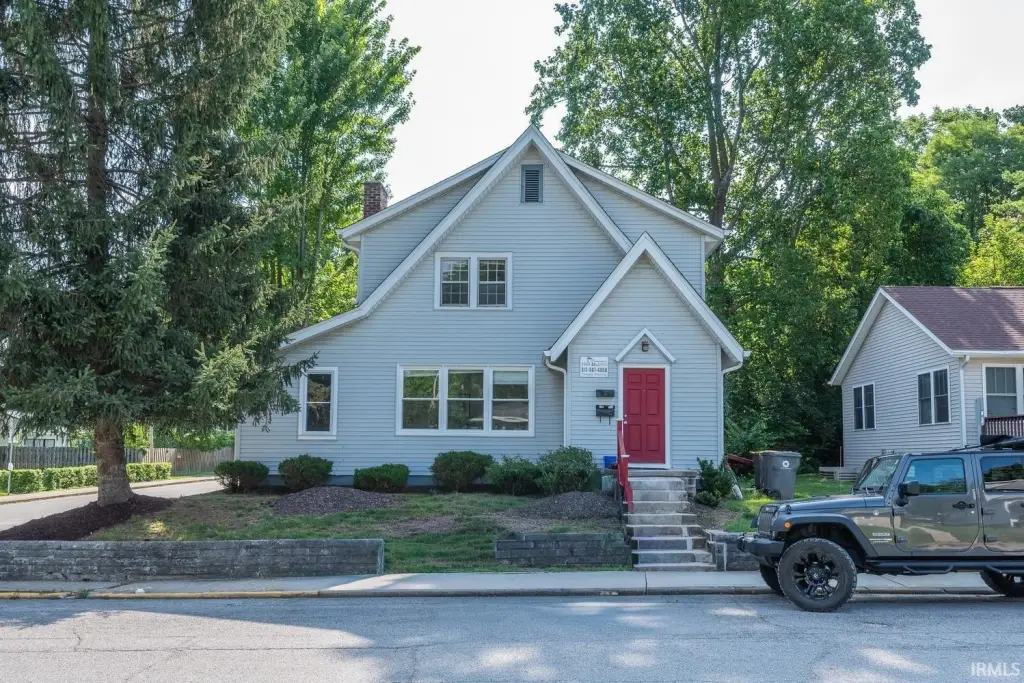
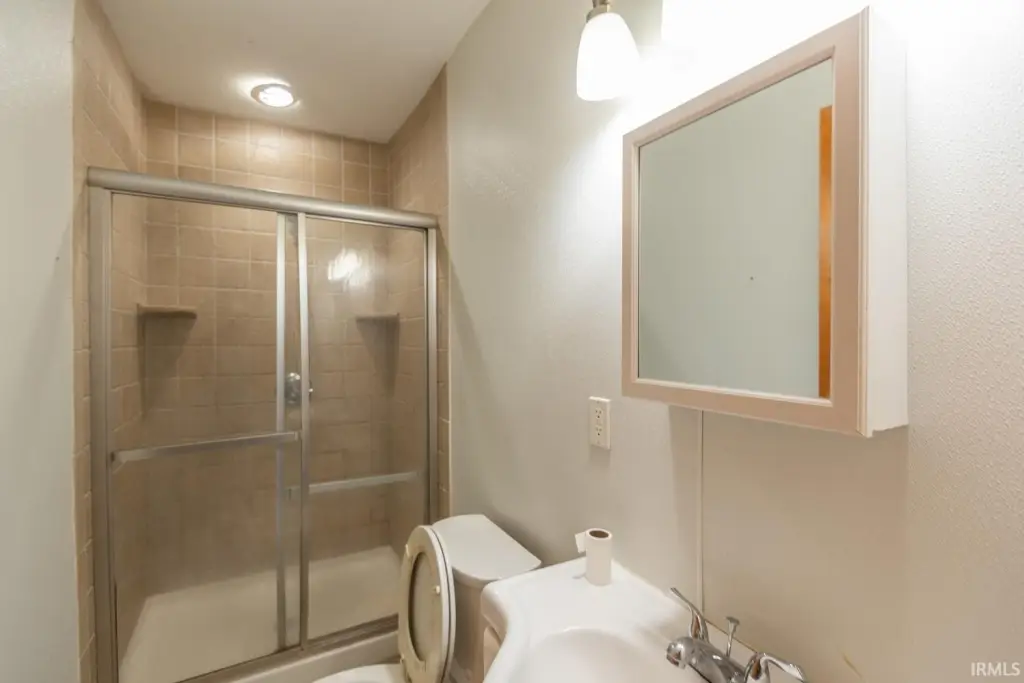
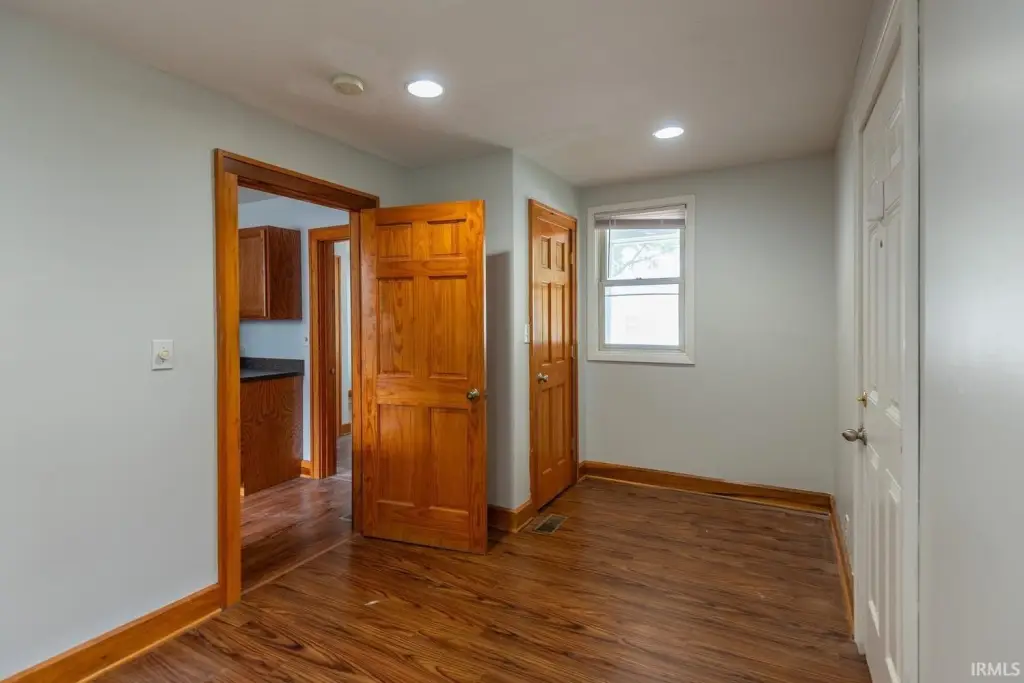
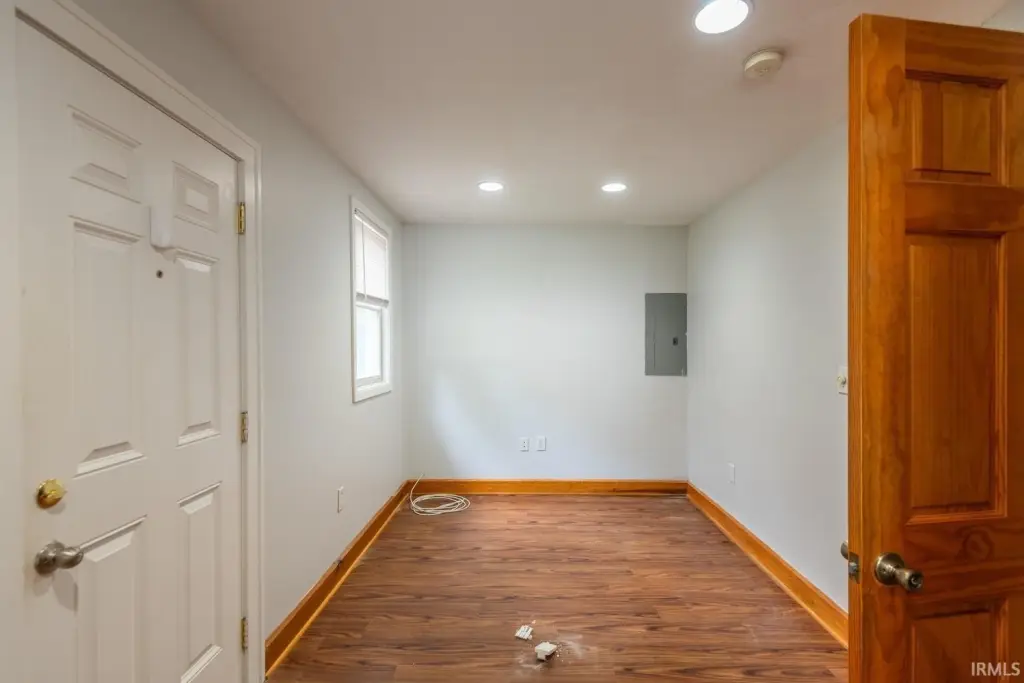
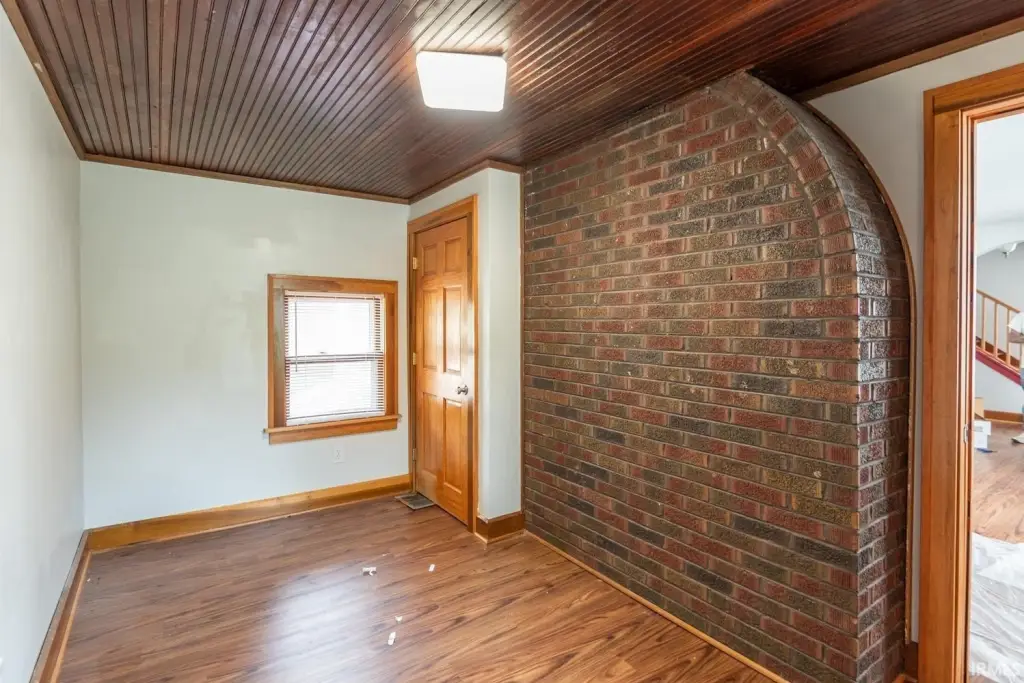
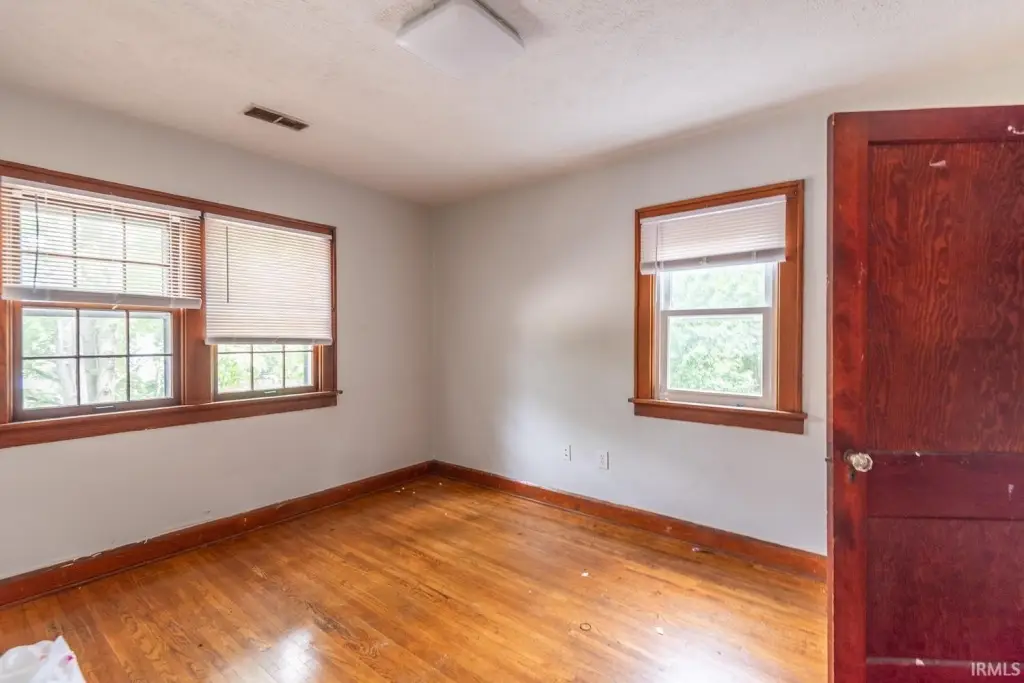
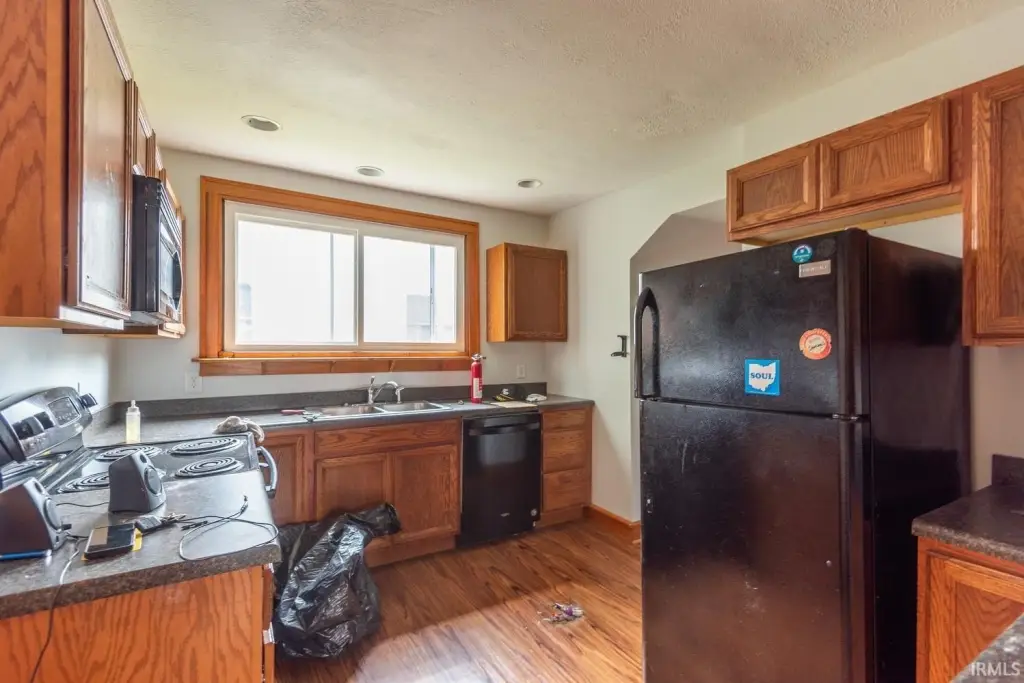
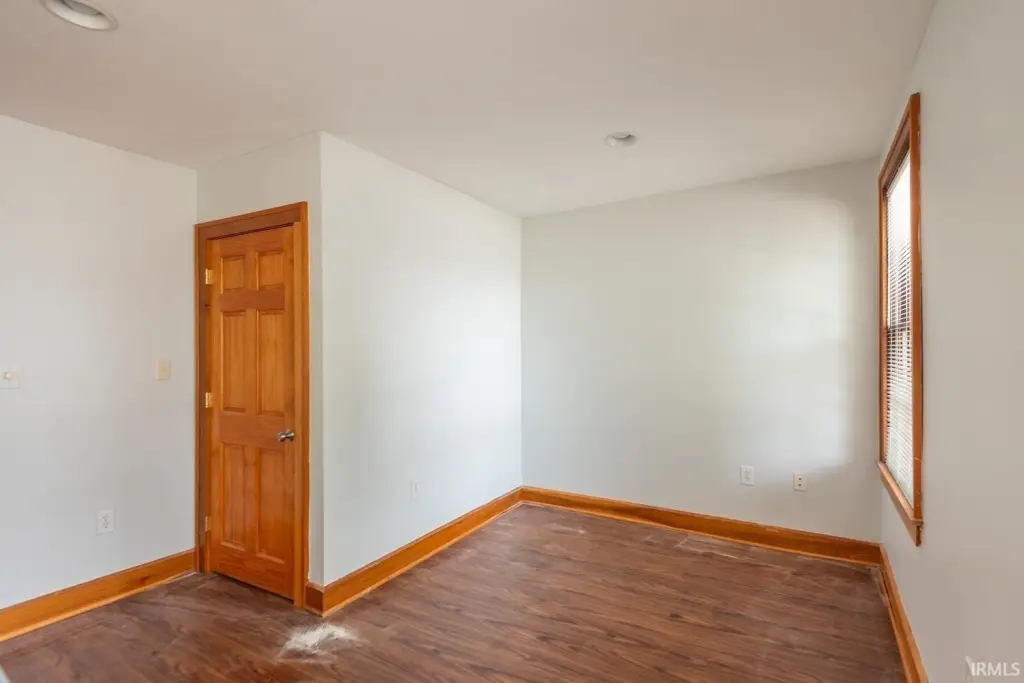
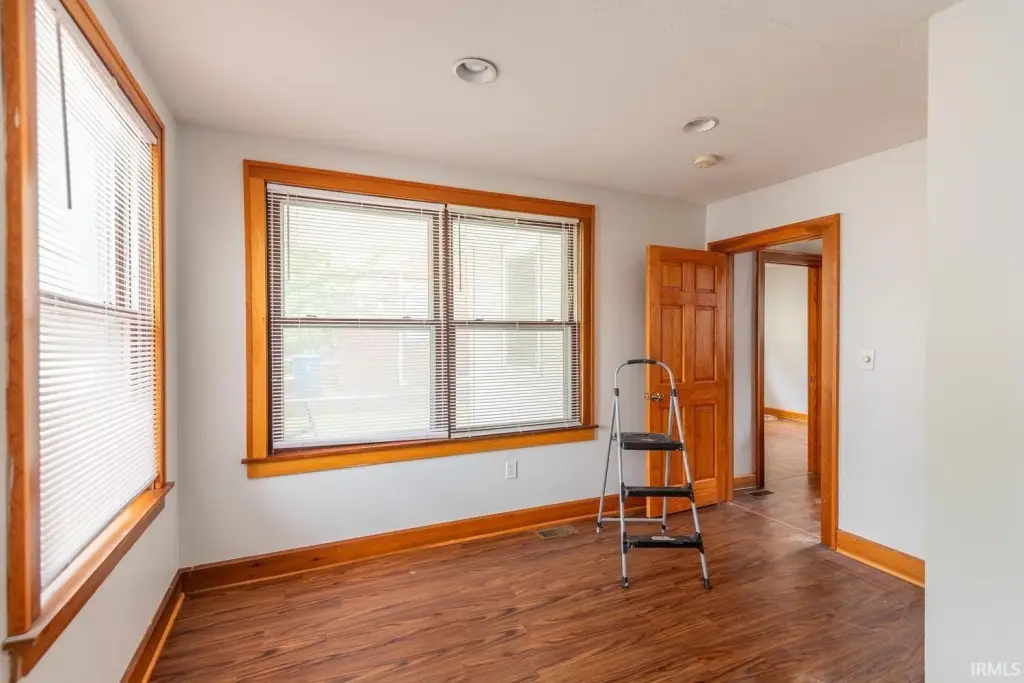
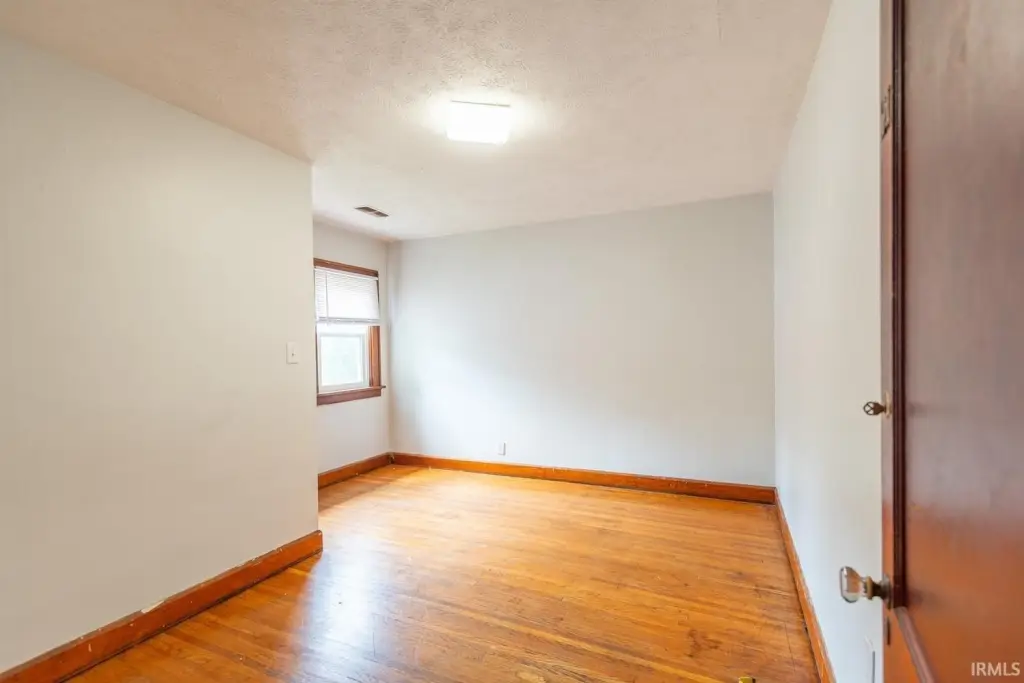
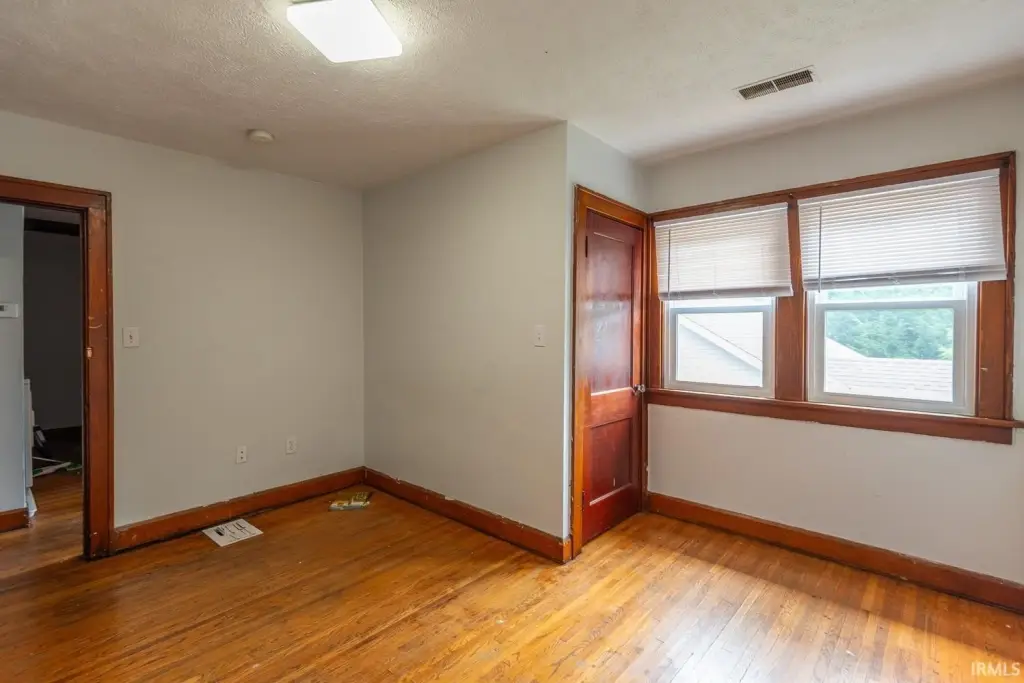
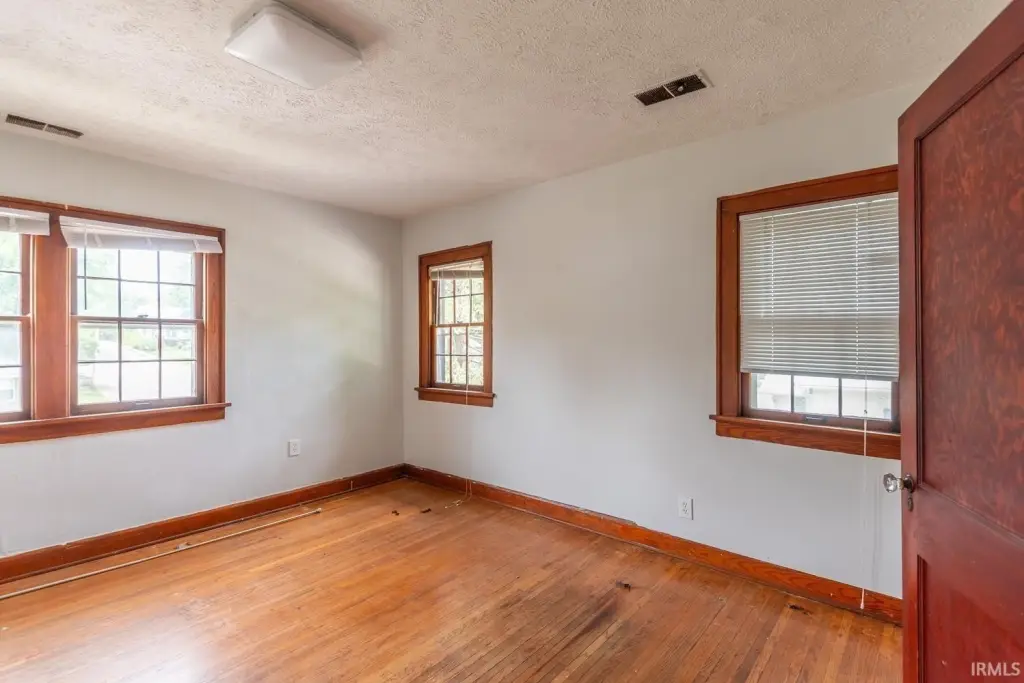
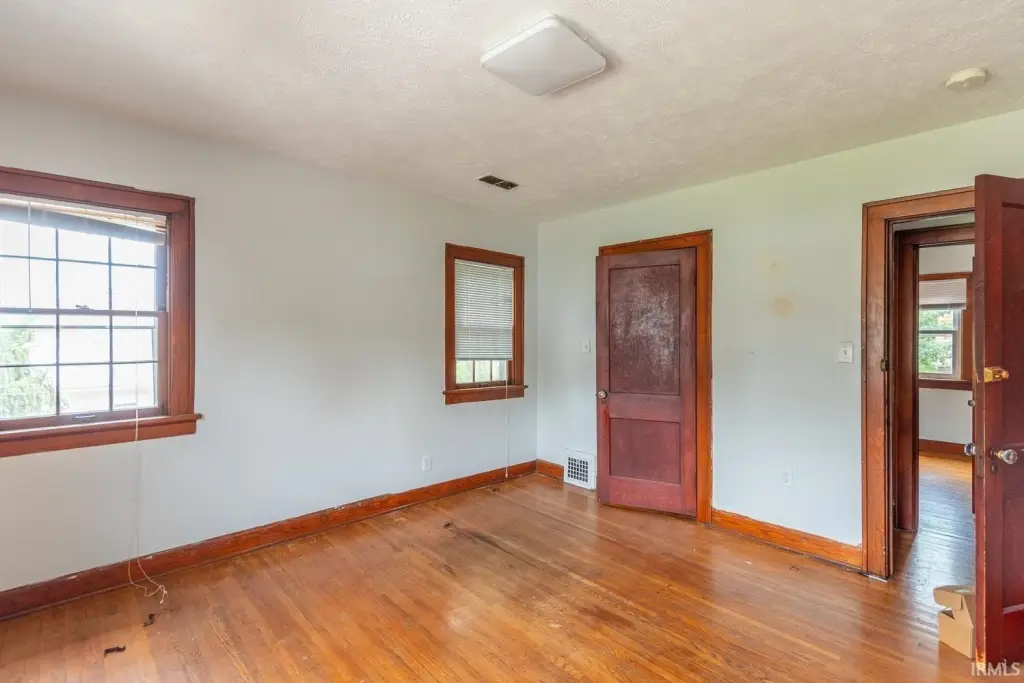
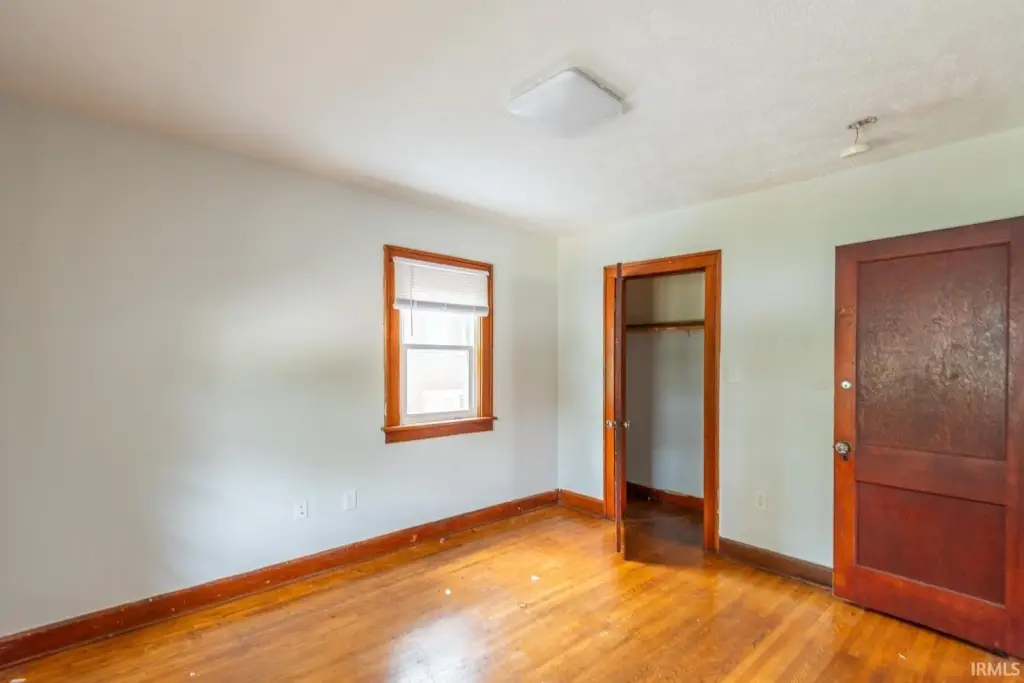
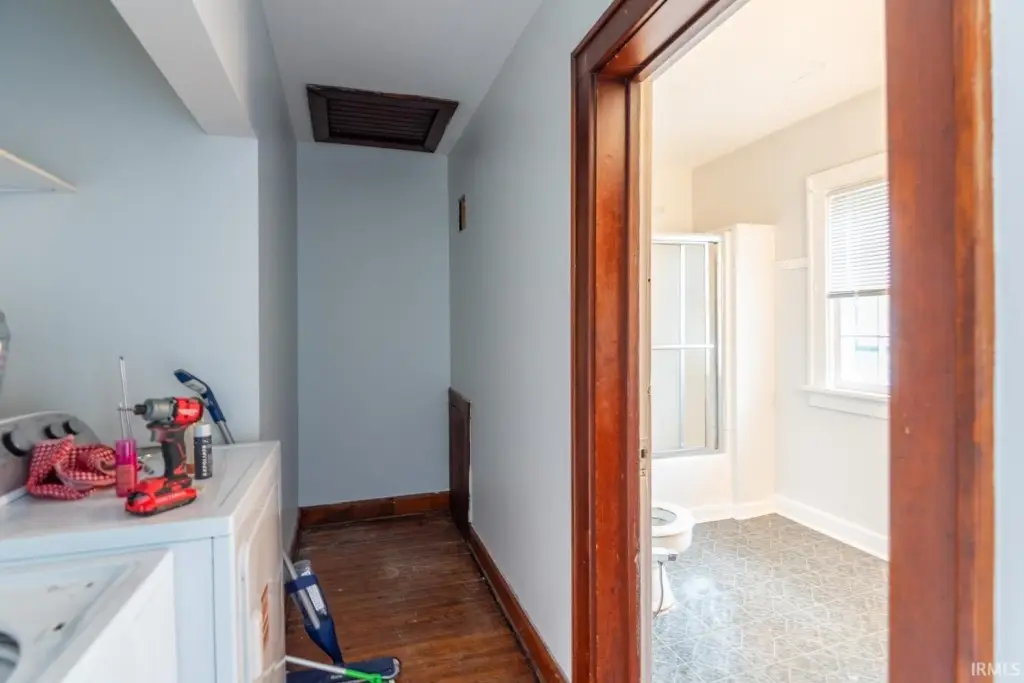
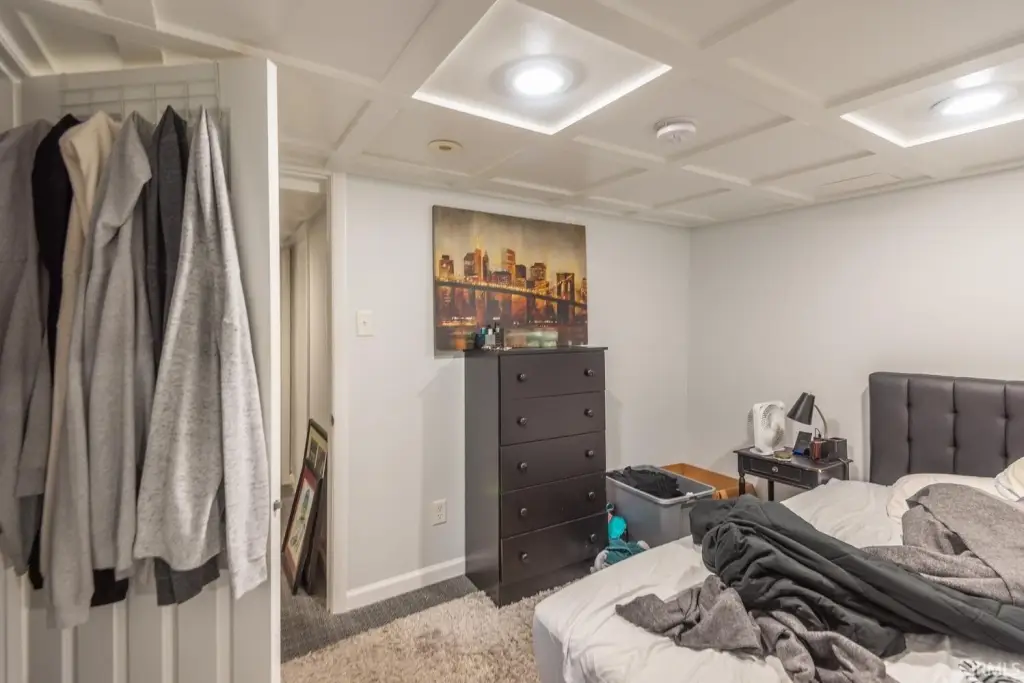
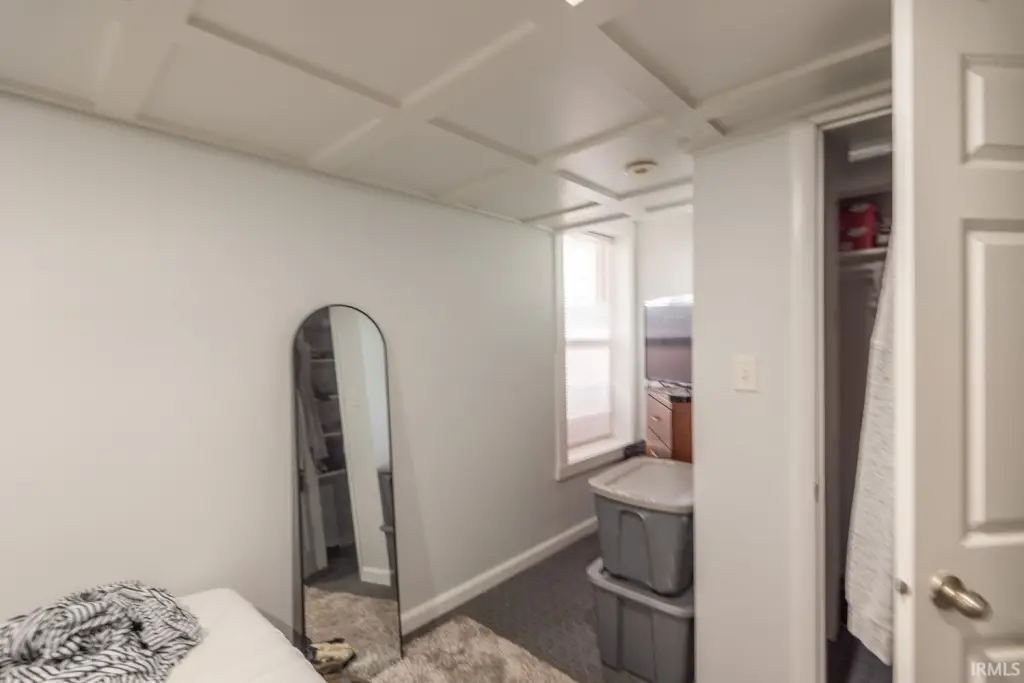
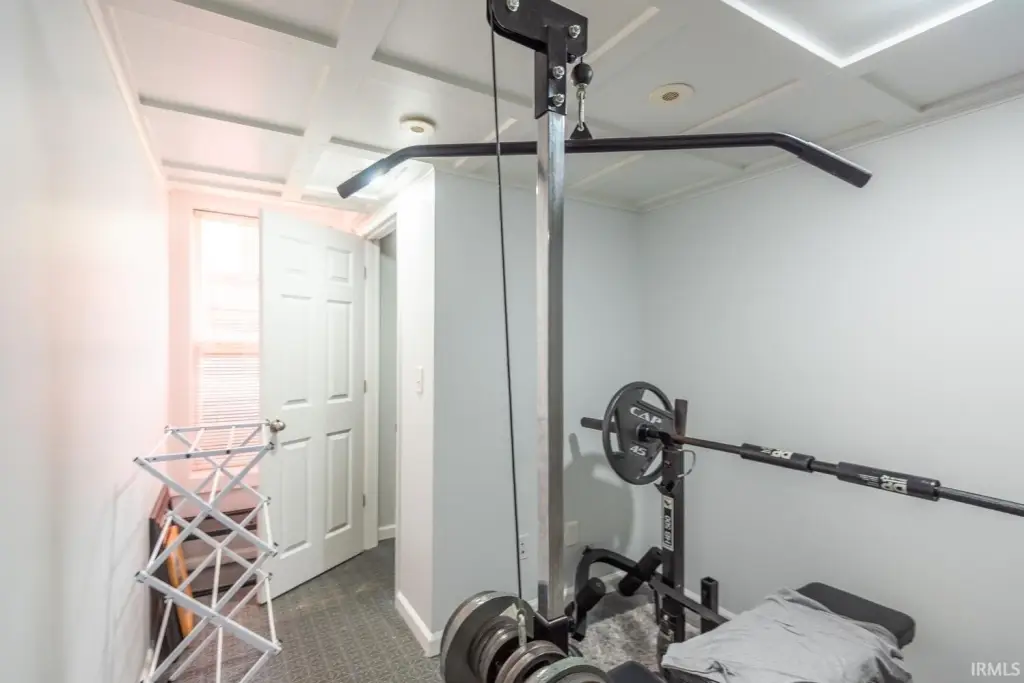
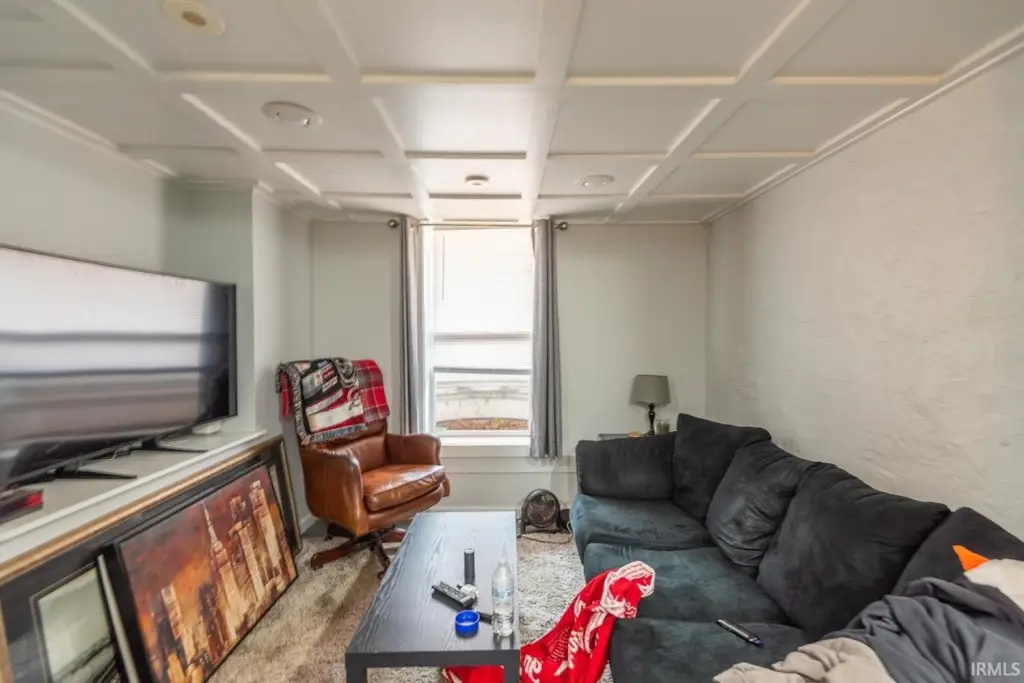
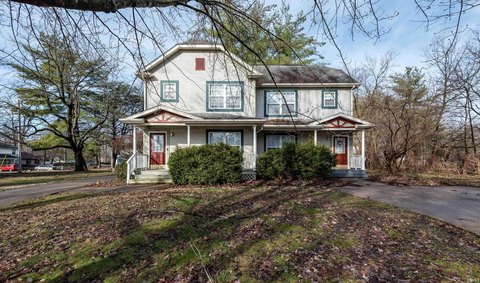
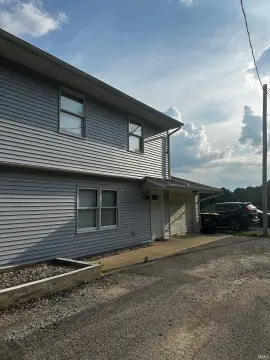
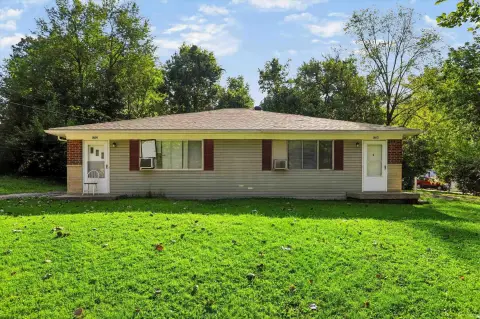
This 2,321-square-foot duplex, built in 1925, contains two separate apartments with wood flooring and central air. The upper-level residence includes six bedrooms, two full bathrooms, and a kitchen, while the lower apartment offers two bedrooms, one bathroom, and north-side entry access. The property carries a permit for eight occupants.
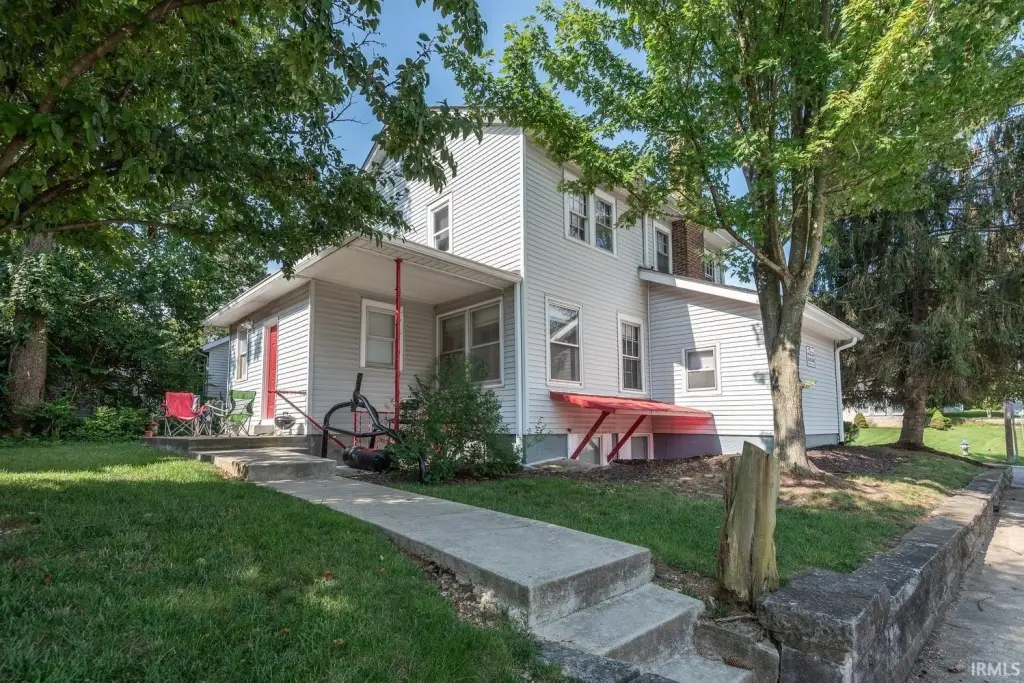
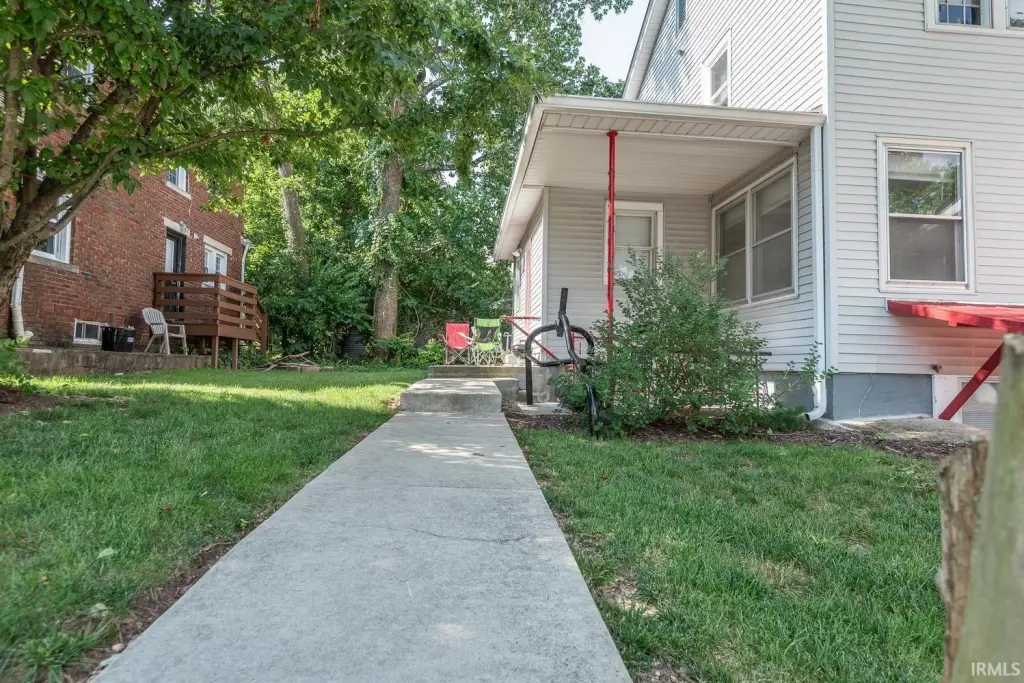
Located at 501 S Highland Avenue in Bloomington, the home sits on a corner lot south of Indiana University. Restaurants, coffee shops, the university bookstore, and campus activities are nearby. The combination of an eight-bedroom configuration, two-unit layout, and proximity to campus provides a clearly defined residential income property profile.
Located at 501 S Highland Avenue in Bloomington, the home sits on a corner lot south of Indiana University. Restaurants, coffee shops, the university bookstore, and campus activities are nearby. The combination of an eight-bedroom configuration, two-unit layout, and proximity to campus provides a clearly defined residential income property profile.
Key Highlights
- 2,321‑square‑foot duplex built in 1925
- Permit for eight occupants
- Upper‑level unit with six bedrooms and two full bathrooms
Financial Insights
Estimated NOI and Cap Rate
NOI / Yr
$20,859
Cap Rate
2.88%
Suggested Prices Based on Cap Rates
Cap Rate 5%
$417,180
$417.2K
Cap Rate 7%
$297,986
$298.0K
Cap Rate 9%
$231,767
$231.8K
Market Conditions
NOI Build-Up for 2,321 SF
Gross rent
$31.5K $13.56/SF
− Vacancy
−$1.7K −$0.72/SF
EGI
$29.8K $12.84/SF
− OpEx
−$8.9K −$3.85/SF
NOI
$20.9K $8.99/SF
Area
Monroe County, IN
Vacancy
5.32%
Lease Rate
$13.56 /SF/Yr
Expense Ratio
30.00%
Simulate Cap Rate and NOI
Suggested Prices Based on Cap Rates
Cap Rate 5%
$417,180
Cap Rate 7%
$297,986
Cap Rate 9%
$231,767
Alternative Uses
Best Use
Multifamily LT 5
$298.0K
$260.7K – $347.7K
NOI $20,859 @ 7.0% cap · market cap 2.88%
Second Best
Apartment 5plus
$270.6K
$236.8K – $315.7K
NOI $18,944 @ 7.0% cap · market cap 2.61%
Theoretical Best
Office A
$453.6K
$396.9K – $529.2K
NOI $31,753 @ 7.0% cap · market cap 4.38%
Zoning and permitted uses should be independently verified with authorities.
Property Analytics
Unlock full access to Insights
Subscribe to Realmo Intelligence
Open Analytics
Current Use
Lease Details
2
Residential units
Location Intelligence
Trade Area within ½ mile
986
Businesses Nearby
Explore this area
Business Placement
Demographics for 47401, IN
41,225
Population
21,162
Households
1.9
Avg Household Size
35
Median Age
62%
College-Educated
95%
High-School Grad
82.6 sq mi
ZIP Area
499
Density / Sq Mi
$65,643
Median Household Income
$34,279
Median Earnings
$1,181
Median Rent
$333,100
Median Home Value
Check the figures for this property
Cap Rate, Value Estimation, Potential NOI and more
View Realmo Analytics
Market
Vacancy Rate% for Multifamily in Midwest region

Questions? Ask Rey
Realmo’s AI knows this listing — price, zoning, demand, history. Ask anything.




Frequently Asked Questions
What type of property is this?
Duplex - Corner-lot duplex near Indiana University with central air, wood flooring, and separate upper- and lower-level apartments.
Where is this duplex located?
The property is located at 501 S Highland Avenue Bloomington, IN.
What is the asking price?
The asking price for this property is $725,000.
What are key features of this property?
This property features: 2,321‑square‑foot duplex built in 1925; Permit for eight occupants; Upper‑level unit with six bedrooms and two full bathrooms