Multi-Tenant Neighborhood Retail
For Sale
$18,425,000
5007-6001 N 10th Street McAllen, McAllen, TX 78501
Multi-tenant neighborhood center plus a leased single-tenant retail building for diversified income within a shopping center portfolio.
Property Size91,394 SF
Days on Market114
Property Features for 5007-6001 N 10th Street McAllen
General Information
Standard status
Active
Size
91,394 SF
Property subtype
Commercial
Taxes and HOA fees
Annual Taxes
$228,664
Building Details
Building Size
91,394 SF
Year Built
2002
Listing Agency:
NAI STX
Listed By:
Laura Liza Paz
Source:
Primeluxuryrealestate
Added: Jun 23
Changed: Sep 30
Last Checked: Oct 13 at 12:18AM
Displayed information is deemed reliable but is not guaranteed and should be independently verified. All listing content including descriptions, pricing, images are the copyrighted material of NAI STX
Investment Insights
Based on property information with market context.
The offering includes two retail properties within the Town & Country Shopping Center portfolio. The primary asset is an 86,396 SF multi-tenant neighborhood center at 5007 N. 10th Street, described as having a high occupancy rate under triple-net leases. Tenant presence includes Office Depot, Edible Arrangements, El Divino, Luka, and Salciados Seafood Restaurant, supporting a diverse retail and restaurant mix.
A second property is located at 6001 N. 10th Street. This 4,998 SF single-tenant building was built in 2005 on 0.82 acres and is currently leased to the North 10th Street Animal Hospital. The property is described as located less than half a mile from the main center, with frontage along N. 10th Street.
For buyers seeking a retail investment with an established tenant base, the combination of a larger multi-tenant center and a nearby single-tenant building provides two income-producing components within the same portfolio. For brokers and tenants, the presence of nationally and regionally recognized tenants and an existing operational tenant mix can support straightforward merchandising and ongoing neighborhood shopping activity.
A second property is located at 6001 N. 10th Street. This 4,998 SF single-tenant building was built in 2005 on 0.82 acres and is currently leased to the North 10th Street Animal Hospital. The property is described as located less than half a mile from the main center, with frontage along N. 10th Street.
For buyers seeking a retail investment with an established tenant base, the combination of a larger multi-tenant center and a nearby single-tenant building provides two income-producing components within the same portfolio. For brokers and tenants, the presence of nationally and regionally recognized tenants and an existing operational tenant mix can support straightforward merchandising and ongoing neighborhood shopping activity.
Key Highlights
- Town & Country Shopping Center retail portfolio with two properties totaling 6.8 acres
- 5007 N. 10th Street: 86,396 SF multi‑tenant neighborhood center built in 2002 under triple‑net leases
- Anchored by national/regional tenants including Office Depot and other established retail and dining tenants
Financial Insights
Estimated NOI and Cap Rate
NOI / Yr
$1,304,492
Cap Rate
7.08%
Suggested Prices Based on Cap Rates
Cap Rate 5%
$26,089,840
$26.1M
Cap Rate 7%
$18,635,600
$18.6M
Cap Rate 9%
$14,494,356
$14.5M
Market Conditions
NOI Build-Up for 91,394 SF
Gross rent
$1.97M $21.60/SF
− Vacancy
−$110.6K −$1.21/SF
EGI
$1.86M $20.39/SF
− OpEx
−$559.1K −$6.12/SF
NOI
$1.30M $14.27/SF
Area
McAllen, TX
Vacancy
5.60%
Lease Rate
$21.60 /SF/Yr
Expense Ratio
30.00%
Simulate Cap Rate and NOI
Suggested Prices Based on Cap Rates
Cap Rate 5%
$26,089,840
Cap Rate 7%
$18,635,600
Cap Rate 9%
$14,494,356
Alternative Uses
Best Use
Retail
$18.64M
$16.31M – $21.74M
NOI $1,304,492 @ 7.0% cap · market cap 7.08%
Second Best
—
—
no second resolved use
Theoretical Best
Office A
$24.82M
$21.72M – $28.95M
NOI $1,737,217 @ 7.0% cap · market cap 9.43%
Zoning and permitted uses should be independently verified with authorities.
How Realmo checks its estimates
Property Analytics
Unlock full access to Insights
Subscribe to Realmo Intelligence
Open Analytics
Current Use
Location Intelligence
Trade Area within ½ mile
1,143
Businesses Nearby
Balanced
Demand for This Use
Explore this area
Business Placement
Demographics for 78501, TX
60,817
Population
24,807
Households
2.5
Avg Household Size
37
Median Age
27%
College-Educated
77%
High-School Grad
15.5 sq mi
ZIP Area
3,924
Density / Sq Mi
$49,451
Median Household Income
$29,092
Median Earnings
$943
Median Rent
$149,000
Median Home Value
Check the figures for this property
Cap Rate, Value Estimation, Potential NOI and more
View Realmo Analytics
Market
Vacancy Rate% for Retail in South region

Questions? Ask Rey
Realmo’s AI knows this listing — price, zoning, demand, history. Ask anything.


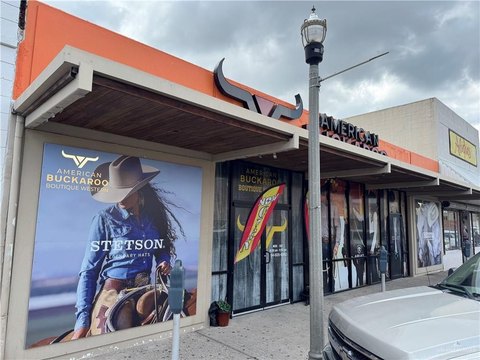

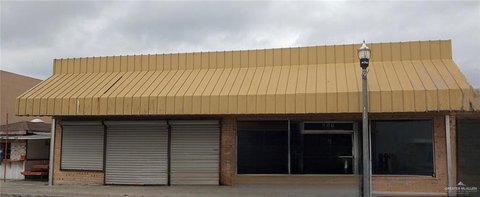

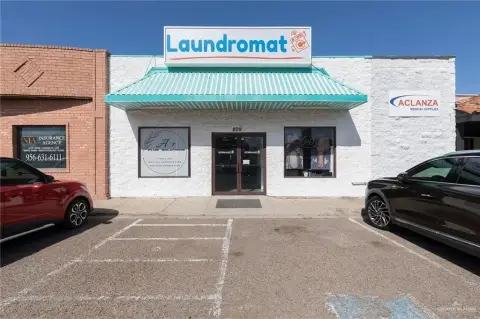
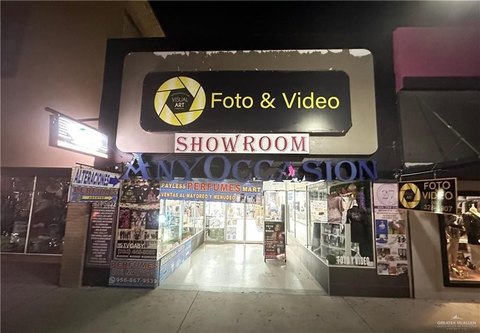
Similar Off Market Nearby
- Cubbies McAllen — 3428 N 10th St suite 100, McAllen, TX 78501
- Northcross Shopping Center — 4005 N 10th St, McAllen, TX 78504
- Market at Nolana — 2800 W Nolana Ave, McAllen, TX 78504
- Nolana West — 4201 N 23rd St, McAllen, TX 78504
- Mercado District - Food Hall | Shoppes | Live Music — 4400 N 23rd St, McAllen, TX 78504
Frequently Asked Questions
What type of property is this?
Shopping center - Multi-tenant neighborhood center plus a leased single-tenant retail building for diversified income within a shopping center portfolio.
Where is this shopping center located?
The property is located at 5007-6001 N 10th Street McAllen McAllen, TX.
What is the asking price?
The asking price for this property is $18,425,000.
What are key features of this property?
This property features: Town & Country Shopping Center retail portfolio with two properties totaling 6.8 acres; 5007 N. 10th Street: 86,396 SF multi‑tenant neighborhood center built in 2002 under triple‑net leases; Anchored by national/regional tenants including Office Depot and other established retail and dining tenants


