Mixed-Use Property with
For Sale
$2,950,000
5001 5001-5005 New Hampshire Ave NW, Washington, DC 20011
Mixed-use property with on-site parking and flexible zoning.
Property Size13,086 SF
Price / SF$225.43
Days on Market195
Property Features for 5001 5001-5005 New Hampshire Ave NW
General Information
Standard status
Active
Size
13,086 SF
Building Details
Year Built
1937
Listing Agency:
Feldman Ruel Urban Property Advisors
Listed By:
Ian Ruel · License #DC BR200201389
(202) 318-6800
Source:
Kandorre
Added: Mar 27
Changed: Sep 30
Last Checked: Oct 5 at 10:26PM
Displayed information is deemed reliable but is not guaranteed and should be independently verified. All listing content including descriptions, pricing, images are the copyrighted material of Feldman Ruel Urban Property Advisors
Investment Insights
Based on property information with market context.
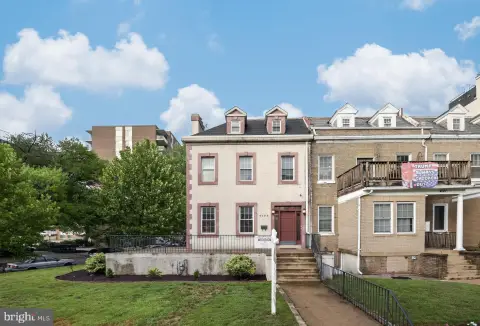
This mixed-use property at 5001-5005 New Hampshire Avenue NW offers an opportunity for investors or owner-users. The property features 17 on-site parking spaces, including two ADA spaces. The commercial space, consisting of the sublevel, first level, and the majority of the second level, is currently occupied by New Hampshire Medical Supply, which is expected to vacate by year-end 2026. The remainder of the second level contains a tenanted, three-bedroom, two-bathroom multifamily unit. The property is situated at multiple hard corners, including a signalized intersection at New Hampshire Avenue NW and Farragut Street NW, providing visibility along a highly trafficked corridor. The flexible MU-3A zoning allows for a range of by-right uses, including retail, office, multifamily, and hospitality. The property has a total size of 13086 square feet.
Key Highlights
- Excellent visibility at a signalized intersection of New Hampshire Avenue NW & Farragut Street NW along a highly trafficked corridor.
- 17 on‑site parking spaces, including two ADA spaces, a scarce amenity in Washington, D.C.
- Flexible MU‑3A zoning allows a wide range of by‑right uses.
Financial Insights
Estimated NOI and Cap Rate
NOI / Yr
$259,103
Cap Rate
8.78%
Suggested Prices Based on Cap Rates
Cap Rate 5%
$5,182,060
$5.2M
Cap Rate 7%
$3,701,471
$3.7M
Cap Rate 9%
$2,878,922
$2.9M
Market Conditions
NOI Build-Up for 13,086 SF
Gross rent
$471.1K $36.00/SF
− Vacancy
−$56.5K −$4.32/SF
EGI
$414.6K $31.68/SF
− OpEx
−$155.5K −$11.88/SF
NOI
$259.1K $19.80/SF
Area
ZIP 20011
Vacancy
12.00%
Lease Rate
$36.00 /SF/Yr
Expense Ratio
37.50%
Simulate Cap Rate and NOI
Suggested Prices Based on Cap Rates
Cap Rate 5%
$5,182,060
Cap Rate 7%
$3,701,471
Cap Rate 9%
$2,878,922
Alternative Uses
Best Use
Mixed Use
$3.70M
$3.24M – $4.32M
NOI $259,103 @ 7.0% cap · market cap 8.78%
Second Best
—
—
no second resolved use
Theoretical Best
Office A
$6.76M
$5.91M – $7.88M
NOI $472,943 @ 7.0% cap · market cap 16.03%
Zoning and permitted uses should be independently verified with authorities.
Property Analytics
Unlock full access to Insights
Subscribe to Realmo Intelligence
Open Analytics
Current Use
Location Intelligence
Trade Area within ½ mile
935
Businesses Nearby
Explore this area
Business Placement
Demographics for 20011, DC
67,815
Population
29,658
Households
2.3
Avg Household Size
37
Median Age
55%
College-Educated
90%
High-School Grad
5.4 sq mi
ZIP Area
12,558
Density / Sq Mi
$108,377
Median Household Income
$69,147
Median Earnings
$1,636
Median Rent
$722,200
Median Home Value
Check the figures for this property
Cap Rate, Value Estimation, Potential NOI and more
View Realmo Analytics

Questions? Ask Rey
Realmo’s AI knows this listing — price, zoning, demand, history. Ask anything.




Frequently Asked Questions
What type of property is this?
Mixed-use property - Mixed-use property with on-site parking and flexible zoning.
Where is this mixed-use property located?
The property is located at 5001 5001-5005 New Hampshire Ave NW Washington, DC.
What is the asking price?
The asking price for this property is $2,950,000.
What are key features of this property?
This property features: Excellent visibility at a signalized intersection of New Hampshire Avenue NW & Farragut Street NW along a highly trafficked corridor.; 17 on‑site parking spaces, including two ADA spaces, a scarce amenity in Washington, D.C.; Flexible MU‑3A zoning allows a wide range of by‑right uses.


