Industrial Manufacturing Facility with Silo
For Sale
$4,250,000
50 June Street Leominster, Leominster, MA 01453
Modern industrial space with multiple loading points, drive-in access, and high ceilings plus material silos for flexible operations.
Property Size28,000 SF
Price / SF$151.79
Days on Market94
Property Features for 50 June Street Leominster
General Information
Standard status
Active
Size
28,000 SF
Total Parking Spaces
29
Zoning
Industrial
Warehouse & Industrial
Clear Height
27 ft
Dock-High Doors
5
Drive-In Doors
1
Heavy Power
Yes
Taxes and HOA fees
Annual Taxes
$14,042
Building Details
Building Size
28,000 SF
Year Built
1996
Listed By:
Sharon Lucido
(508) 643-8166
Source:
Bournetosellrealestate
Added: Jul 4
Changed: Sep 11
Last Checked: Oct 4 at 6:09AM
Displayed information is deemed reliable but is not guaranteed and should be independently verified. All listing content including descriptions, pricing, images are the copyrighted material of Sharon Lucido
Investment Insights
Based on property information with market context.
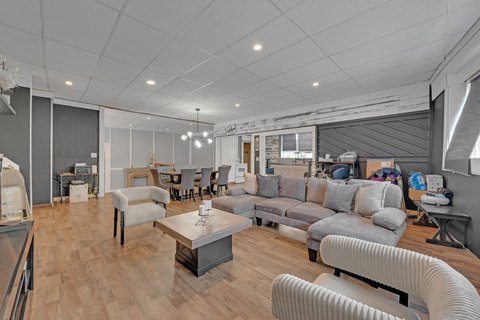
This industrial/manufacturing facility totals approximately 28,000 square feet and combines an original late-1990s building with a newly constructed 75' x 155' addition. The connected layout is open and designed to be customized for a range of operational needs. The addition includes four ADA-compliant restrooms, while ceiling heights vary across the facility, with 22 to 27 feet in the original building and 18 to 21 feet in the new addition. Site and operational improvements include one 10' x 14' drive-in door, five loading docks, and robust 480V three-phase power with a 2,000-amp service. The property also features two large material silos and ample on-site parking with 29 spaces.
Located in business-friendly Leominster, the facility offers convenient access to Route 2 and Route 190, with both described as just minutes away. The property’s setup supports straightforward logistics with multiple dock positions and drive-in capability.
As a move-in-ready option for owner-users or investors, the combination of high clearances, power capacity, and loading infrastructure can accommodate a variety of industrial and light manufacturing uses. The integrated addition and restroom improvements support day-to-day operations and personnel needs, while the existing silo storage adds functionality for processes that require bulk material handling.
Located in business-friendly Leominster, the facility offers convenient access to Route 2 and Route 190, with both described as just minutes away. The property’s setup supports straightforward logistics with multiple dock positions and drive-in capability.
As a move-in-ready option for owner-users or investors, the combination of high clearances, power capacity, and loading infrastructure can accommodate a variety of industrial and light manufacturing uses. The integrated addition and restroom improvements support day-to-day operations and personnel needs, while the existing silo storage adds functionality for processes that require bulk material handling.
Key Highlights
- Approximately 28,000 SF industrial/manufacturing space with an open‑layout design for operational flexibility
- New 75' x 155' addition includes four ADA‑compliant restrooms and connects to the original late‑1990s building
- Ceiling heights range from 18–21 ft in the new addition and 22–27 ft in the original building
Financial Insights
Estimated NOI and Cap Rate
NOI / Yr
$255,604
Cap Rate
6.01%
Suggested Prices Based on Cap Rates
Cap Rate 5%
$5,112,080
$5.1M
Cap Rate 7%
$3,651,486
$3.7M
Cap Rate 9%
$2,840,044
$2.8M
Market Conditions
NOI Build-Up for 28,000 SF
Gross rent
$386.4K $13.80/SF
− Vacancy
−$21.3K −$0.76/SF
EGI
$365.1K $13.04/SF
− OpEx
−$109.5K −$3.91/SF
NOI
$255.6K $9.13/SF
Area
Worcester County, MA
Vacancy
5.50%
Lease Rate
$13.80 /SF/Yr
Expense Ratio
30.00%
Simulate Cap Rate and NOI
Suggested Prices Based on Cap Rates
Cap Rate 5%
$5,112,080
Cap Rate 7%
$3,651,486
Cap Rate 9%
$2,840,044
Alternative Uses
Best Use
Industrial
$3.65M
$3.20M – $4.26M
NOI $255,604 @ 7.0% cap · market cap 6.01%
Second Best
—
—
no second resolved use
Theoretical Best
Office A
$9.56M
$8.37M – $11.16M
NOI $669,312 @ 7.0% cap · market cap 15.75%
Zoning and permitted uses should be independently verified with authorities.
Property Analytics
Unlock full access to Insights
Subscribe to Realmo Intelligence
Open Analytics
Current Use
Lease Details
27 ft
Clear height
5
Dock-high doors
1
Drive-in doors
Yes
Heavy power
Location Intelligence
Trade Area within ½ mile
469
Businesses Nearby
Explore this area
Business Placement
Demographics for 01453, MA
43,752
Population
18,895
Households
2.3
Avg Household Size
41
Median Age
32%
College-Educated
90%
High-School Grad
26.4 sq mi
ZIP Area
1,657
Density / Sq Mi
$82,098
Median Household Income
$52,247
Median Earnings
$1,282
Median Rent
$345,900
Median Home Value
Check the figures for this property
Cap Rate, Value Estimation, Potential NOI and more
View Realmo Analytics
Market
Vacancy Rate% for Industrial in Northeast region

Questions? Ask Rey
Realmo’s AI knows this listing — price, zoning, demand, history. Ask anything.




Frequently Asked Questions
What type of property is this?
Manufacturing property - Modern industrial space with multiple loading points, drive-in access, and high ceilings plus material silos for flexible operations.
Where is this manufacturing property located?
The property is located at 50 June Street Leominster Leominster, MA.
What is the asking price?
The asking price for this property is $4,250,000.
What are key features of this property?
This property features: Approximately 28,000 SF industrial/manufacturing space with an open‑layout design for operational flexibility; New 75' x 155' addition includes four ADA‑compliant restrooms and connects to the original late‑1990s building; Ceiling heights range from 18–21 ft in the new addition and 22–27 ft in the original building