Modern Four-Unit
For Sale
$1,859,900
4996 NE 26th Ave, Portland, OR 97211
MultiFamily, Portland, OR
Property Size4,304 SF
Lot Size0.07 Acres
Price / SF$432.13
Days on Market50
Property Features for 4996 NE 26th Ave
General Information
Property type
Residential Multi Family
Property subtype
Other
Property condition
Under Construction
Zoning
CM2
Bedrooms
4
Bathrooms
6
Full bathrooms
6
Rooms
Bedroom 2, Bathroom 6, Bathroom 5, Bathroom 4, Bedroom 1, Bathroom 2, Bedroom 4, Bathroom 1, Bedroom 3, Bathroom 3
Subdivision
CONCORDIA
Elementary school
Vernon
Middle school
Vernon
High school
Jefferson
Directions
From NE Martin Luther King Jr Blvd, travel east on NE Alberta St, then turn right onto NE 26th Ave.
Standard status
Active
APN
New Construction
Size
4,304 SF
Lot size
0.07 Acres
Taxes and HOA fees
Tax Description
TWENTY SIXTH AVENUE CONDOMINIUMS, UNITS 1, 2, 3, 4
Legal Description
TWENTY SIXTH AVENUE CONDOMINIUMS, UNITS 1, 2, 3, 4
Utilities
Heating system
Heat Pump (Heating), Forced Air
Cooling system
Heat Pump
Amenities
private entrance
open main level
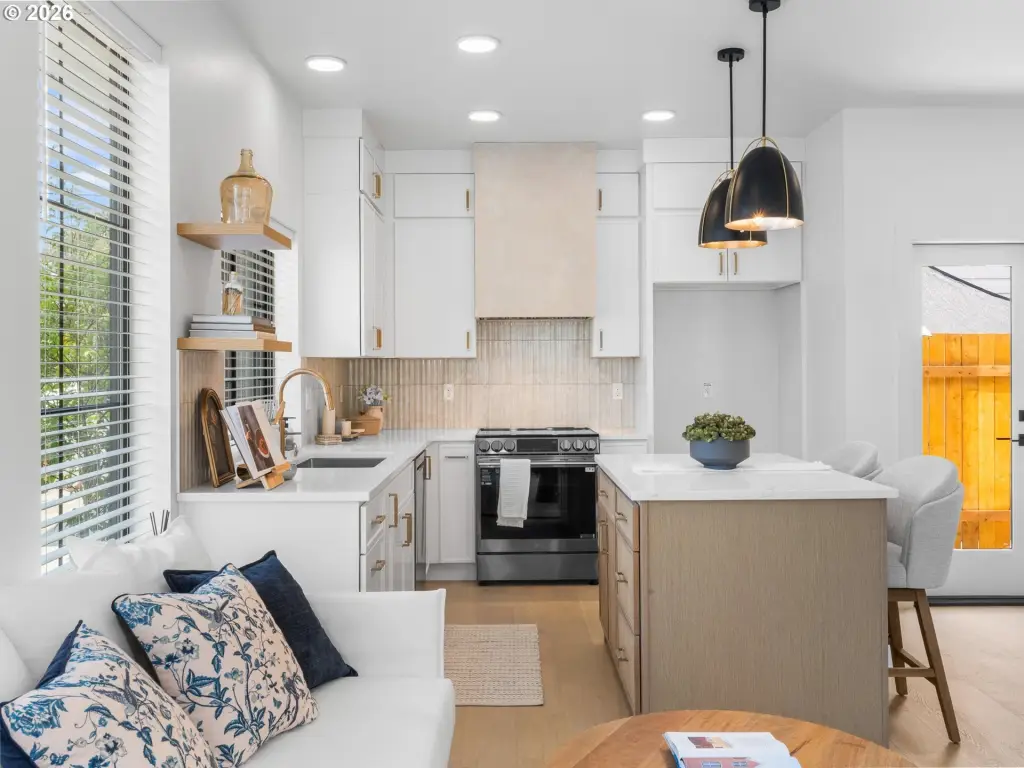
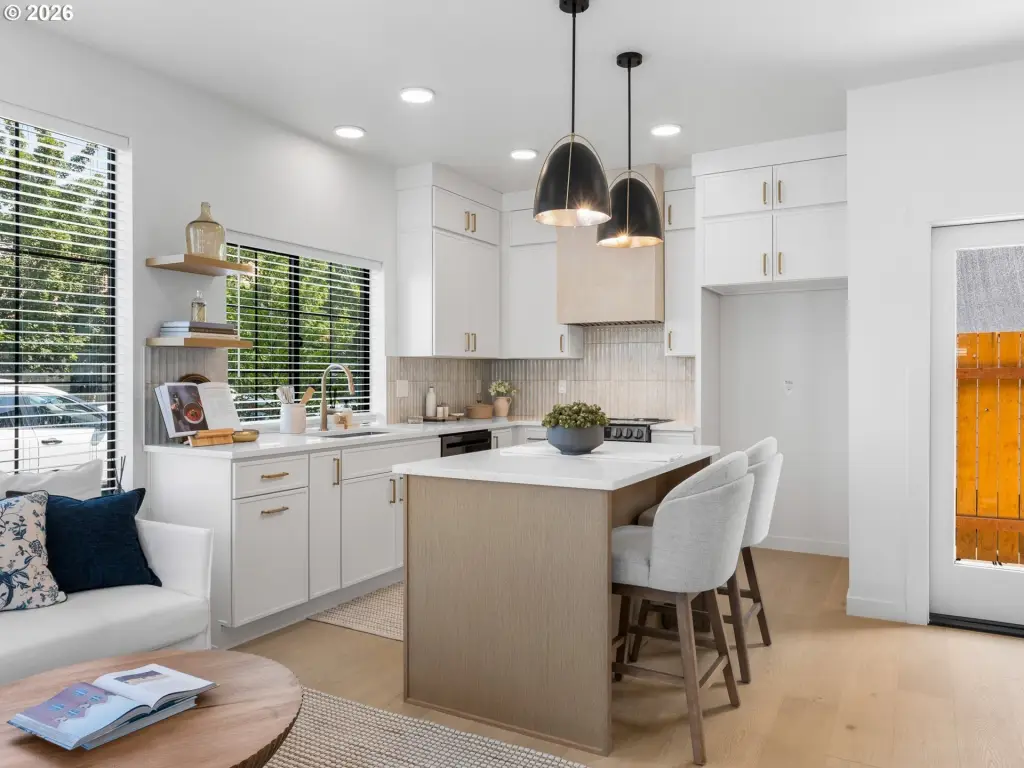
large island
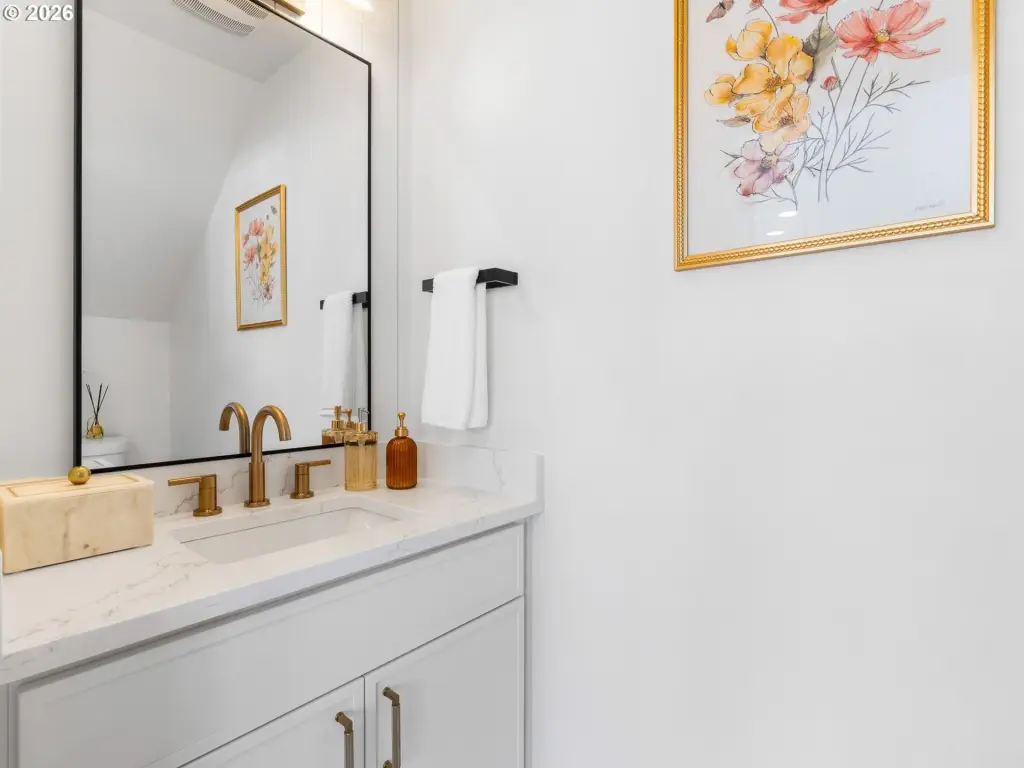
powder bathroom
storage
in unit laundry
private fenced outdoor area
wall mounted bicycle parking
energy efficient heat pumps
Building Details
Year built
2026
Floors in Building
2
Number of units
4
Roof type
Composition
Listing Agency:
Keller Williams Realty Portland Premiere
(503) 597-2444
Listed By:
Darryl Bodle · License #199910100
(503) 709-4632
Added: Aug 27
Changed: Oct 14
Last Checked: Oct 14 at 11:06PM
MLS# 398503183
Copyright © 2026 Regional Multiple Listing Services. All rights reserved. All information provided by the listing agent/broker is deemed reliable but is not guaranteed and should be independently verified.
Investment Insights
Based on property information with market context.
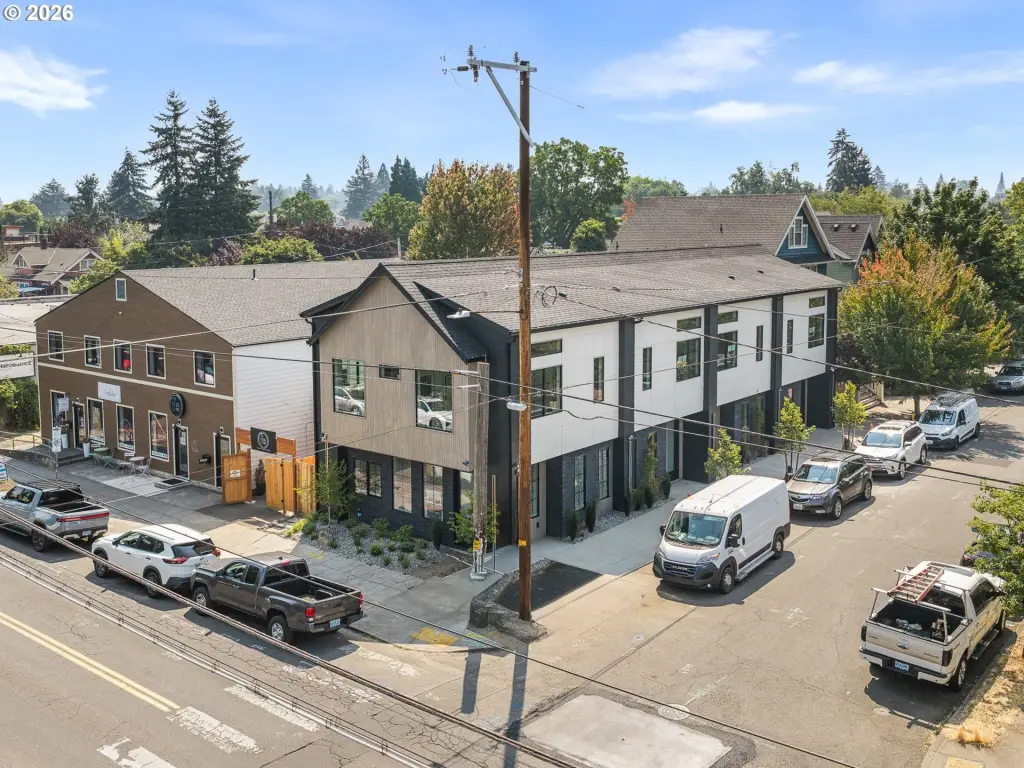
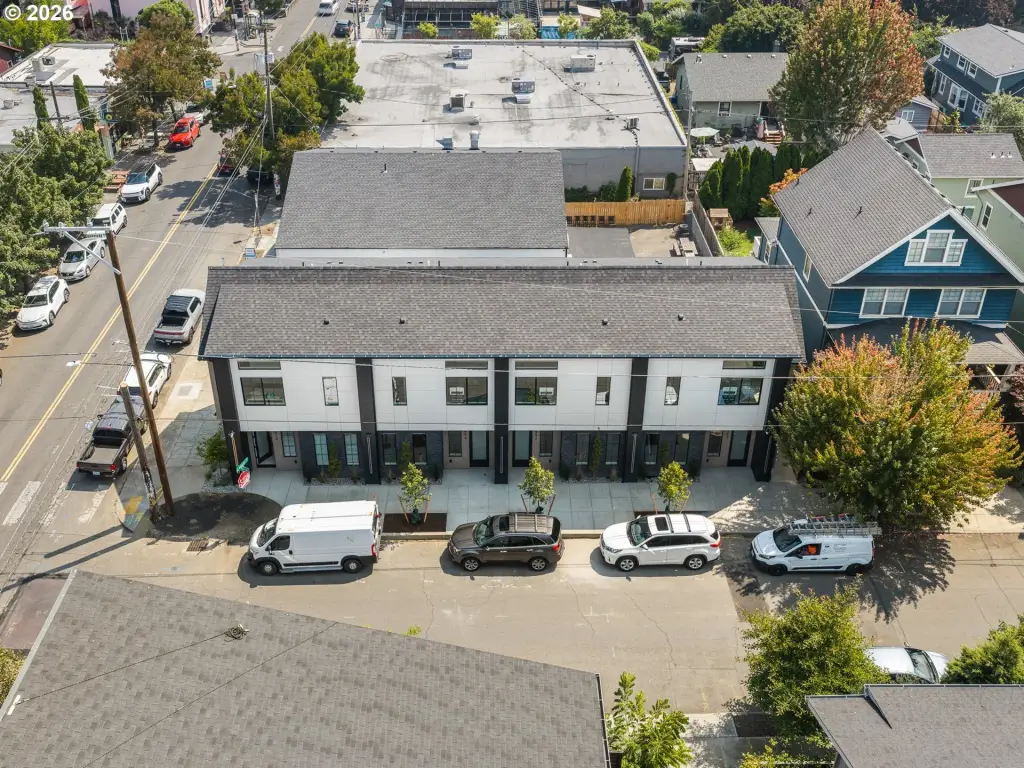
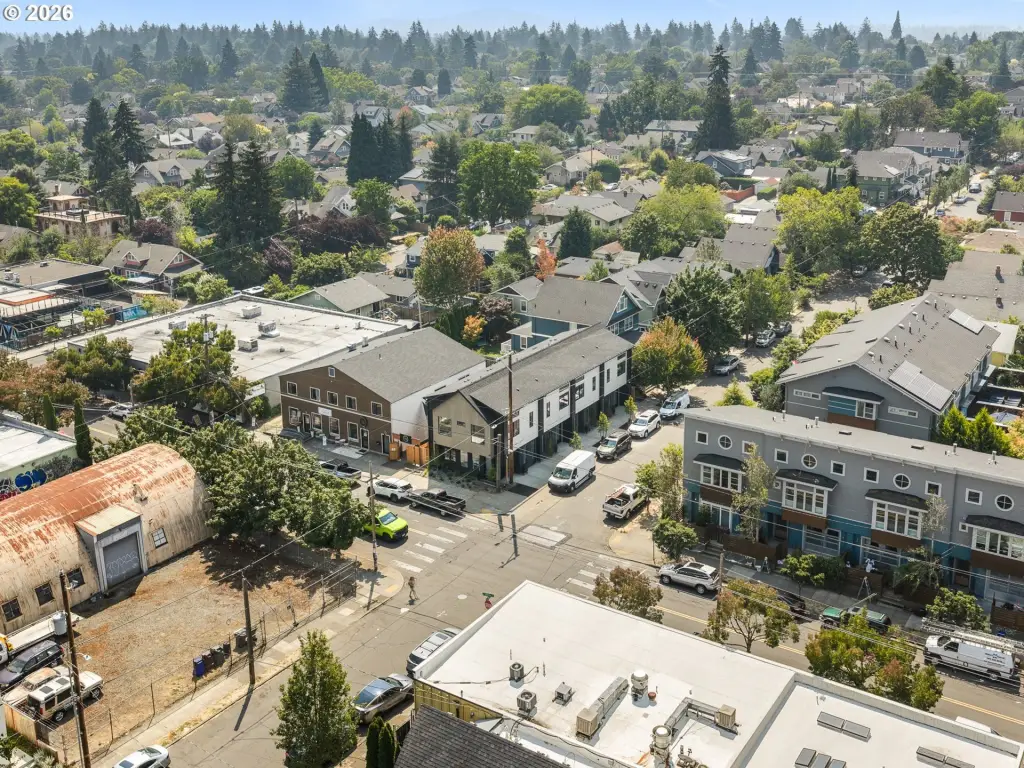
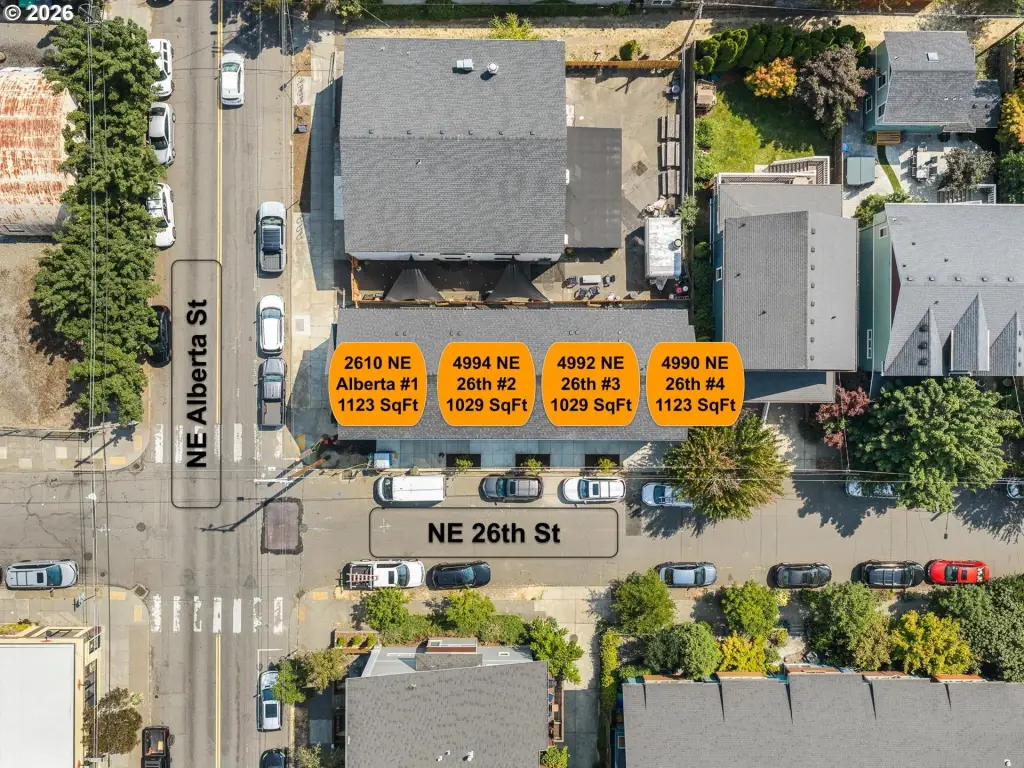
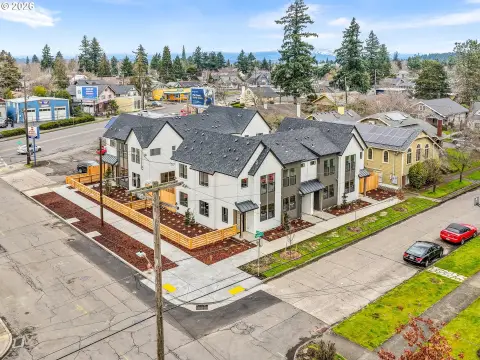
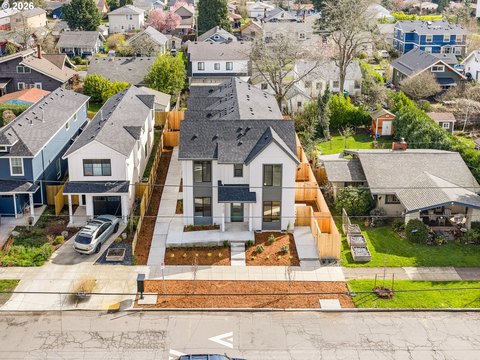
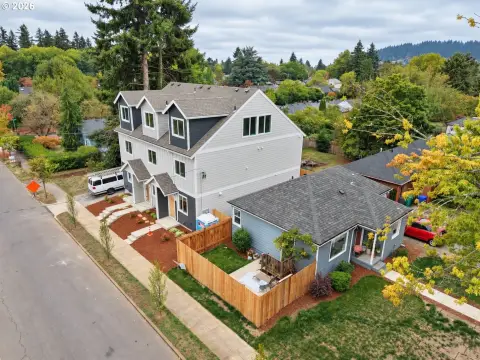
This CM2-zoned quadplex at 4996 NE 26th Ave comprises four separately addressed, two-story residences totaling 4,304 square feet on 0.07 acres. The two end homes measure 1,123 square feet each, while the two interior homes measure 1,029 square feet each. Construction is underway, with completion identified for 2026.
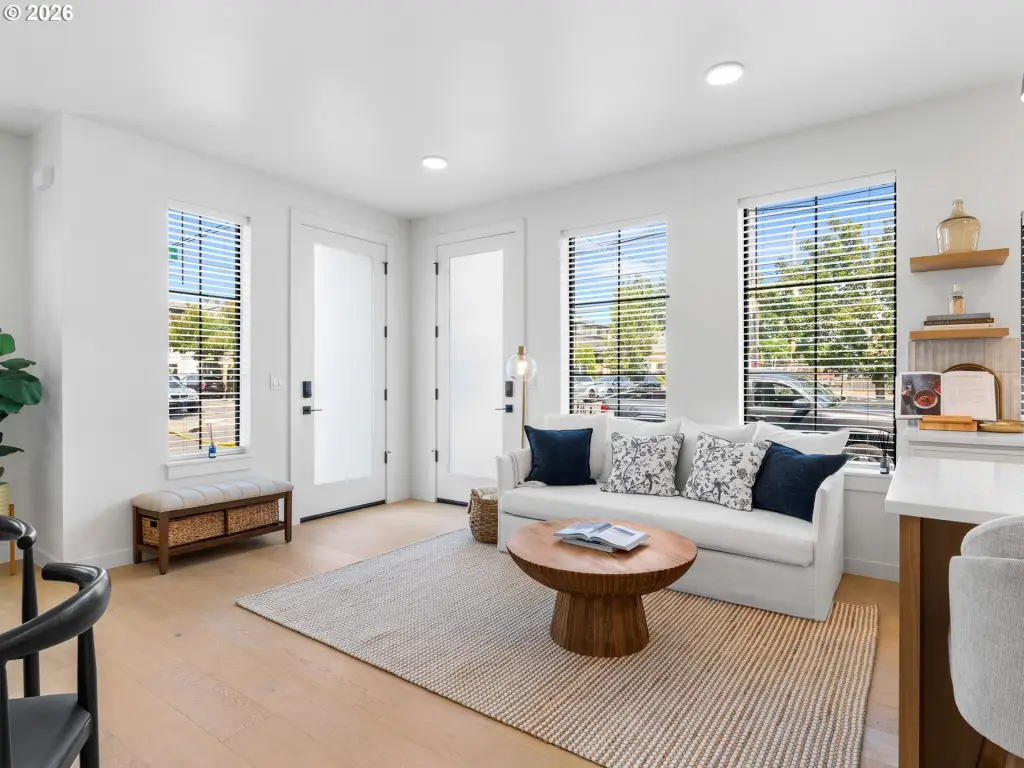
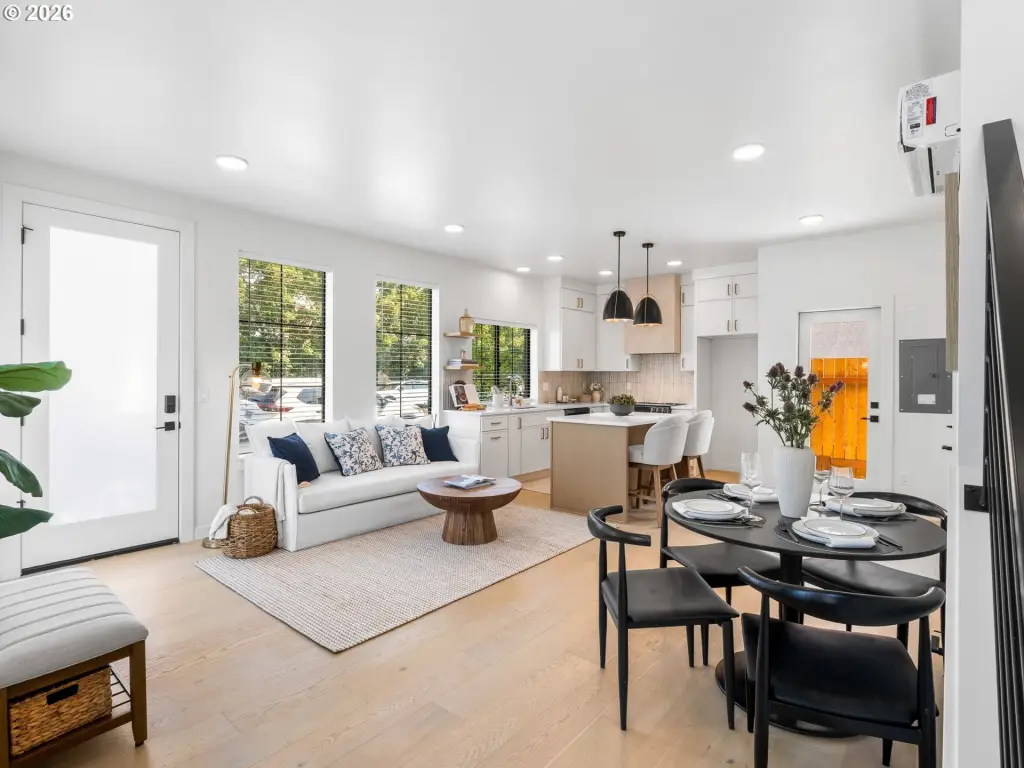
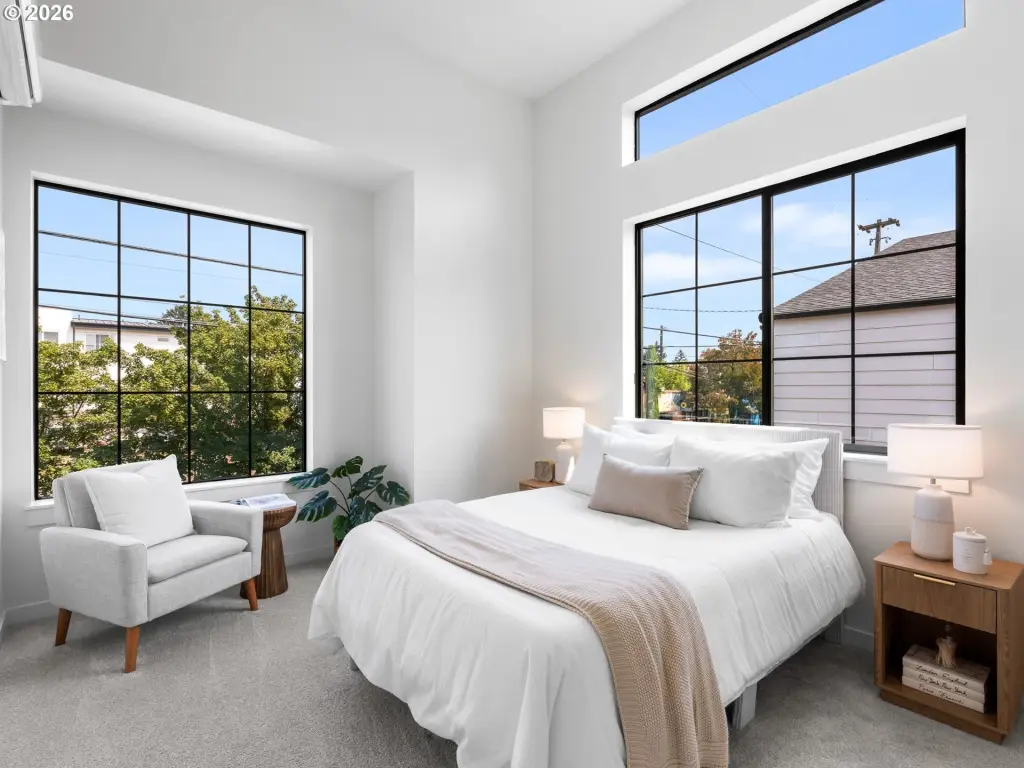
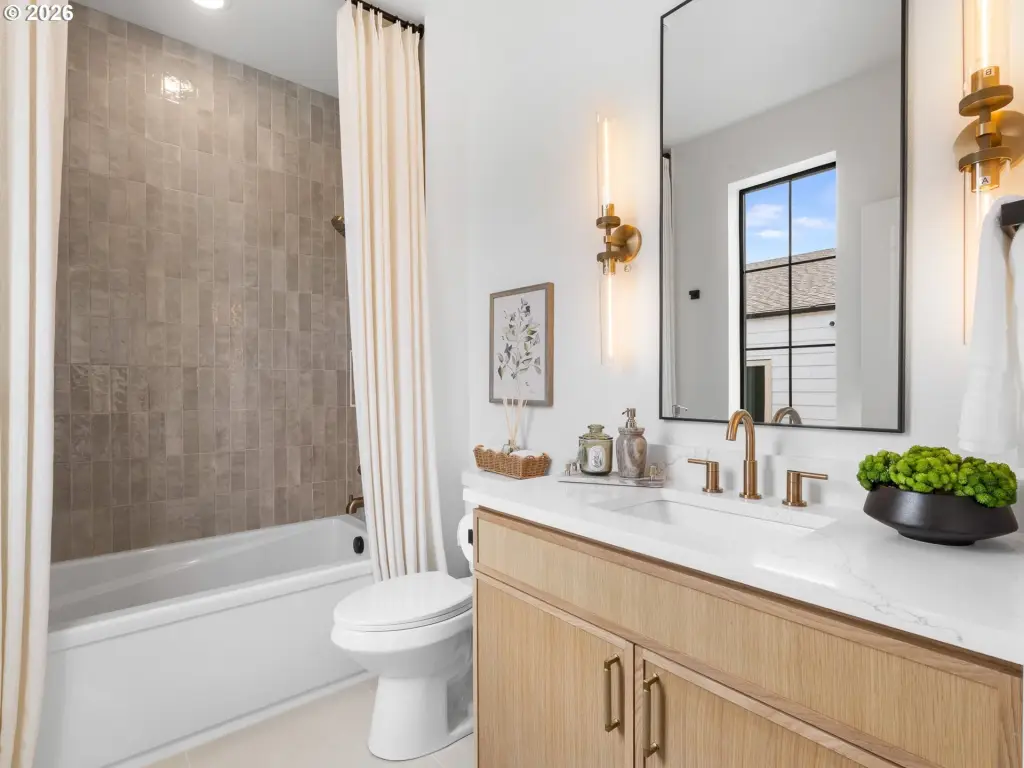
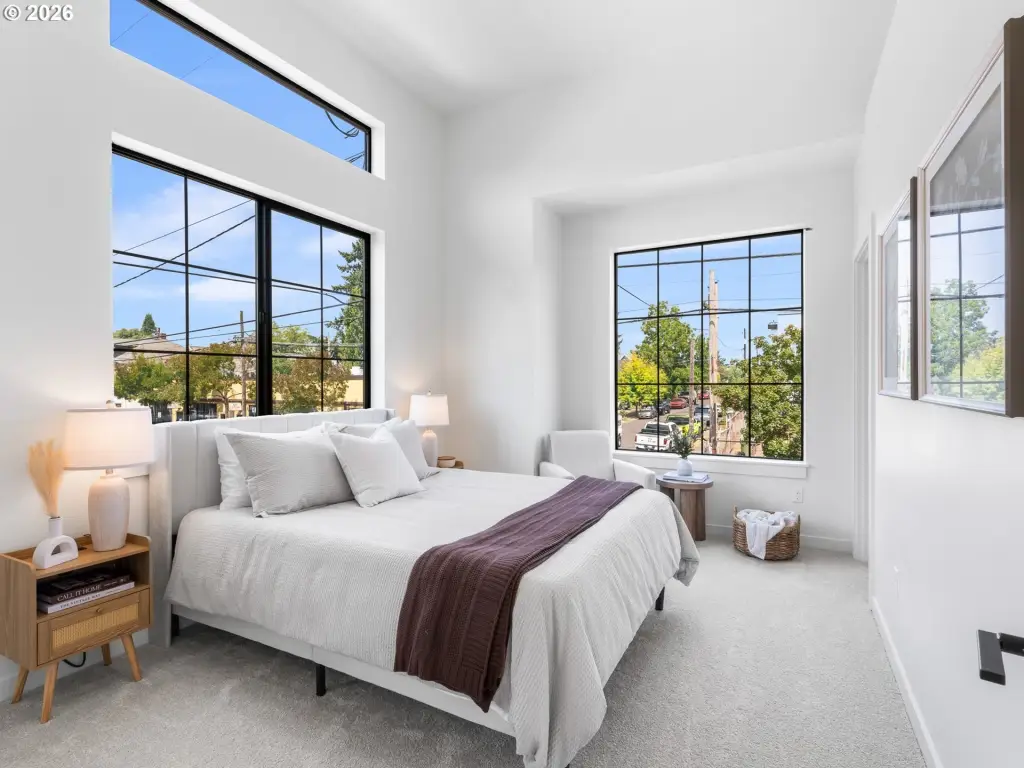
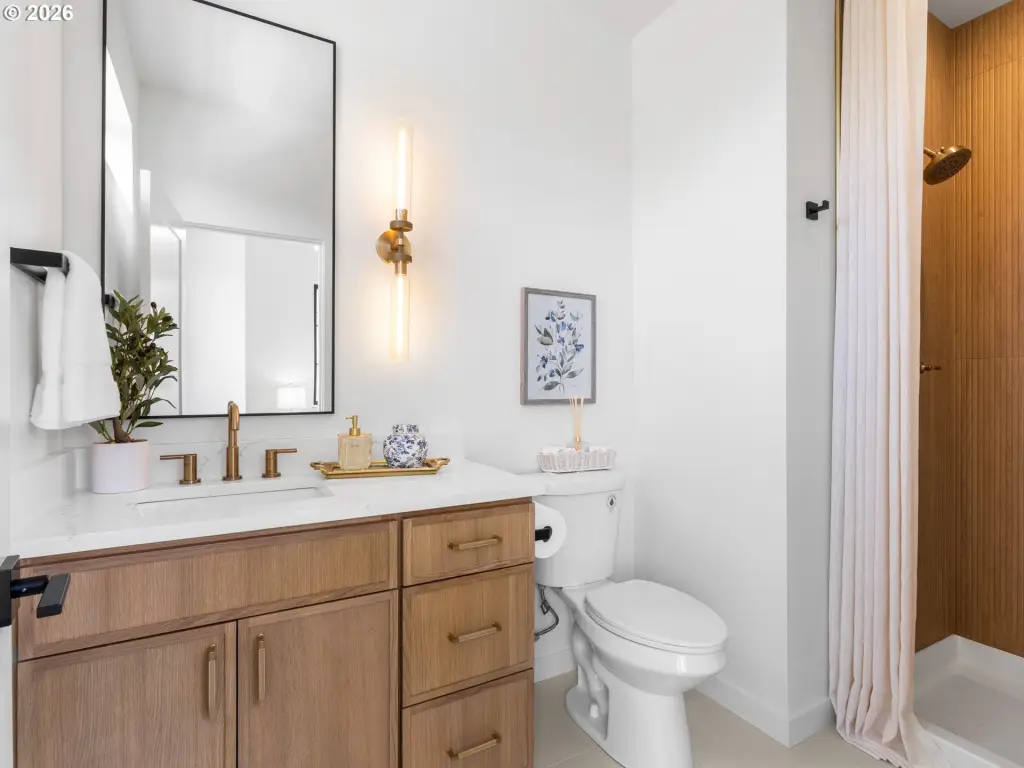
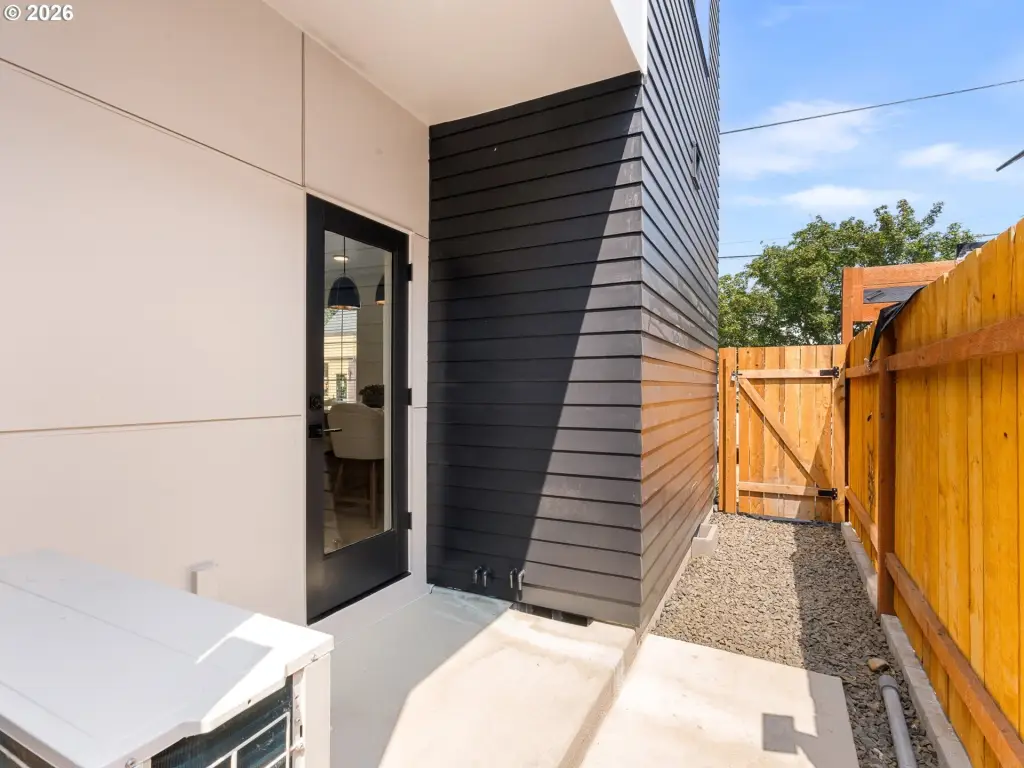
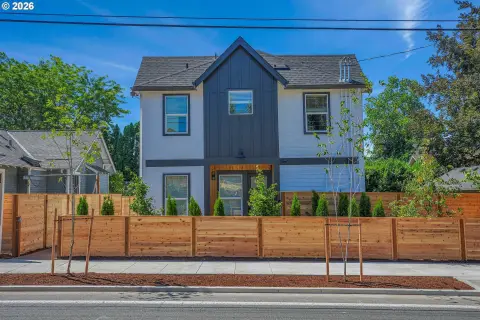
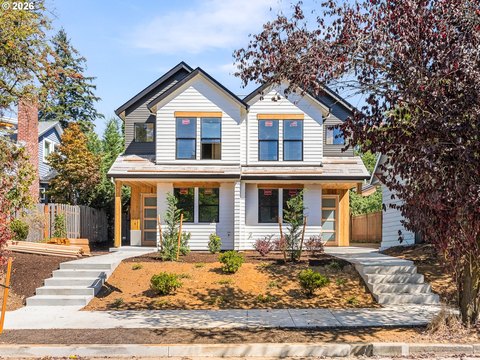
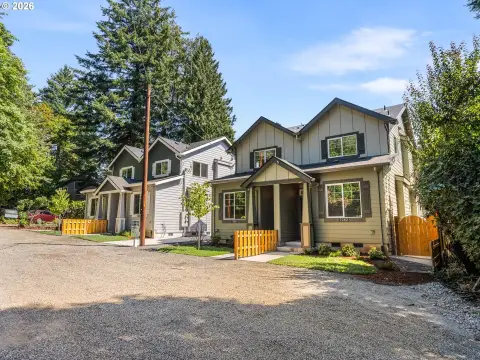
Each residence has two bedrooms and two and one-half bathrooms, along with a private entrance and an open main floor joining the kitchen, living, and dining areas. Upstairs layouts include in-unit laundry and dedicated closet space. Private fenced exterior areas and wall-mounted bicycle storage serve each home, while heat pumps provide heating and cooling. The south end residence has a level sidewalk entry, and the end homes include additional exterior exposure and windows.
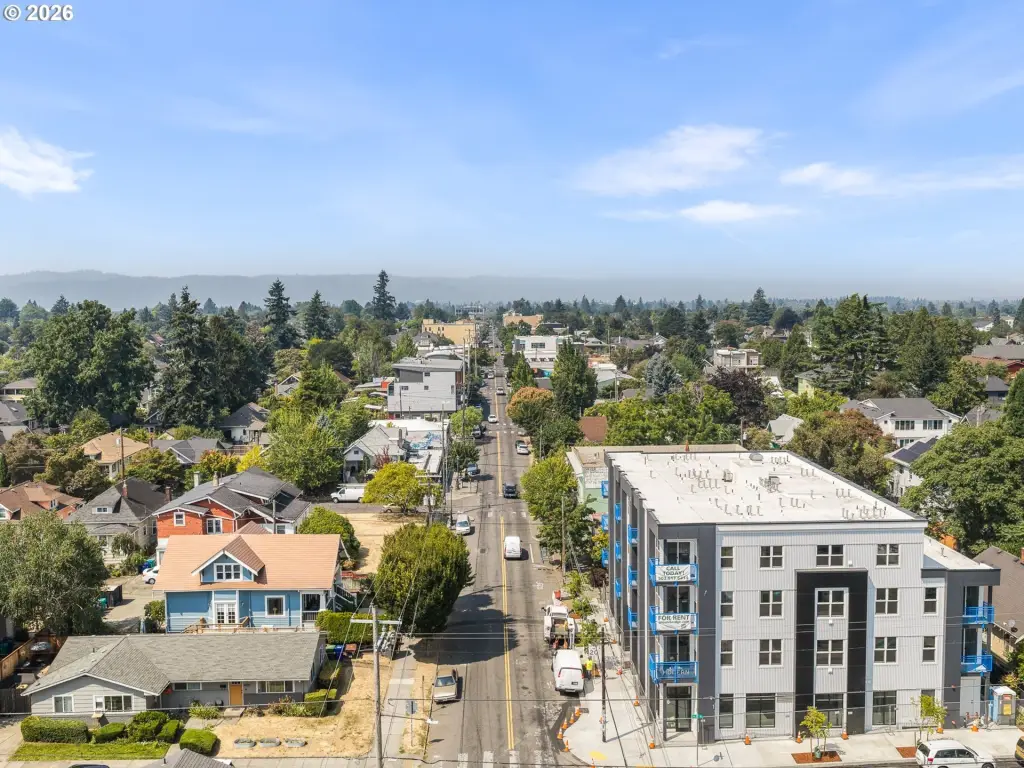
The property is positioned near NE Alberta Street and NE 26th Avenue in Portland’s Concordia area. Nearby destinations identified in the property information include Pine State Biscuits, Great Notion, Salt & Straw, Alberta Rose Theatre, New Seasons Market, neighborhood galleries, boutiques, coffee shops, and transit. A 2-10 Builder Warranty is provided with each home.
Each residence has two bedrooms and two and one-half bathrooms, along with a private entrance and an open main floor joining the kitchen, living, and dining areas. Upstairs layouts include in-unit laundry and dedicated closet space. Private fenced exterior areas and wall-mounted bicycle storage serve each home, while heat pumps provide heating and cooling. The south end residence has a level sidewalk entry, and the end homes include additional exterior exposure and windows.
The property is positioned near NE Alberta Street and NE 26th Avenue in Portland’s Concordia area. Nearby destinations identified in the property information include Pine State Biscuits, Great Notion, Salt & Straw, Alberta Rose Theatre, New Seasons Market, neighborhood galleries, boutiques, coffee shops, and transit. A 2-10 Builder Warranty is provided with each home.
Key Highlights
- Four separately addressed residences totaling 4,304 rentable square feet
- Two end units measure 1,123 SF each; two interior units measure 1,029 SF each
- 0.07‑acre CM2‑zoned property at 4996 NE 26th Ave, Portland, OR 97211
Financial Insights
Estimated NOI and Cap Rate
NOI / Yr
$59,979
Cap Rate
3.22%
Suggested Prices Based on Cap Rates
Cap Rate 5%
$1,199,580
$1.2M
Cap Rate 7%
$856,843
$856.8K
Cap Rate 9%
$666,433
$666.4K
Market Conditions
NOI Build-Up for 4,304 SF
Gross rent
$90.4K $21.00/SF
− Vacancy
−$4.7K −$1.09/SF
EGI
$85.7K $19.91/SF
− OpEx
−$25.7K −$5.97/SF
NOI
$60.0K $13.94/SF
Area
Portland, OR
Vacancy
5.20%
Lease Rate
$21.00 /SF/Yr
Expense Ratio
30.00%
Simulate Cap Rate and NOI
Suggested Prices Based on Cap Rates
Cap Rate 5%
$1,199,580
Cap Rate 7%
$856,843
Cap Rate 9%
$666,433
Alternative Uses
Best Use
Multifamily LT 5
$856.8K
$749.7K – $999.7K
NOI $59,979 @ 7.0% cap · market cap 3.22%
Second Best
Apartment 5plus
$789.5K
$690.8K – $921.1K
NOI $55,263 @ 7.0% cap · market cap 2.97%
Theoretical Best
Office A
$1.21M
$1.06M – $1.41M
NOI $84,607 @ 7.0% cap · market cap 4.55%
Zoning and permitted uses should be independently verified with authorities.
How Realmo checks its estimates
Property Analytics
Unlock full access to Insights
Subscribe to Realmo Intelligence
Open Analytics
Current Use
Lease Details
4
Residential units
Yes
Paved road access
Location Intelligence
Trade Area within ½ mile
860
Businesses Nearby
Explore this area
Business Placement
Demographics for 97211, OR
33,762
Population
15,106
Households
2.2
Avg Household Size
38
Median Age
56%
College-Educated
96%
High-School Grad
7.1 sq mi
ZIP Area
4,755
Density / Sq Mi
$109,604
Median Household Income
$59,171
Median Earnings
$1,818
Median Rent
$616,800
Median Home Value
Check the figures for this property
Cap Rate, Value Estimation, Potential NOI and more
View Realmo Analytics
Market
Vacancy Rate% for Multifamily in West region

Questions? Ask Rey
Realmo’s AI knows this listing — price, zoning, demand, history. Ask anything.

Frequently Asked Questions
What type of property is this?
Quadplex - Four separately addressed residences offer private entries, two-story layouts, fenced outdoor areas, and in-unit laundry.
Where is this quadplex located?
The property is located at 4996 NE 26th Ave Portland, OR.
What is the asking price?
The asking price for this property is $1,859,900.
What are key features of this property?
This property features: Four separately addressed residences totaling 4,304 rentable square feet; Two end units measure 1,123 SF each; two interior units measure 1,029 SF each; 0.07‑acre CM2‑zoned property at 4996 NE 26th Ave, Portland, OR 97211


